टी.वी. सेटों का निर्माता तीसरे वर्ष में 600 टी.वी. तथा 7वें वर्ष में 700 टी.वी. सेटों का उत्पादन करता है। यह मानते हुए कि प्रत्येक वर्ष उत्पादन में एक समान रूप से एक निश्चित संख्या में वृद्धि होती है, ज्ञात कीजिए |
(i) प्रथम वर्ष में उत्पादन (ii) 10वें वर्ष में उत्पादन (iii) प्रथम 7 वर्षों में कुल उत्पादन
The correct Answer is:(i) 550, (ii) 775, (iii) 4375
Step by step video, text & image solution for टी.वी. सेटों का निर्माता तीसरे वर्ष में 600 टी.वी. तथा 7वें वर्ष में 700 टी.वी. सेटों का उत्पादन करता है। यह मानते हुए कि प्रत्येक वर्ष उत्पादन में एक समान रूप से एक निश्चित संख्या में वृद्धि होती है, ज्ञात कीजिए | (i) प्रथम वर्ष में उत्पादन (ii) 10वें वर्ष में उत्पादन (iii) प्रथम 7 वर्षों में कुल उत्पादन by Maths experts to help you in doubts & scoring excellent marks in Class 10 exams.
Updated on:21/07/2023Topper's Solved these Questions
Similar Questions
निम्नलिखित AP के लिए प्रथम पद और सार्व अंतर लिखिए:
(i) −225,−425,−625,−825……..
(ii) 32,12,−12,−32,……….
View Solutionब्यास 35 m वाले एक वृत्त की परिधि ज्ञात कीजिए।
View Solutionऔद्योगिक उत्पादन में सूक्ष्मजीव
View SolutionThe bar chart shows the annual food grain production (in million tonnes) for years 2012-2017. For how many years is the production less than the average production during the given period? यह दंड आरेख वर्ष 2012-2017 की अवधि में वार्षिक खाद्यान्न उत्पादन (मिलियन टन में ) को दर्शाता है | कितने वर्ष उत्पादन इस अवधि के औसत उत्पादन से कम है ?
View SolutionThe bar graph given below shows the wheat production (in tonnes) of a large farm during the year 2011-2018. In how many years was wheat production higher than the average production of the period? नीचे दिए गए दंड आरेख में वर्ष 2011-2018 के दौरान किसी बड़े फार्म के गेहूं उत्पादन (टन में) को दर्शाया गया है | अवधि के औसत उत्पादन की तुलना में दिए गए कितने वर्षो में गेहूं उत्पादन अधिक था ?
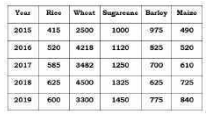
View SolutionIn the following table, the production of various crops (in tonnes) is given from 2015 to 2019. Study the table and answer the question that follows:
दी गयी तालिका में, 2015 से 2019 तक विभिन्न फसलों का उत्पादन (टन में ) दिया गया है | इस तालिका का अध्ययन करें तथा फिर पूछे गए प्रश्न का उत्तर दीजिए | The percentage growth of maize in the year 2019 over the year 2015 is: (correct to one decimal place)
वर्ष 2019 में वर्ष 2015 की तुलना में मक्का के उत्पादन में कितने प्रतिशत की वृद्धि हुई है ? ( दशमलव के एक स्थान तक )
View SolutionStudy the given chart carefully and answer the question accordingly:
दिए गए चार्ट का ध्यानपूर्वक अध्ययन करें और उसके अनुसार प्रश्न का उत्तर दें: In which of the following years was the percentage increase in production from the previous year, the maximum among the given years?
पिछले वर्ष की तुलना में निम्नलिखित वर्षों में से किस वर्ष में उत्पादन में अधिकतम प्रतिशत वृद्धि हुई?
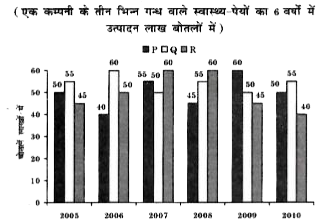
View SolutionWhat was the approximate decline in the prodcution of flavour R in 2010 as compared to the production of 2008 in percentage?
वर्ष 2008 की तुलना में वर्ष 2010 में गन्ध R के उत्पादन में कितने प्रतिशत की कमी आई थी?

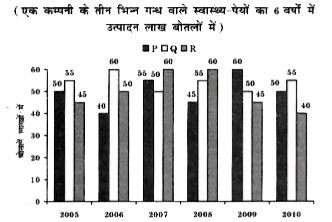
View SolutionThe percentage of the total production of flavour R in 2007 and 2008 with respect to the production of flavour P in 2005 and 2006 is : वर्ष 2007 तथा 2008 में गन्ध R का कुल उत्पादन, वर्ष 2005 तथा 2006 में गन्ध P के उत्पादन की तुलना में कितने प्रतिशत रहा है?
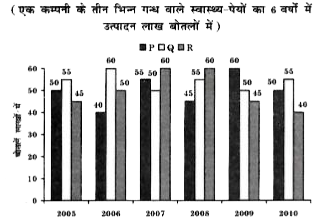
View SolutionWhat is the difference between the average production of flavour Q in 2008, 2009 and 2010 from that of flavour P in 2005, 2006 and 2007 in lakh bottles?
वर्ष 2008, 2009 तथा 2010 में गन्ध के औसत उत्पादन तथा वर्ष 2005, 2006 तथा 2007 में गन्ध P के औसत उत्पादन का अन्तर कितनी बोतलों का रहा है?

View SolutionIn which of the following years the percentage of rise or fall in production from the previous year is maximum for the flavour of Q ?
निम्न में से किस वर्ष में, पिछले वर्ष की तुलना में गन्ध Q के उत्पादन में वृद्धि या हास अधिकतम रहा है?

View SolutionStudy the chart carefully and answer the questions. The chart shows production of an item (in tones) during certain years. The production decreased from 2004-05 to 2005 - 06 by निम्न आरेख का ध्यानपूर्वक अध्ययन कर दिए गए प्रश्नों के उत्तर दें: आरेख किसी वर्ष के दौरान एक मद का उत्पादन (टनों में) दर्शाता है। वर्ष 2004-05 से 2005-06 में उत्पादन में कितनी कमी हुई ?
View SolutionStudy the chart carefully and answer the questions. The chart shows production of an item (in tones) during certain years. The production in 2006-07 in comparison to the production in 2002-03 increased by. निम्न आरेख का ध्यानपूर्वक अध्ययन कर दिए गए प्रश्नों के उत्तर दें: आरेख किसी वर्ष के दौरान एक मद का उत्पादन (टनों में) दर्शाता है। वर्ष 2002-03 की तुलना में 2006-07 में उत्पादन में वृद्धि हुई -
View SolutionThe following figure shows the number of students (in thousands) admitted and passed out per your in a college during years 2000 to 2004, study the figure and answer the questions : : निम्नलिखित आकृति में किसी कॉलेज में वर्ष 2000 से वर्ष 2004 तक प्रति वर्ष भर्ती हुए और उर्तीण हुए छात्रों की संख्या (हजार में) दर्शायी गई है। आकृति का अध्ययन कर प्रश्नों के उत्तर दीजिए : The percent increase in the number of students admitted in the year 2003 over that in 2001 is वर्ष 2001 की तुलना में वर्ष 2003 में भर्ती हुए छात्रों की संख्या में हुई प्रतिशत वृद्धि कितनी है ?
View Solutionनिम्नलिखित में से, वे अभिक्रिया (अभिक्रियाएँ) जो बेन्जैल्डिहाइड का उत्पादन करती है (हैं):
View Solutionनिम्न में से कौन सी अभिक्रिया द्वितीयक ऐल्कोहॉल का उत्पादन करती है?
View Solution
