A particle starts from rest at t=0 and undergoes an acceleration as shown in figure.
Draw the velocity-time graph of the motion of the particle during the interval from zero to 4 second.
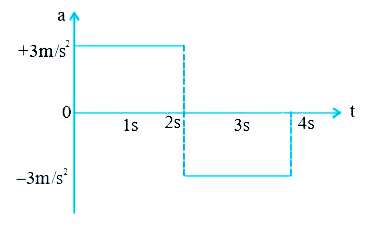
The displacement of the particle in time interval t = 0 to t = 2 is given by
s=ut+12 at2=0+12×3×t232t2
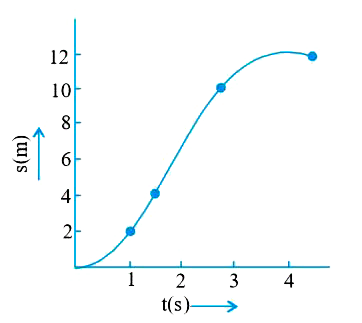
Therefore, the displacement at t = 0, t = 1 s and t = 2 s respectively are 0, 1.5 m and 6 m. In the time interval from t = 2s to t = 4 or t . = 0 or t . = 2s ( t . = t – 2), the displacement is given by
s.=ut.+12a(t.)2=6t.12×3×t2=6t−1.5t2
(Hence for this time interval u=6m/sanda=–3m/s2). The displacement at t . = 1s and t . = 2 i.e., t = 3s and t = 4s are, therefore, (6 –1.5) = 4.5 m and (12 – 6) = 6 m respectively more than the displacement at t = 2s which is 6 m . Hence the displacement at t = 3s and t = 4s are (4.5 + 6) = 10.5 cm and (6 + 6) = 12 m respectively.
These results are tabulated below:
Time (s) 0 1 2 3 4
Displacement (m/s) 0 1.5 6 10.5 12
Figure shows the displacement-time graph of the motion
Topper's Solved these Questions
- Motion in Straight Line Book:VMC MODULES ENGLISHChapter:Motion in Straight Line Exercise:SOLVED EXAMPLES
Explore 20 Videos
- Motion in Straight Line Book:VMC MODULES ENGLISHChapter:Motion in Straight Line Exercise:PRACTICE EXERCISE
Explore 80 Videos
- MOTION IN A STRAIGHT LINE & PLANE Book:VMC MODULES ENGLISHChapter:MOTION IN A STRAIGHT LINE & PLANE Exercise:IMPECCABLE
Explore 52 Videos
- Motion in Two DimensionsBook:VMC MODULES ENGLISHChapter:Motion in Two DimensionsExercise:MCQ
Explore 2 Videos
Similar Questions
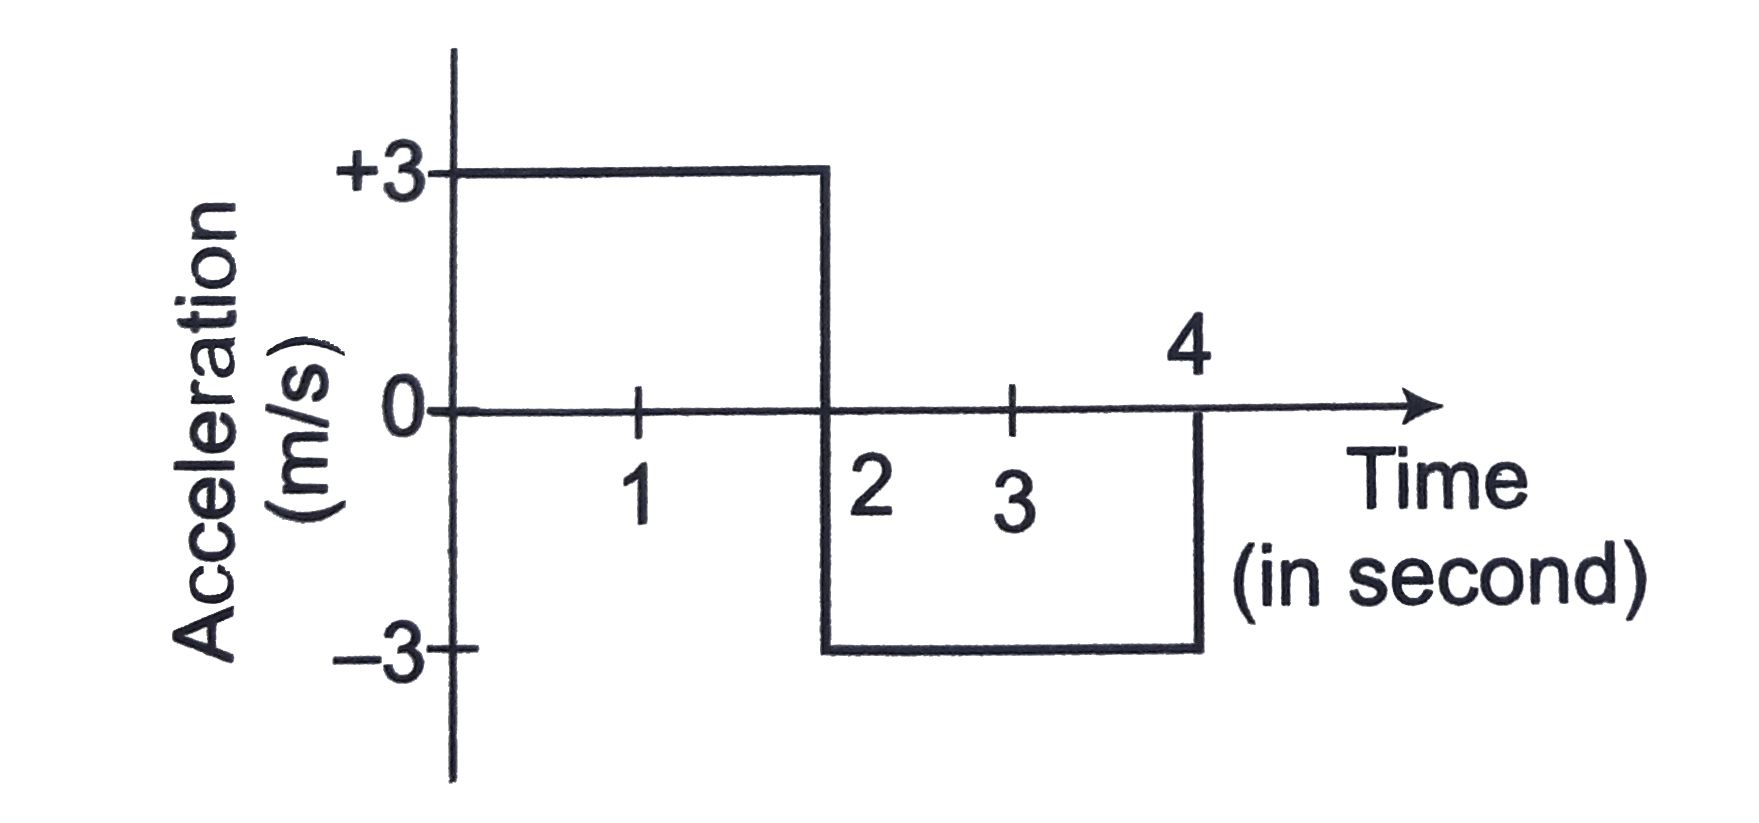
A particle starts from rest at t=0 and moves in a straight line with an acceleration as shown below. The velocity of the particle at t=3 s is
View SolutionA particle starts from rest with a time varying acceleration a=(2t−4). Here t is in second and a in m/s2
The velocity time graph of the particle is
View SolutionA particle starting from rest moves in a straight line with acceleration as shown in the a-t graph. Find the distance (in m) travelled by the particle in the first four seconds from start of its motion.
Q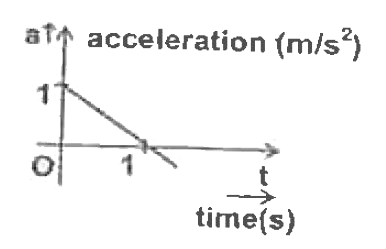
View SolutionA particle starts moving from rest on a straight line. Its acceleration a verses time t is shown in the figure. The speed of the particle is maximum at the instant
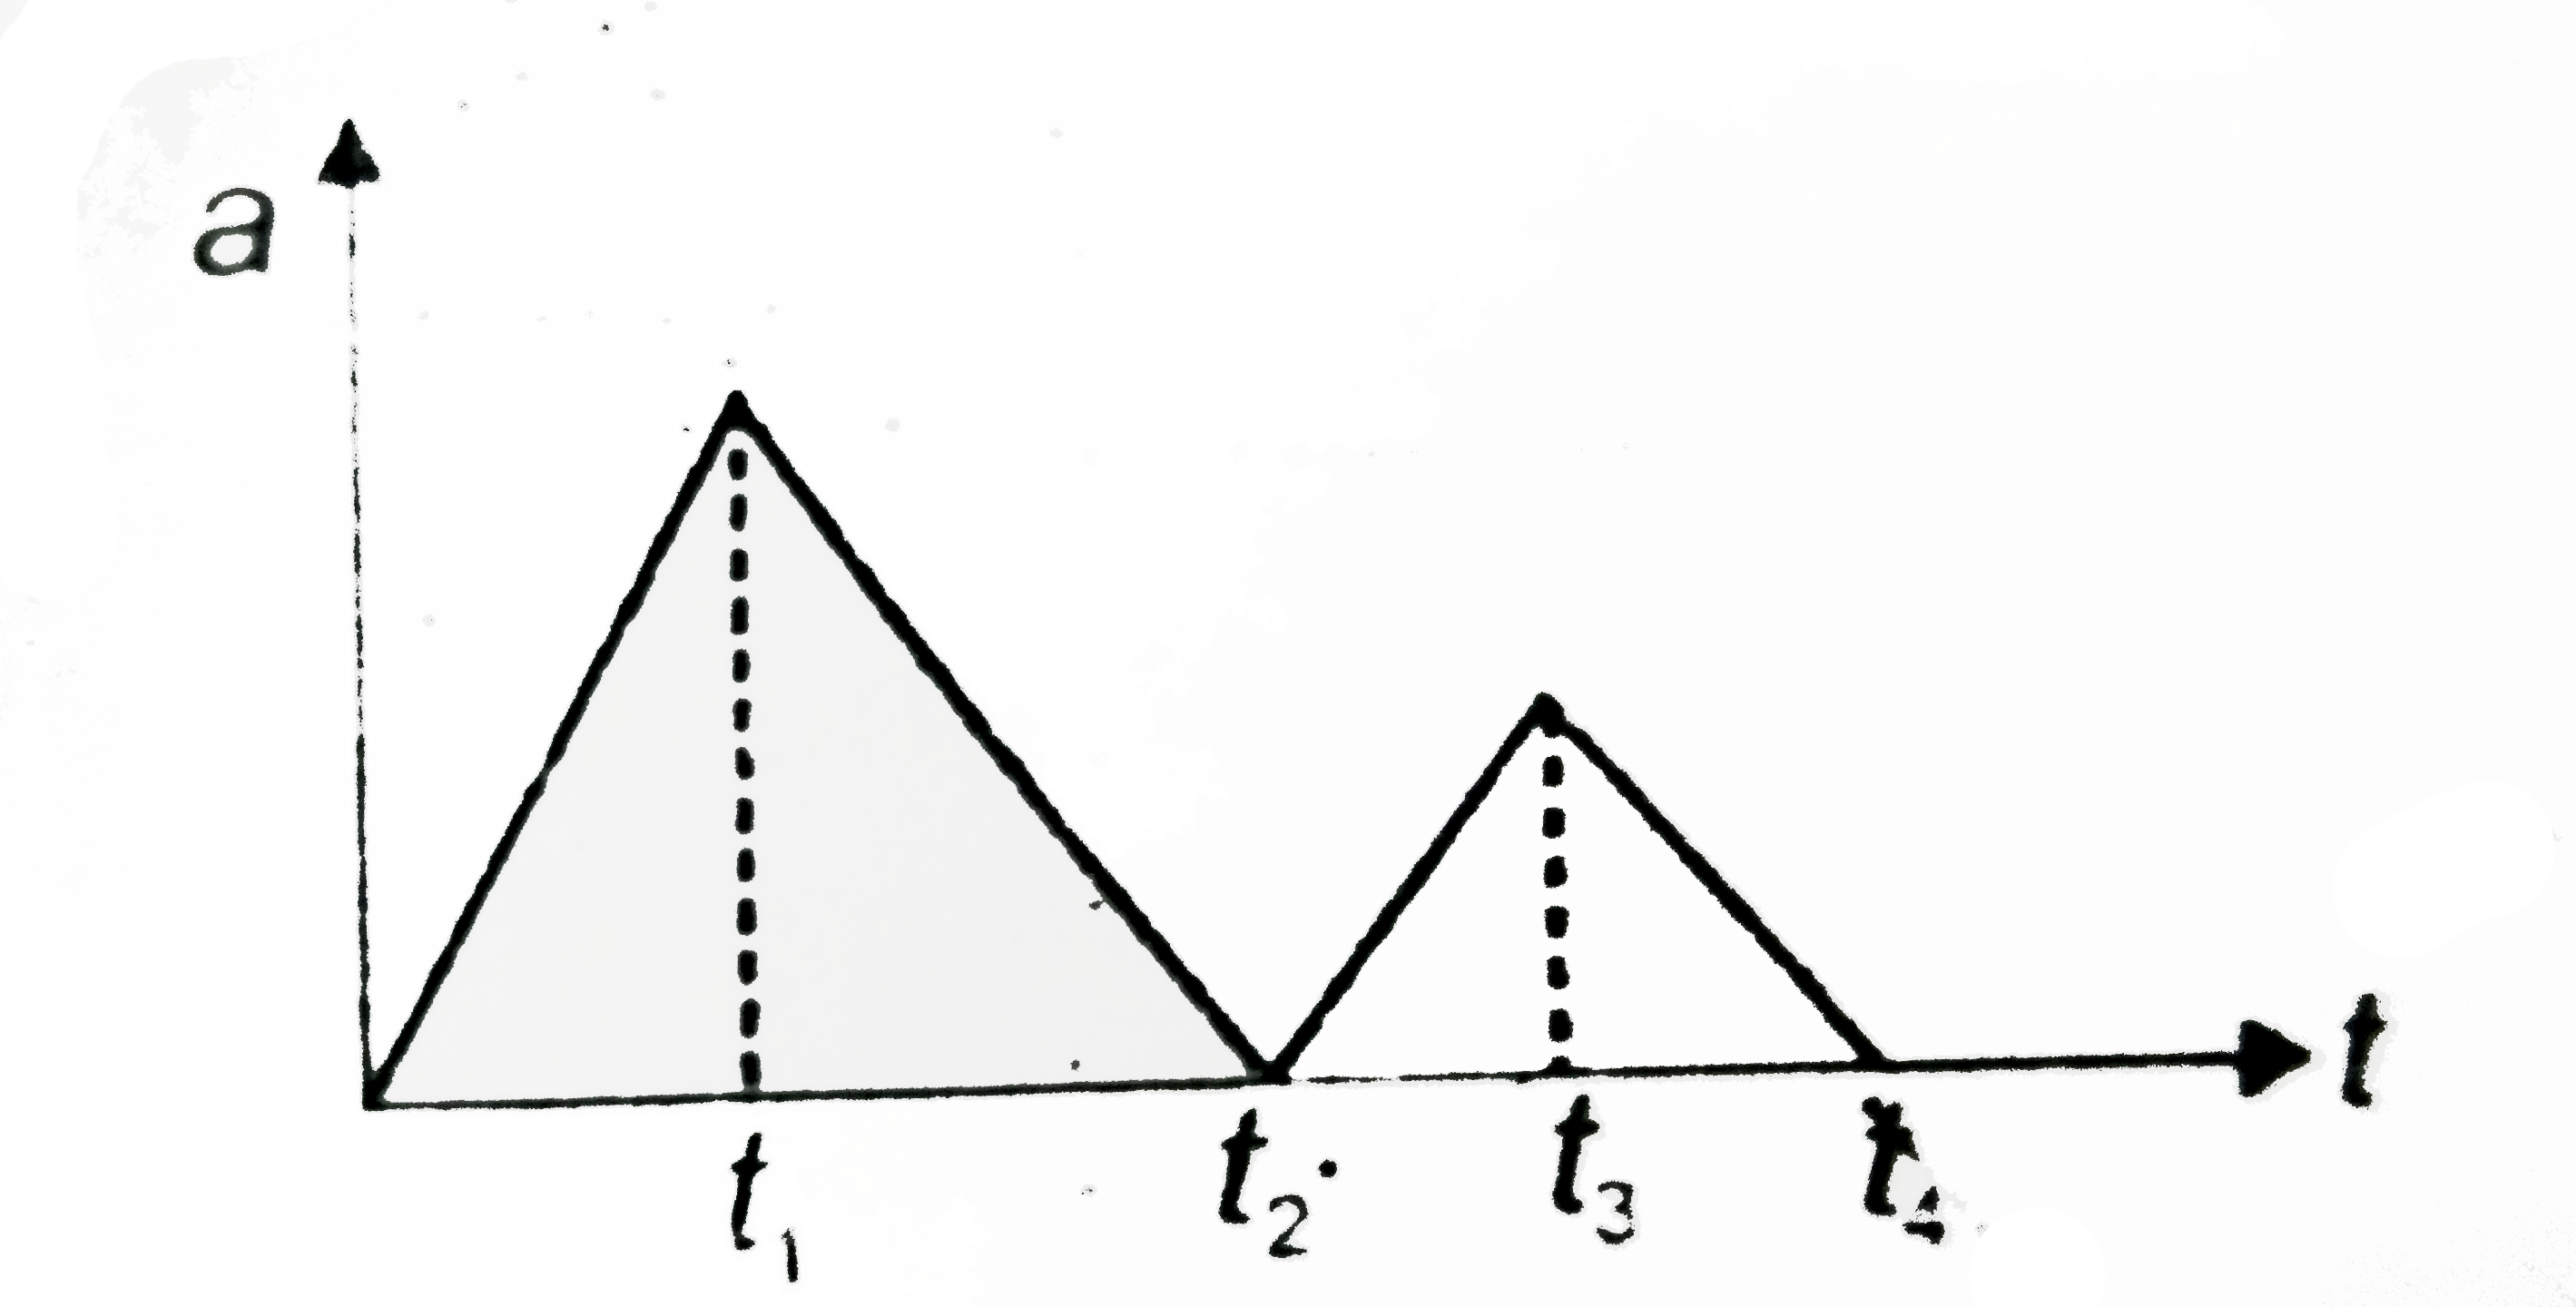
View SolutionA particle starts from rest at time t=0 and moves on a straight line with acceleration as plotted in fig. The speed of the particle will be maximum after time.

View SolutionA particle starts from rest and moves with constant acceleration. Then velocity displacement curve is:
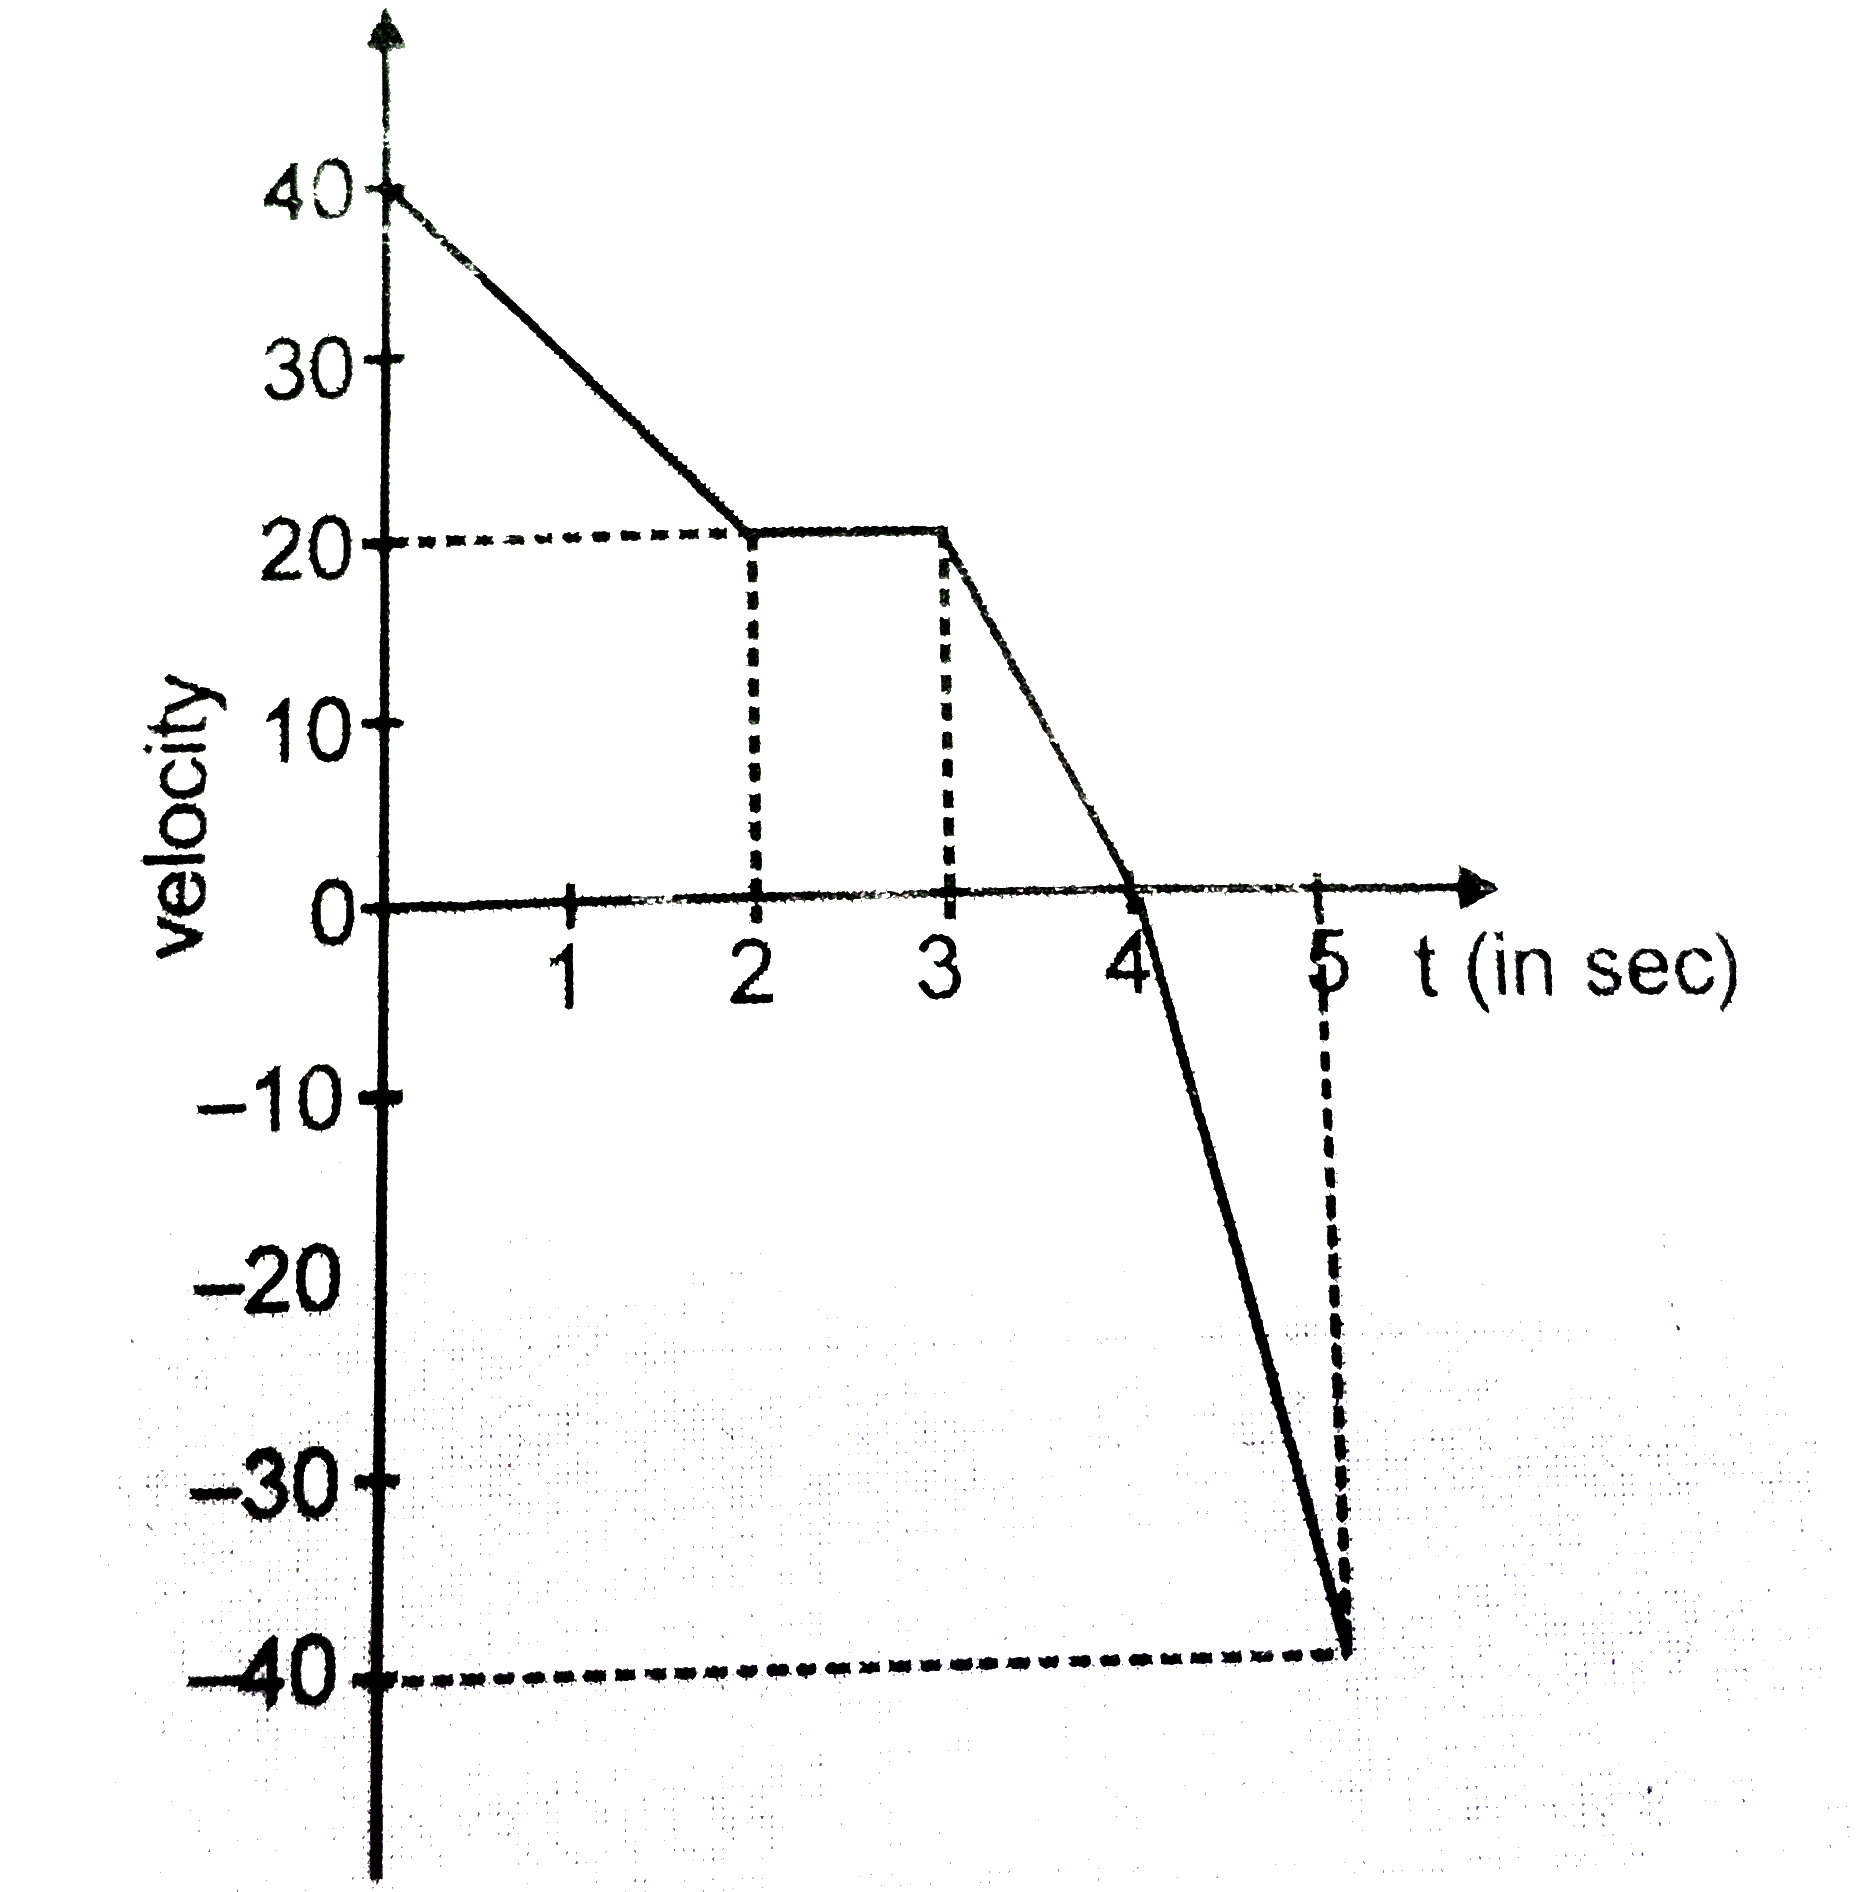
View SolutionA particle starts motion from rest and moves along a straight line. Its velocity-time graph is shown. Find out speed of particle at t=2s and at t=3s.
View SolutionA particle starts from rest and moves with an acceleration of a={2+|t−2|}m/s2 The velocity of the particle at t=4 sec is
View SolutionA particle starts from rest and moves with an acceleration of a={2+|t−2|}m/s2 The velocity of the particle at t=4 sec is
View SolutionA particle starts from rest with constant acceleration. The ratio of space-average velocity to the time average velocity is :-
View Solution