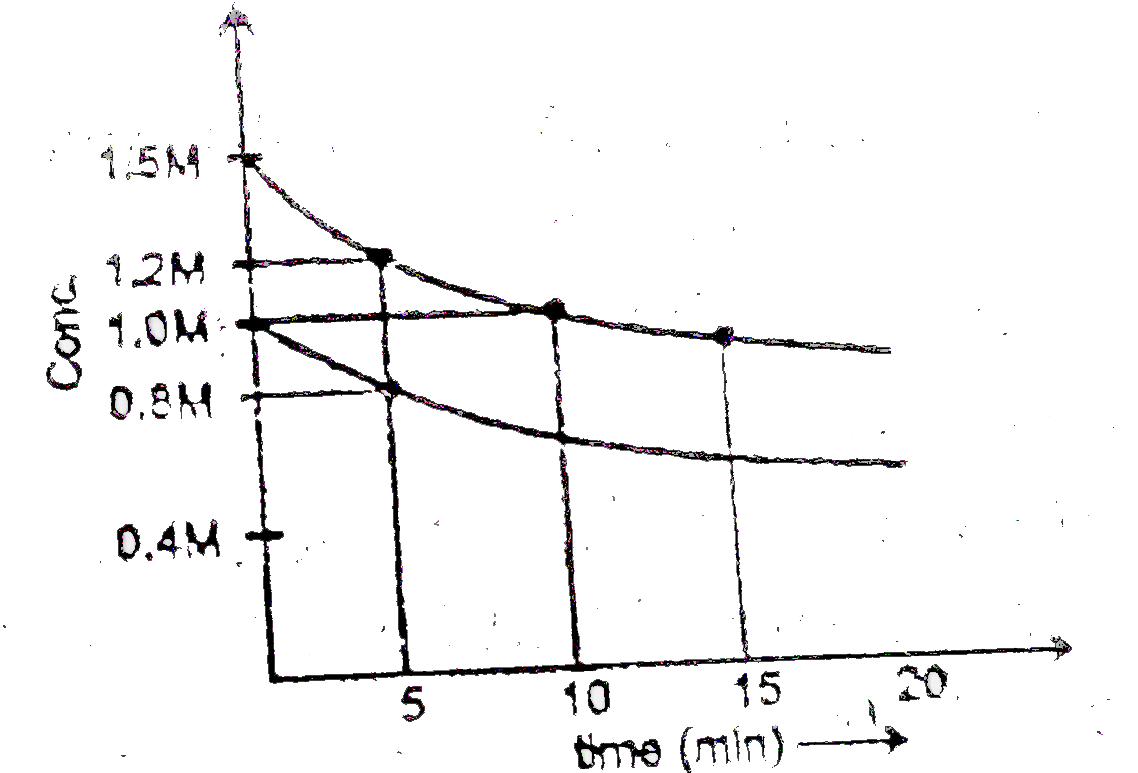
The variation of concentration of 'A' with time in two experiments starting with two different initial concentration of 'A' is given by the following graph.The reaction is represented by A(aq)→B(aq) what is rate of reaction (M/min) when conc. of A in aqueous solution was 1.8 M:

0.072 M min−1
0.1296 M min−1
0.036 M min−1
1 M min−1
The correct Answer is:A
r1=0.35M−1min⇒r2=0.25
r1r2=[A1A2]m⇒0.30.2=(1.51)m⇒m=1: 0.35=k(1.5),k=125
r=125×1.8=0.072M−1min
Topper's Solved these Questions
Similar Questions
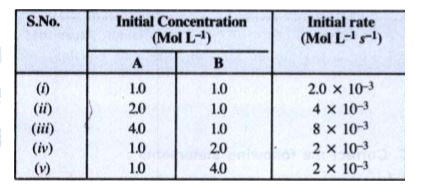
In a reaction between A and B, the initial rate of reaction was measured for different initial concentrations of A and B as given below:

What is the order of reaction with respect to A and B ?
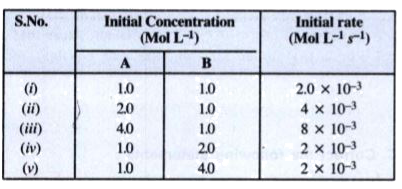
View SolutionIn a reaction between A and B, the initial rate of reaction was measured for different initial concentrations of A and B as given below:

What is the order of reaction with respect to A and B ?
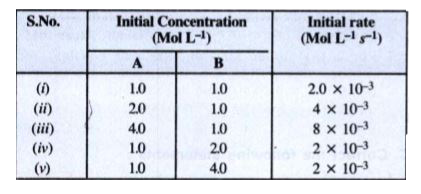
View SolutionIn a reaction between A and B, the initial rate of reaction was measured for different initial concentrations of A and B as given below:

What is the order of reaction with respect to A and B ?
View SolutionRate of reaction, A+B→ products is given below as a function of different initial concentration of

Determine the order of the reaction with respect to A and B. What is the half-life of A in the reaction?
View SolutionConsider the reaction, A+B→C+D.
The initial rate for different initial concentrations of the reactants are given below :

What is the overall order ?
View SolutionConsider the reaction, A+B→C+D.
The initial rate for different initial concentrations of the reactants are given below :

What is the overall order ?
View SolutionConsider the reaction, A+B→C+D.
The initial rate for different initial concentrations of the reactants are given below :

What is the overall order ?
View SolutionConsider the reaction, A+B→C+D.
The initial rate for different initial concentrations of the reactants are given below :

What are the orders with respect to A and B ?
View SolutionConsider the reaction, A+B→C+D.
The initial rate for different initial concentrations of the reactants are given below :

What are the orders with respect to A and B ?
View SolutionConsider the reaction, A+B→C+D.
The initial rate for different initial concentrations of the reactants are given below :

Calculate the rate constant.
View Solution

