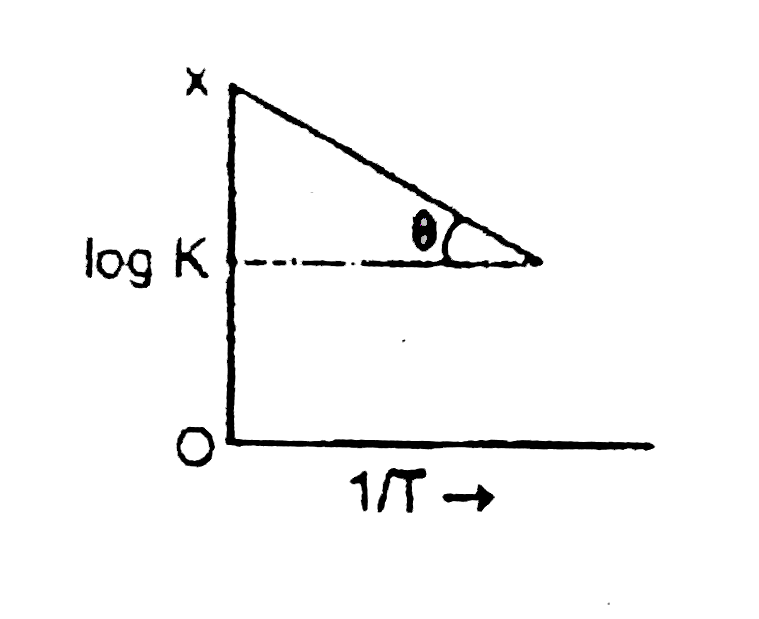
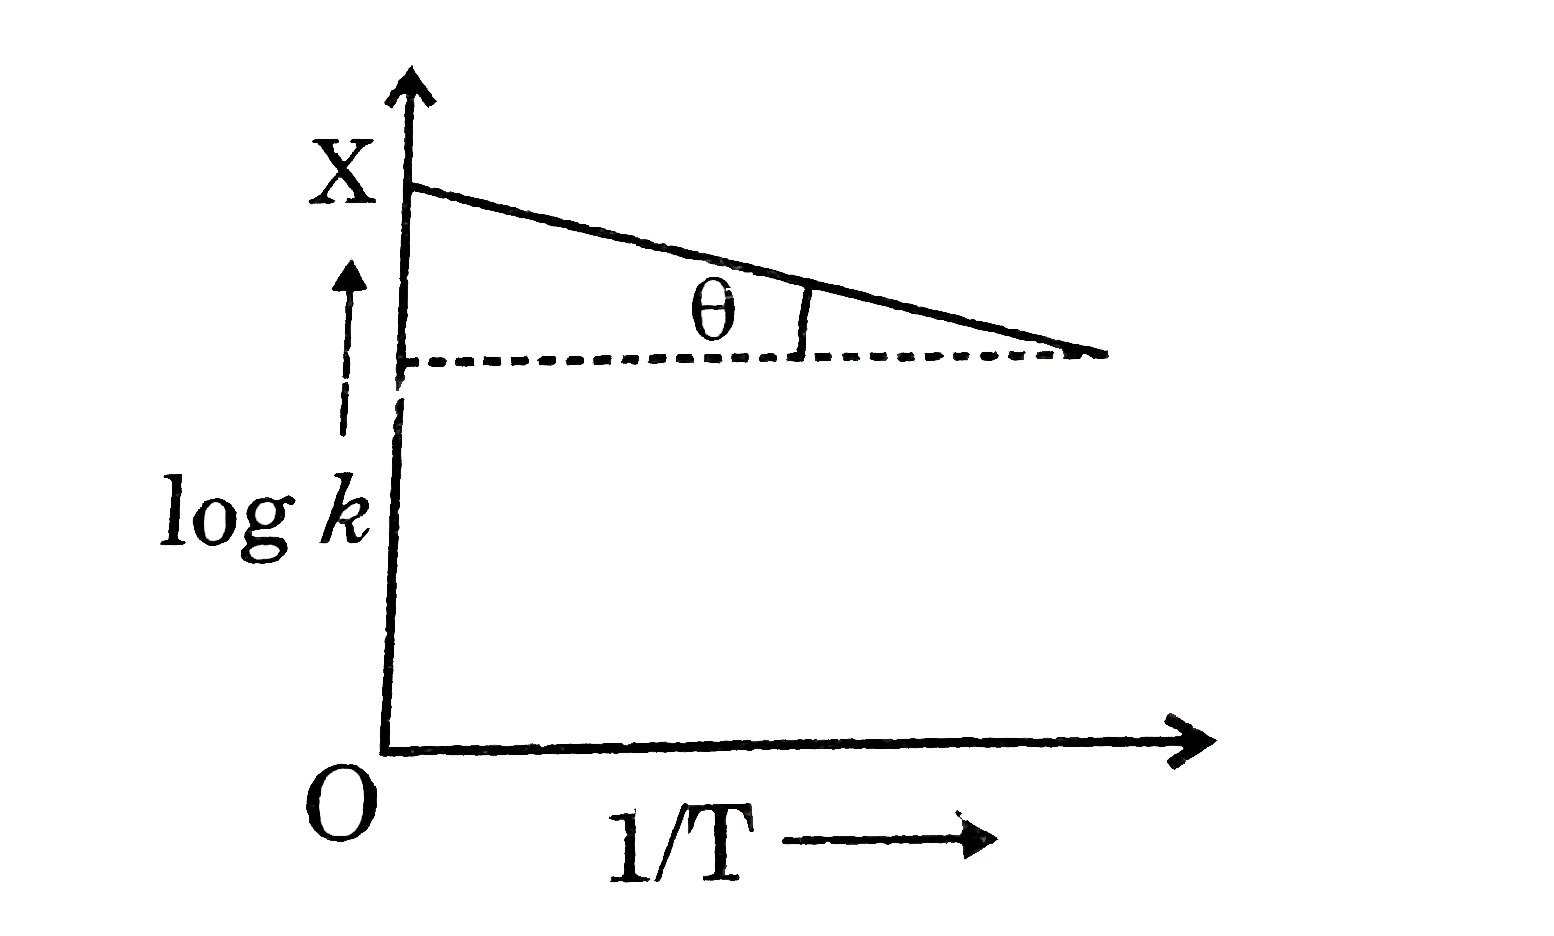
Graph between logk and 1/T [k rate constant (s−1) and T and the temperature (K)] is a straight line with OX=5,θ=tan−1(1/2.303). Hence −Ea will be
![Graph between log k and 1//T [k rate constant (s^(-1)) and T and the temperature (K)] is a straight line with OX =5, theta = tan^(-1) (1//2.303). Hence -E(a) will be](https://d10lpgp6xz60nq.cloudfront.net/physics_images/KSV_PHY_CHM_P2_C04_E01_154_Q01.png)
The correct Answer is:2
2.303logK=−EaRT+2.303logÅ
Thus, −Ea2.303R=tanθ=−12.303
∴Ea=R=2 cal.

Topper's Solved these Questions
Similar Questions
Knowledge Check
In a plot of log k vs 1/T, the slope is
A−Ea/2.303BEa/2.303RCEa/2.303D−Ea/2.303RIn a plot of log k vs 1/T, the slope is
A−Ea/2.303BEa/2.303RCEa/2.303D−Ea/2.303RIn a plot of log k vs 1/T, the slope is
A−Ea/2.303BEa/2.303RCEa/2.303D−Ea/2.303R
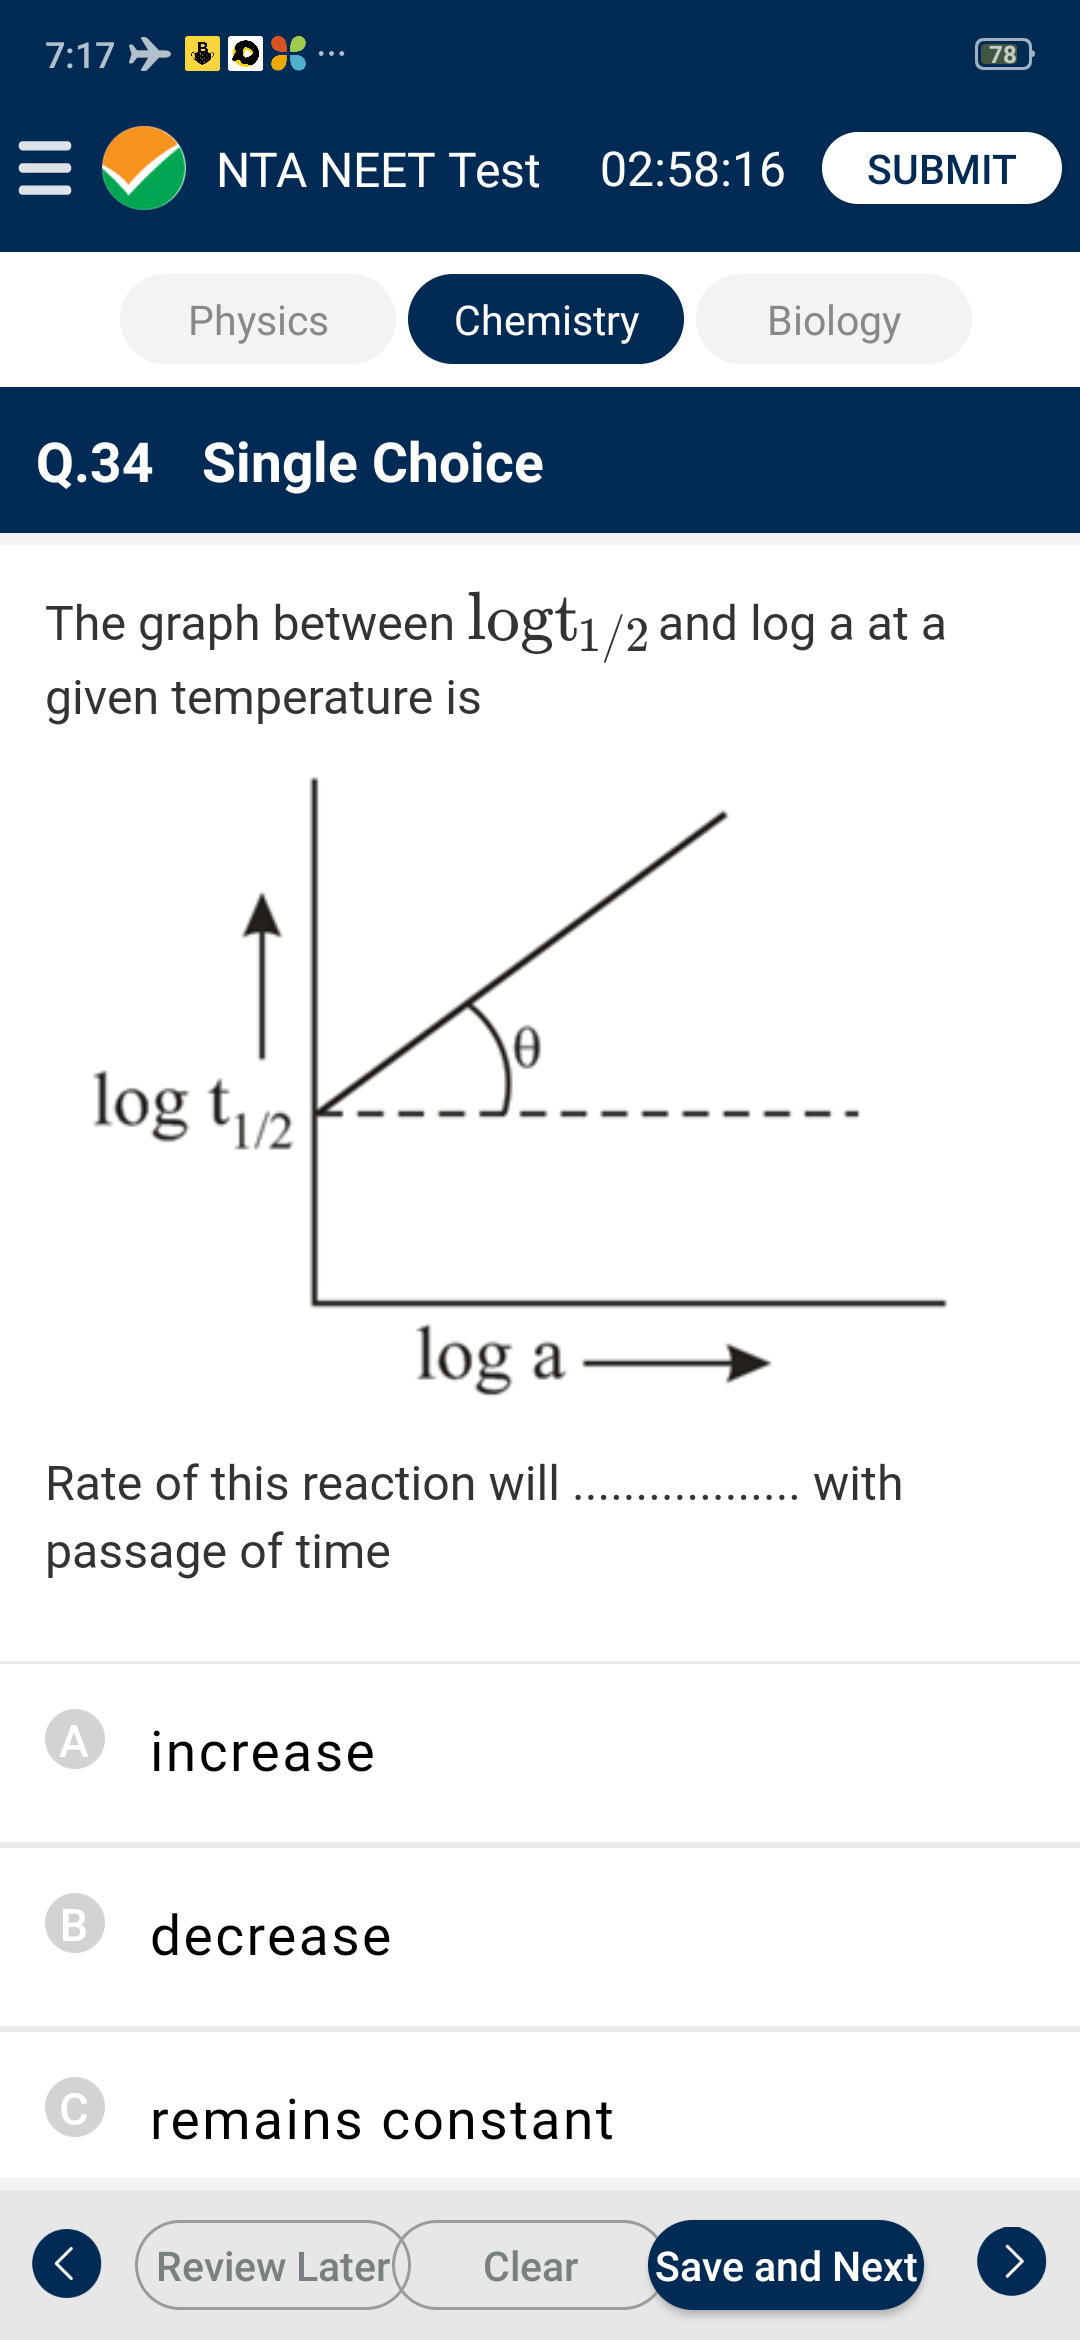
The graph between log t1/2 and log a at a given temperature is

Rate of this reaction will …….with passage of time
View SolutionRate constant k varies with temperature by equation logk(−1min)=log5−2000kcalRT×2.303. We can conclude that
View SolutionA plot of ln k against 1T (abscissa) is expected to be a straight line with intercept on coordinate axis equal to
View SolutionTwo reaction : X→ Products and Y→ Products have rate constants k1 and k2 at temperature T and activation energies E1 and E2, respectively. If k1>k2 and E1<E2 (assuming that the Arrhenius factor is same for both the Products), then
(I) On increaisng the temperature, increase in k2 will be greater than increaisng in k1.
(II) On increaisng the temperature, increase in k1 will be greater than increase in k2.
(III) At higher temperature, k1 will be closer to k2.
(IV) At lower temperature, k1<k2
View SolutionActivation energy (Ea) and rate constants (k1andk2) of a chemical reaction at two different temperature (T1andT2) are related by
View Solution


