Which is correct graph :
The correct Answer is:A,B,C
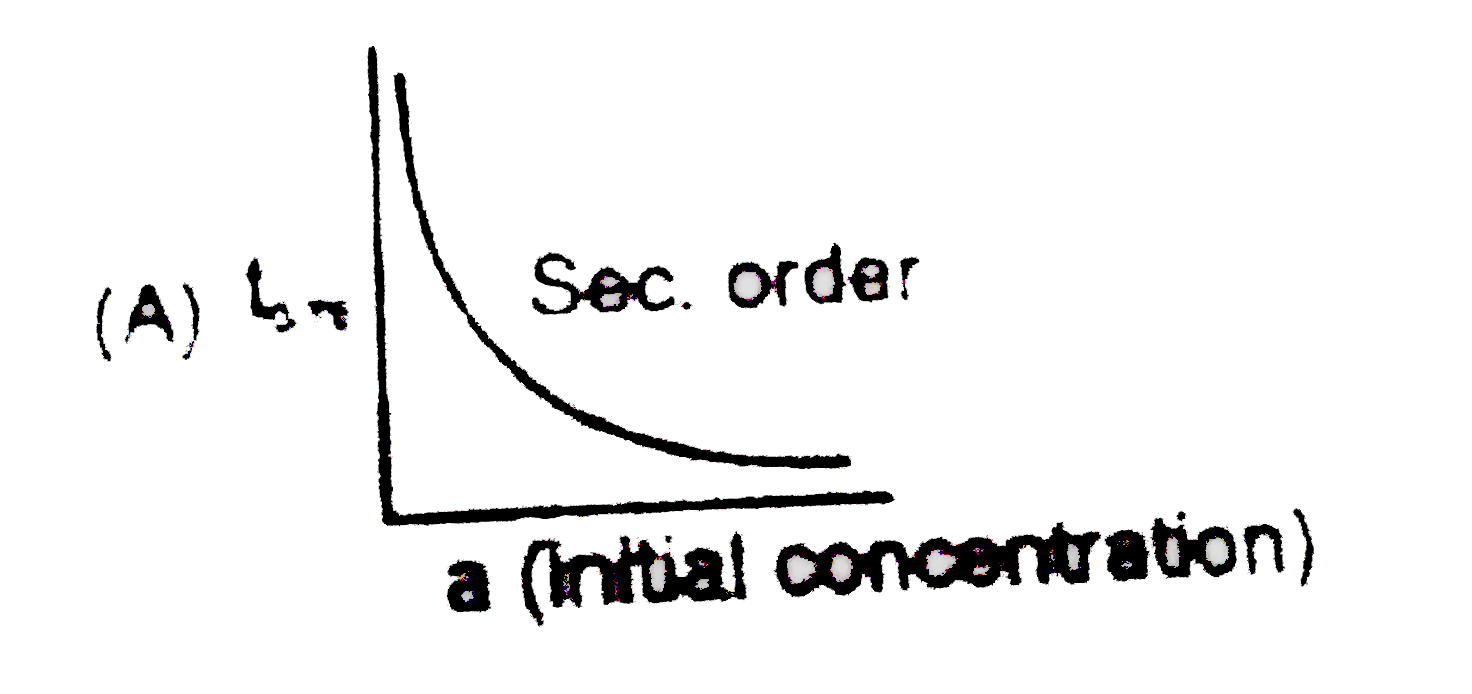
To determine which graph is correct for the given reactions, we need to analyze each option based on the principles of chemical kinetics.
1. Understanding Second-Order Reactions:
- For a second-order reaction, the half-life (t1/2) is inversely proportional to the initial concentration (C0):
t1/2∝1C0
- This implies that if we plot t1/2 against C0, we will get a rectangular hyperbola. Therefore, Option A is correct.
Hint: Recall that for second-order reactions, the half-life is dependent on the concentration of the reactant.
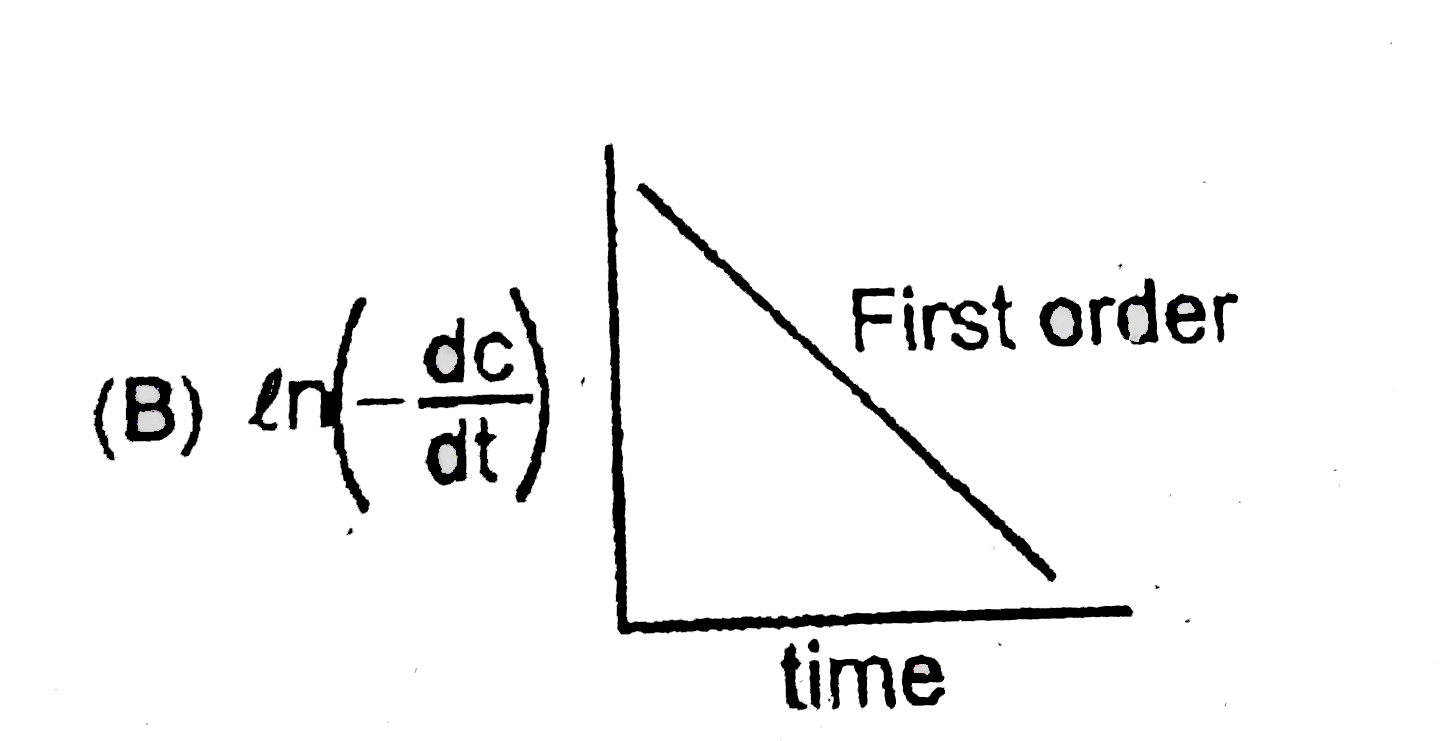
2. Analyzing First-Order Reactions:
- For a first-order reaction, the rate of change of concentration is given by:
−dCdt=kC
- Integrating this gives:
C=C0e−kt
- Taking the natural logarithm, we find:
ln(−dCdt)=ln(kC0)−kt
- This indicates a linear relationship where the slope is negative. Thus, Option B is also correct.
Hint: Remember that for first-order reactions, the natural logarithm of the concentration change over time leads to a straight line.
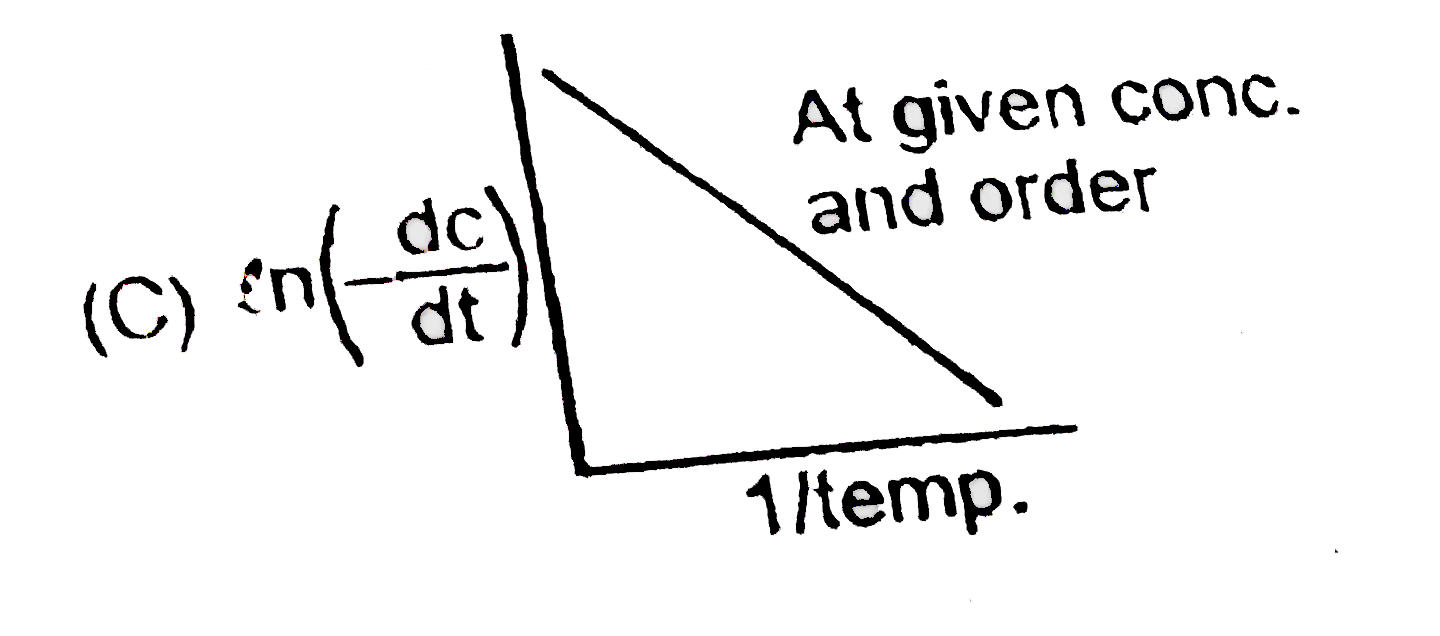
3. Graph of ln(-dC/dt) vs. 1/T:
- For any reaction, we can express the rate constant k using the Arrhenius equation:
k=Ae−EaRT
- Substituting this into the expression for −dCdt leads to:
ln(−dCdt)=nln(C)+ln(A)−EaRT
- At constant concentration, the graph of ln(−dCdt) versus 1T will also be linear with a negative slope. Therefore, Option C is correct.
Hint: Consider how temperature affects the rate constant and subsequently the rate of reaction.
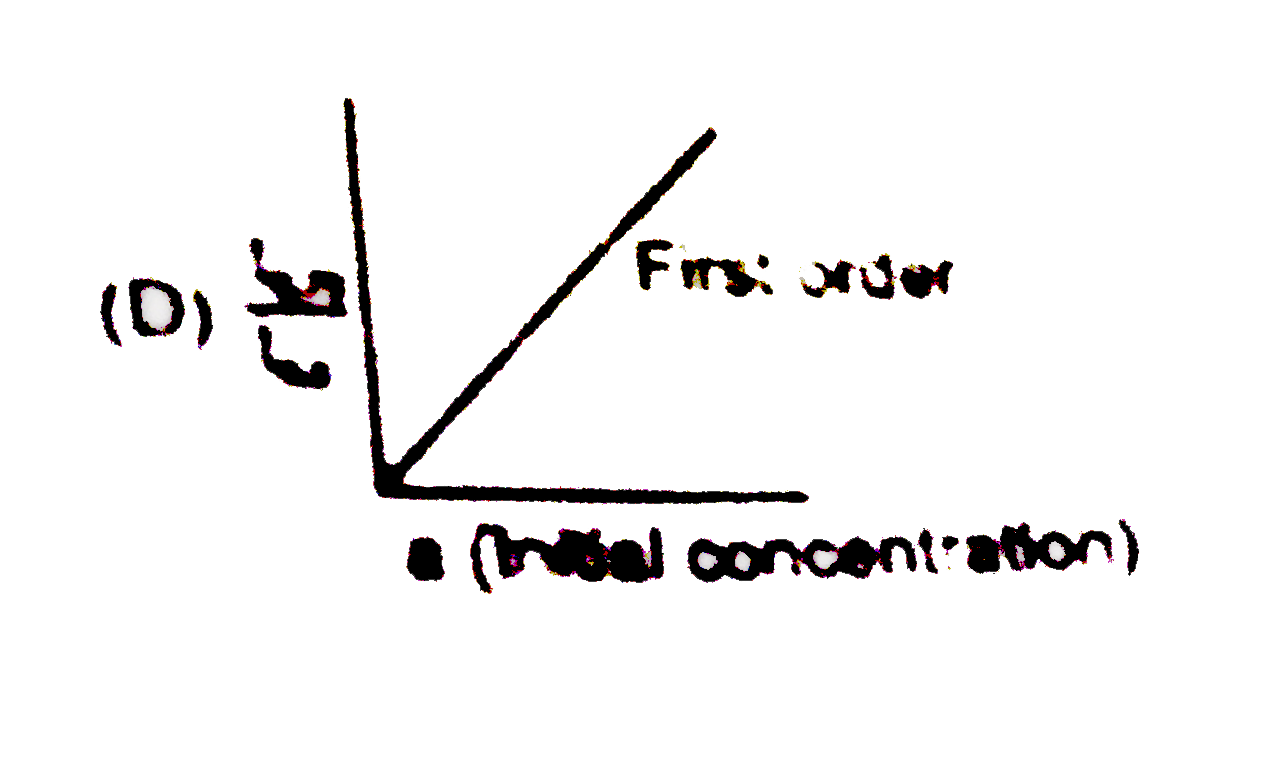
4. Analyzing the Ratio of Times for First-Order Reactions:
- For a first-order reaction, the relationship between time and concentration is given by:
t=1kln(C0C)
- If we consider the concentrations at different times, we can express:
t0.75=1kln(4)andt0.5=1kln(2)
- The ratio t0.75t0.5 simplifies to:
t0.75t0.5=ln(4)ln(2)=2
- This indicates that the ratio is constant and does not depend on the initial concentration, thus Option D is incorrect.
Hint: Remember that for first-order reactions, the time taken to reach a certain concentration is logarithmic and can be compared directly.
Conclusion:
The correct graphs are Option A, B, and C. Option D is incorrect as it does not reflect the expected behavior of first-order reactions.
- For a second-order reaction, the half-life (t1/2) is inversely proportional to the initial concentration (C0):
t1/2∝1C0
- This implies that if we plot t1/2 against C0, we will get a rectangular hyperbola. Therefore, Option A is correct.
- For a first-order reaction, the rate of change of concentration is given by:
−dCdt=kC
- Integrating this gives:
C=C0e−kt
- Taking the natural logarithm, we find:
ln(−dCdt)=ln(kC0)−kt
- This indicates a linear relationship where the slope is negative. Thus, Option B is also correct.
- For any reaction, we can express the rate constant k using the Arrhenius equation:
k=Ae−EaRT
- Substituting this into the expression for −dCdt leads to:
ln(−dCdt)=nln(C)+ln(A)−EaRT
- At constant concentration, the graph of ln(−dCdt) versus 1T will also be linear with a negative slope. Therefore, Option C is correct.
- For a first-order reaction, the relationship between time and concentration is given by:
t=1kln(C0C)
- If we consider the concentrations at different times, we can express:
t0.75=1kln(4)andt0.5=1kln(2)
- The ratio t0.75t0.5 simplifies to:
t0.75t0.5=ln(4)ln(2)=2
- This indicates that the ratio is constant and does not depend on the initial concentration, thus Option D is incorrect.
The correct graphs are Option A, B, and C. Option D is incorrect as it does not reflect the expected behavior of first-order reactions.
Topper's Solved these Questions
Similar Questions
Which is/are correct graph ?
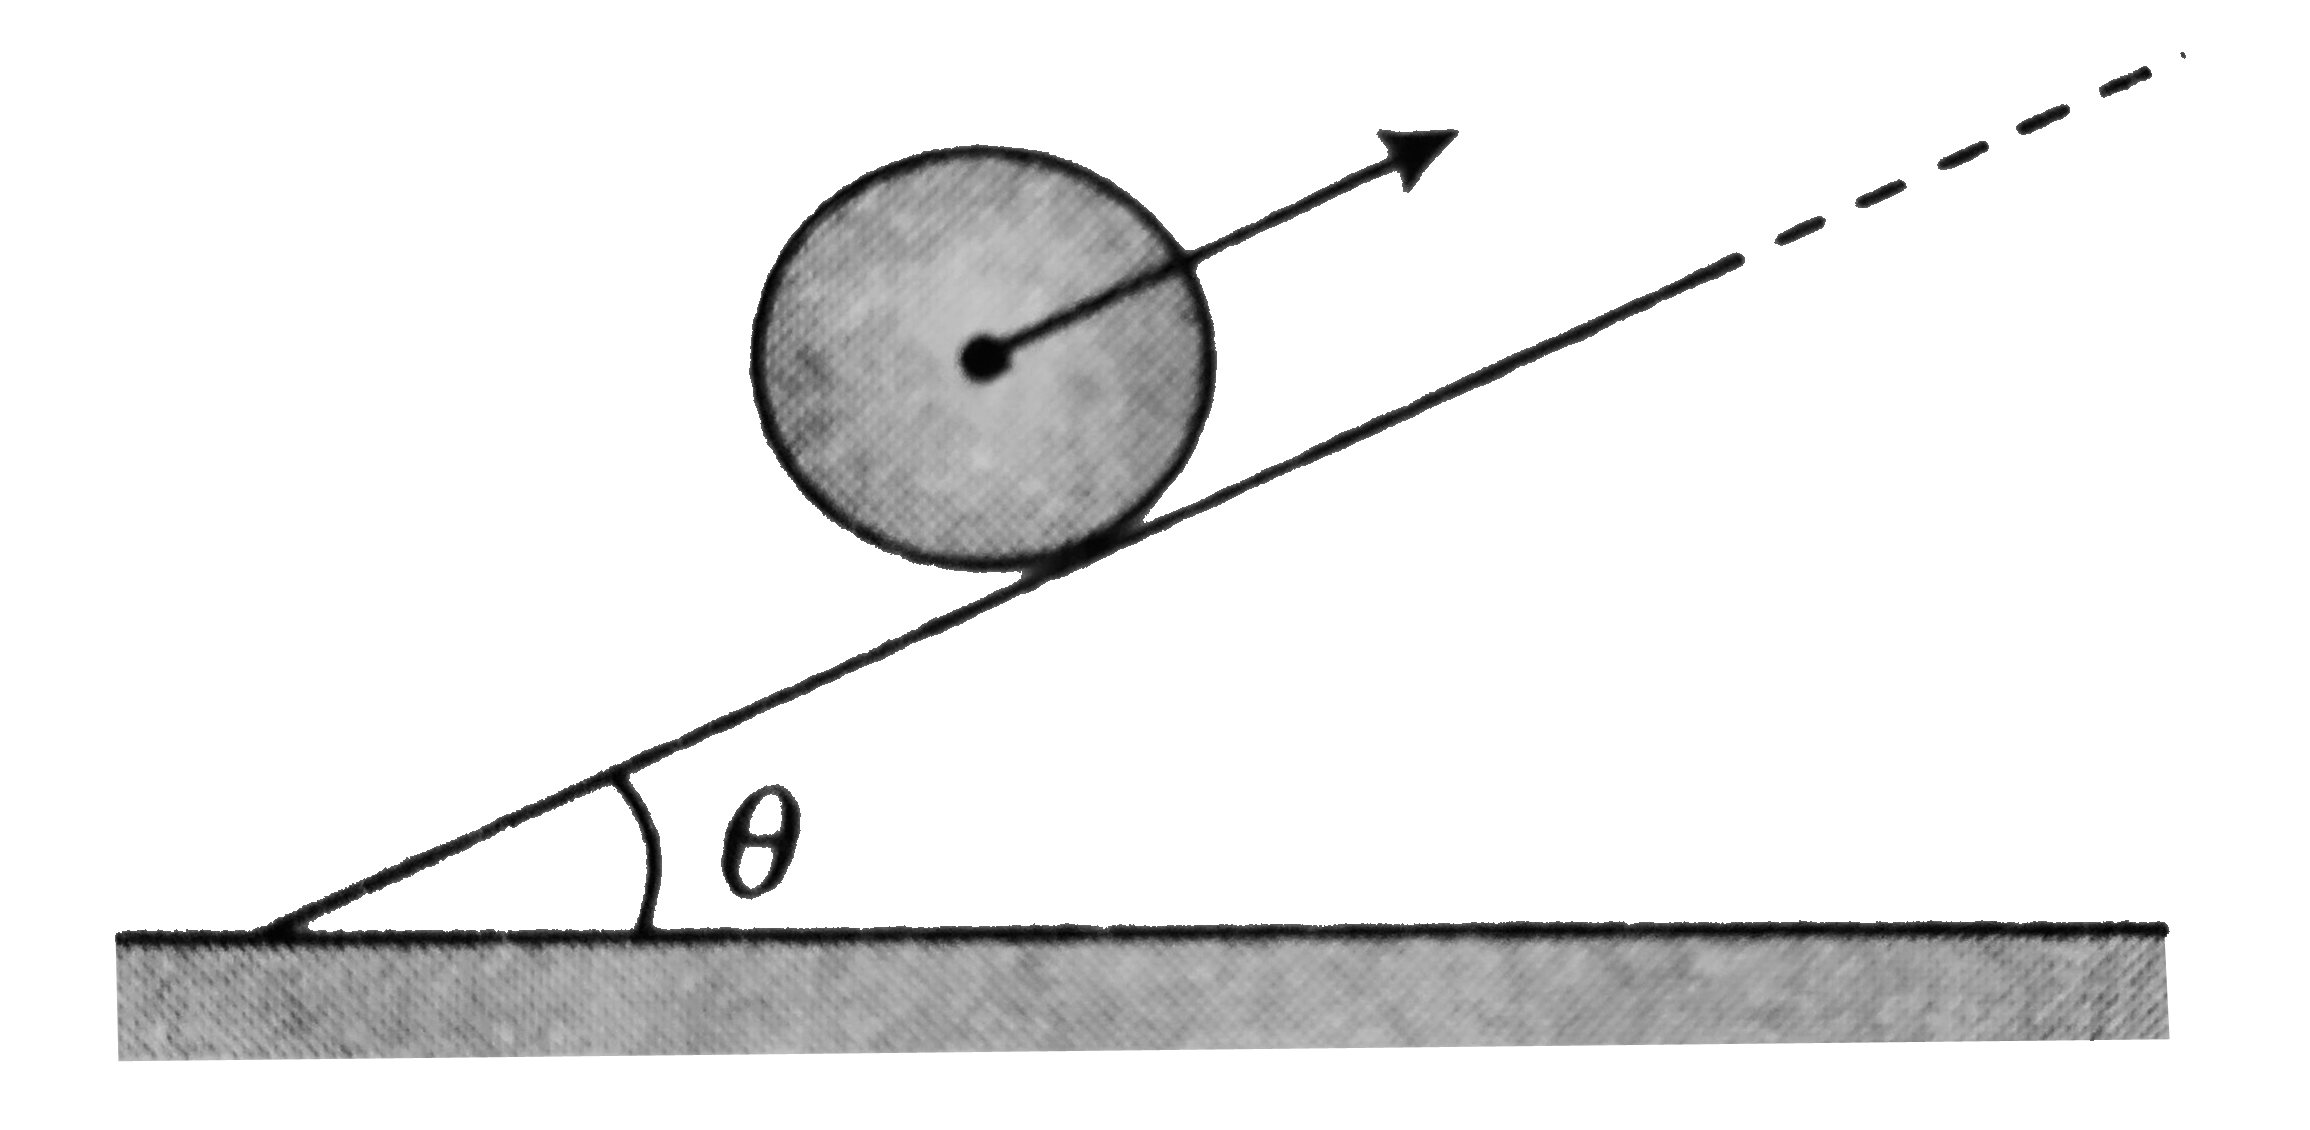
View SolutionA uniform solid sphere rolls up (witout slipping) the fixed inclined plane, and then back down. Which is the correct graph of acceleration a of centre of mass of solid sphere as function of time t (for the duration sphere is on the incline)? Assume that the sphere rolling up has a positive velocity.
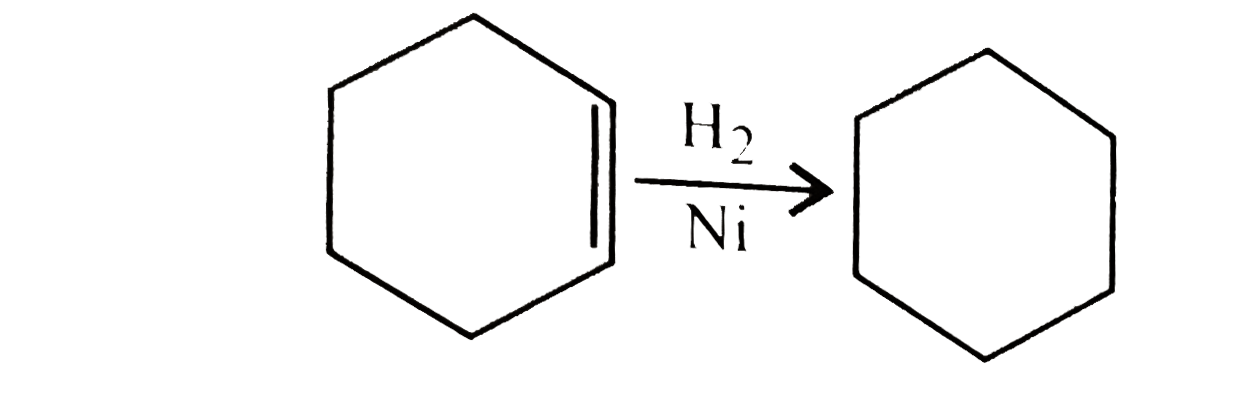
View SolutionWhich of the following is correct graph for the reaction?
View Solutionif current in solenoid is i1=αteβt. Which of the followign is correct graph between induced current rod time (α and β are positive)
View SolutionWhich one is the correct graph for arithmetic growth?
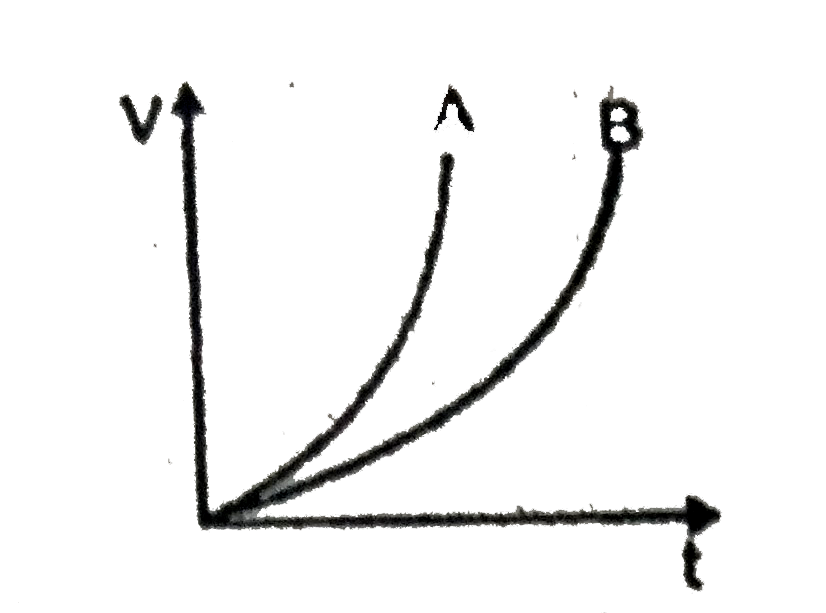
View SolutionA velocity-time graph of two vehicals A & B starting from rest at the same time is given in the figure. The statements which is correct from graph.
View SolutionWhich of the following is the correct graph for EN values of carbon family :
View SolutionFor an endothermic the correct graph is
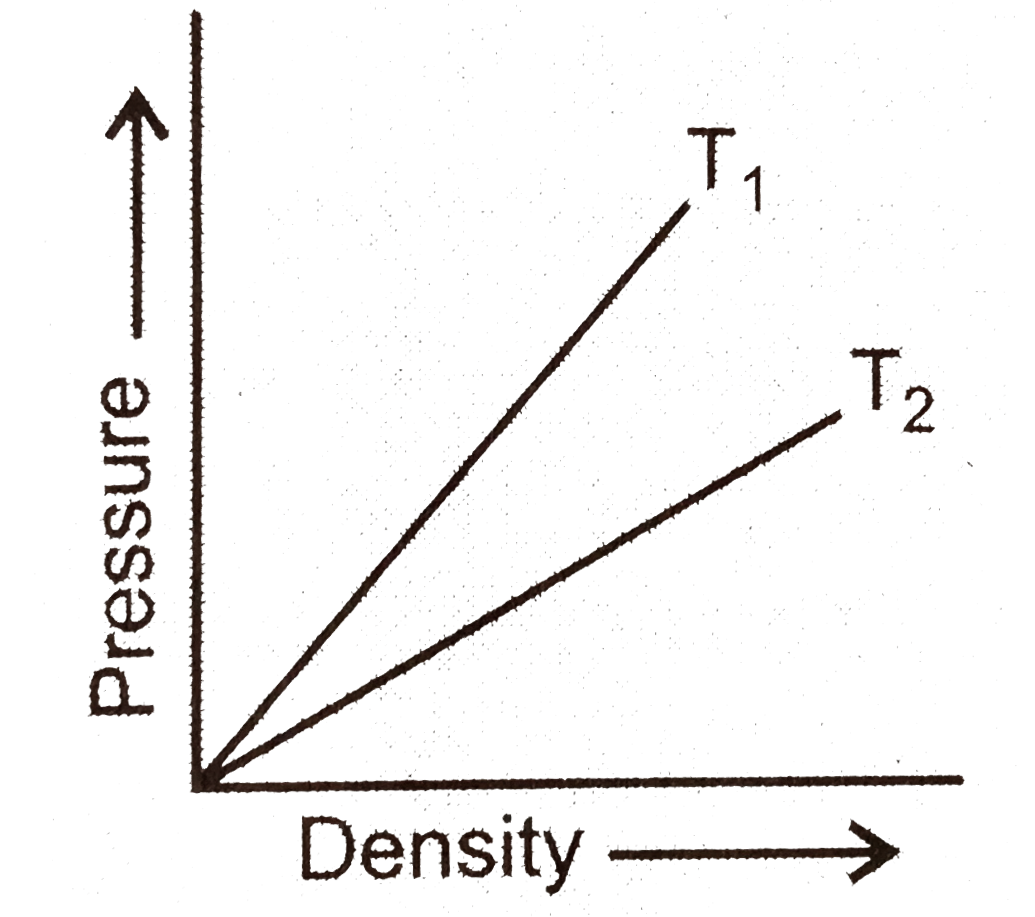
View SolutionFigure shows graphs of pressure versus density for an ideal gas at two temperatures T1 and T2 Which is correct ?
 .
.
View SolutionCompressibility factor (Z=PVnRT) is plotted against pressure
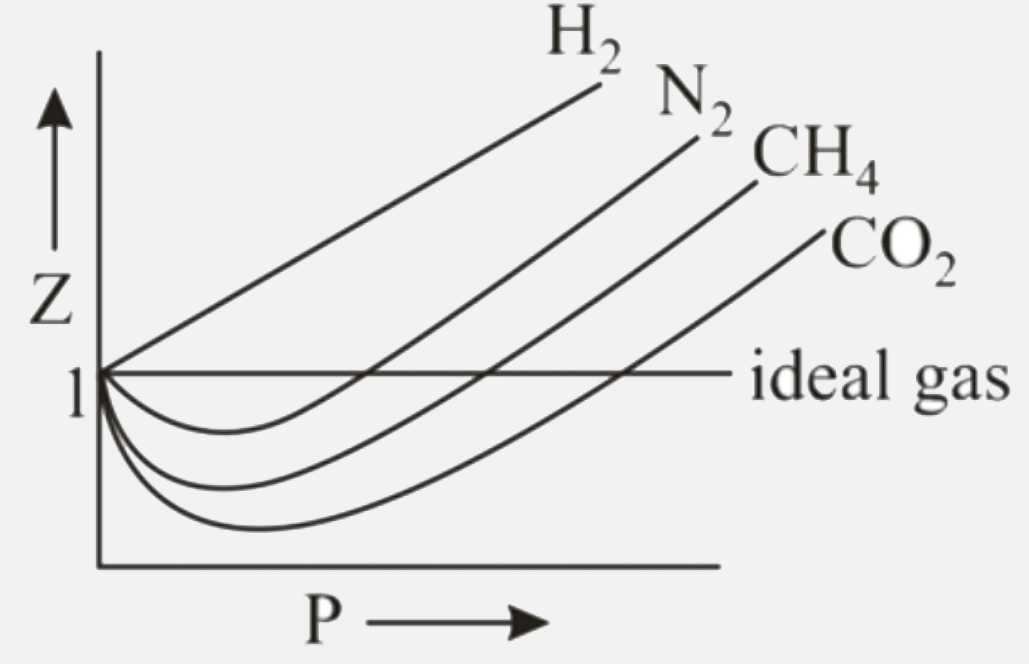
Which is the correct order of liquefiability of the gases shown in the above graph ?
View Solution