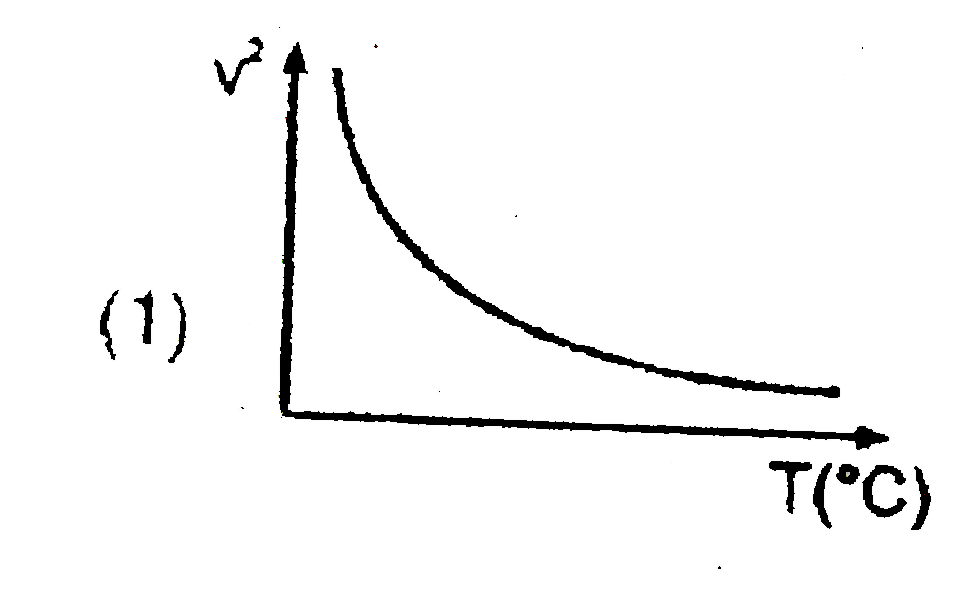
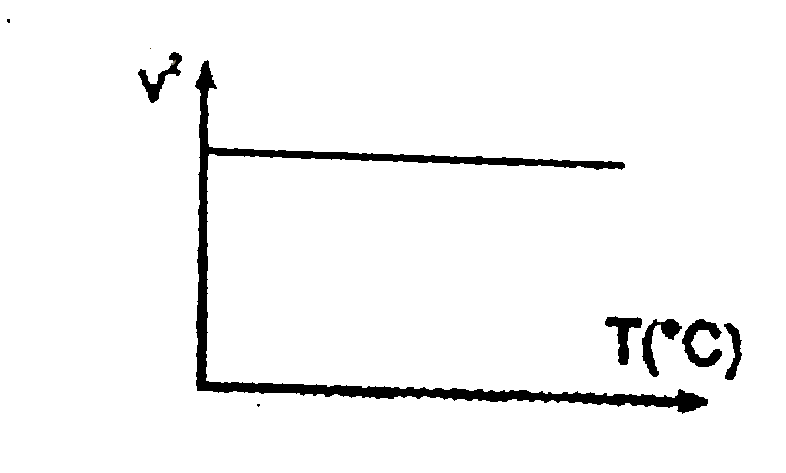
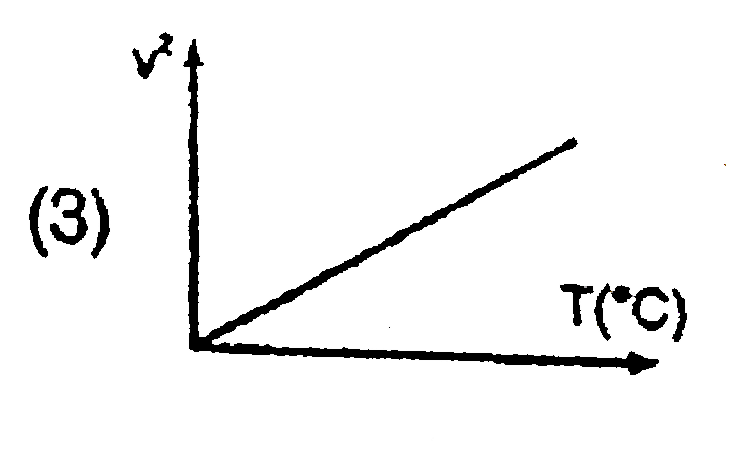
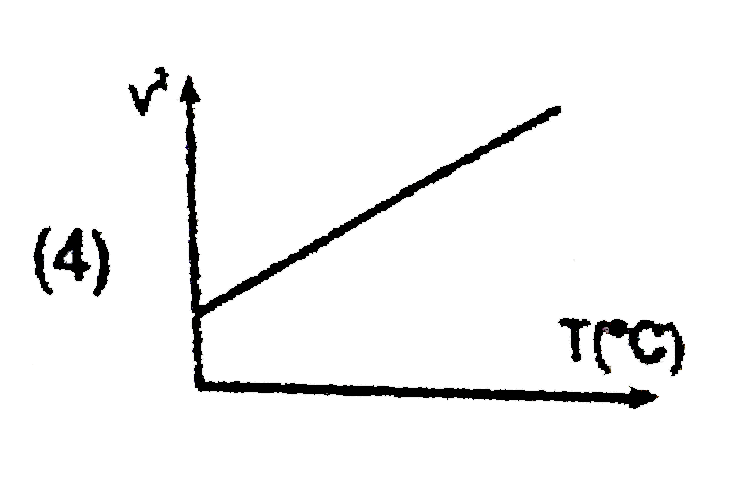
The graph between the (velocity2) and temperature T of a gas is
The correct Answer is:D
To find the relationship between the square of the velocity (V²) of a gas and its temperature (T), we can follow these steps:
1. Understand the RMS Velocity Formula:
The root mean square (RMS) velocity of gas molecules is given by the formula:
Vrms=√3RTm
where R is the universal gas constant, T is the temperature, and m is the molecular weight of the gas.
Hint: Recall the definition of RMS velocity and the variables involved.
2. Square the RMS Velocity:
To find the relationship between V² and T, we square the RMS velocity:
V2=(√3RTm)2=3RTm
Hint: Remember that squaring a square root cancels the square root.
3. Identify the Proportionality:
From the equation V2=3RmT, we can see that V² is directly proportional to T. The term 3Rm is a constant.
Hint: Look for the relationship in the form of y=kx where k is a constant.
4. Graphical Representation:
Since V² is proportional to T, if we plot V² on the y-axis and T on the x-axis, the graph will be a straight line. This line will pass through the origin (0,0) because when T = 0, V² also equals 0.
Hint: Consider the characteristics of linear graphs and what it means for a line to pass through the origin.
5. Conclusion:
Therefore, the graph between the square of the velocity (V²) and temperature (T) of a gas is a straight line passing through the origin.
Hint: Summarize the findings to confirm the type of graph you expect.
Final Answer:
The graph between the velocity squared (V²) and temperature (T) of a gas is a straight line passing through the origin.
The root mean square (RMS) velocity of gas molecules is given by the formula:
Vrms=√3RTm
where R is the universal gas constant, T is the temperature, and m is the molecular weight of the gas.
To find the relationship between V² and T, we square the RMS velocity:
V2=(√3RTm)2=3RTm
From the equation V2=3RmT, we can see that V² is directly proportional to T. The term 3Rm is a constant.
Since V² is proportional to T, if we plot V² on the y-axis and T on the x-axis, the graph will be a straight line. This line will pass through the origin (0,0) because when T = 0, V² also equals 0.
Therefore, the graph between the square of the velocity (V²) and temperature (T) of a gas is a straight line passing through the origin.
The graph between the velocity squared (V²) and temperature (T) of a gas is a straight line passing through the origin.
Topper's Solved these Questions
- SOUND WAVESBOOK - RESONANCE ENGLISHCHAPTER - SOUND WAVESEXERCISE - Solved Examples
24 Videos
- SOUND WAVESBOOK - RESONANCE ENGLISHCHAPTER - SOUND WAVESEXERCISE - Board Level Exercise
33 Videos
- SIMPLE HARMONIC MOTIONBOOK - RESONANCE ENGLISHCHAPTER - SIMPLE HARMONIC MOTIONEXERCISE - Exercise
28 Videos
- STRING WAVESBOOK - RESONANCE ENGLISHCHAPTER - STRING WAVESEXERCISE - Exercise
32 Videos
Similar Questions
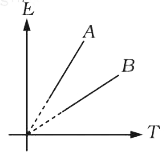
There are two samples A and B, which contains two different gases. Each sample has one mole of a gas. Graph between internal energy (E) and temperature (T) as shown in figure, then:
View SolutionIf, for a given substance, TB is the melting point and TA is the freezing point, then the correct variation of entropy by the graph between entropy change (ΔS) and temperature is:
View SolutionThe graph between log t1/2 and log a at a given temperature is
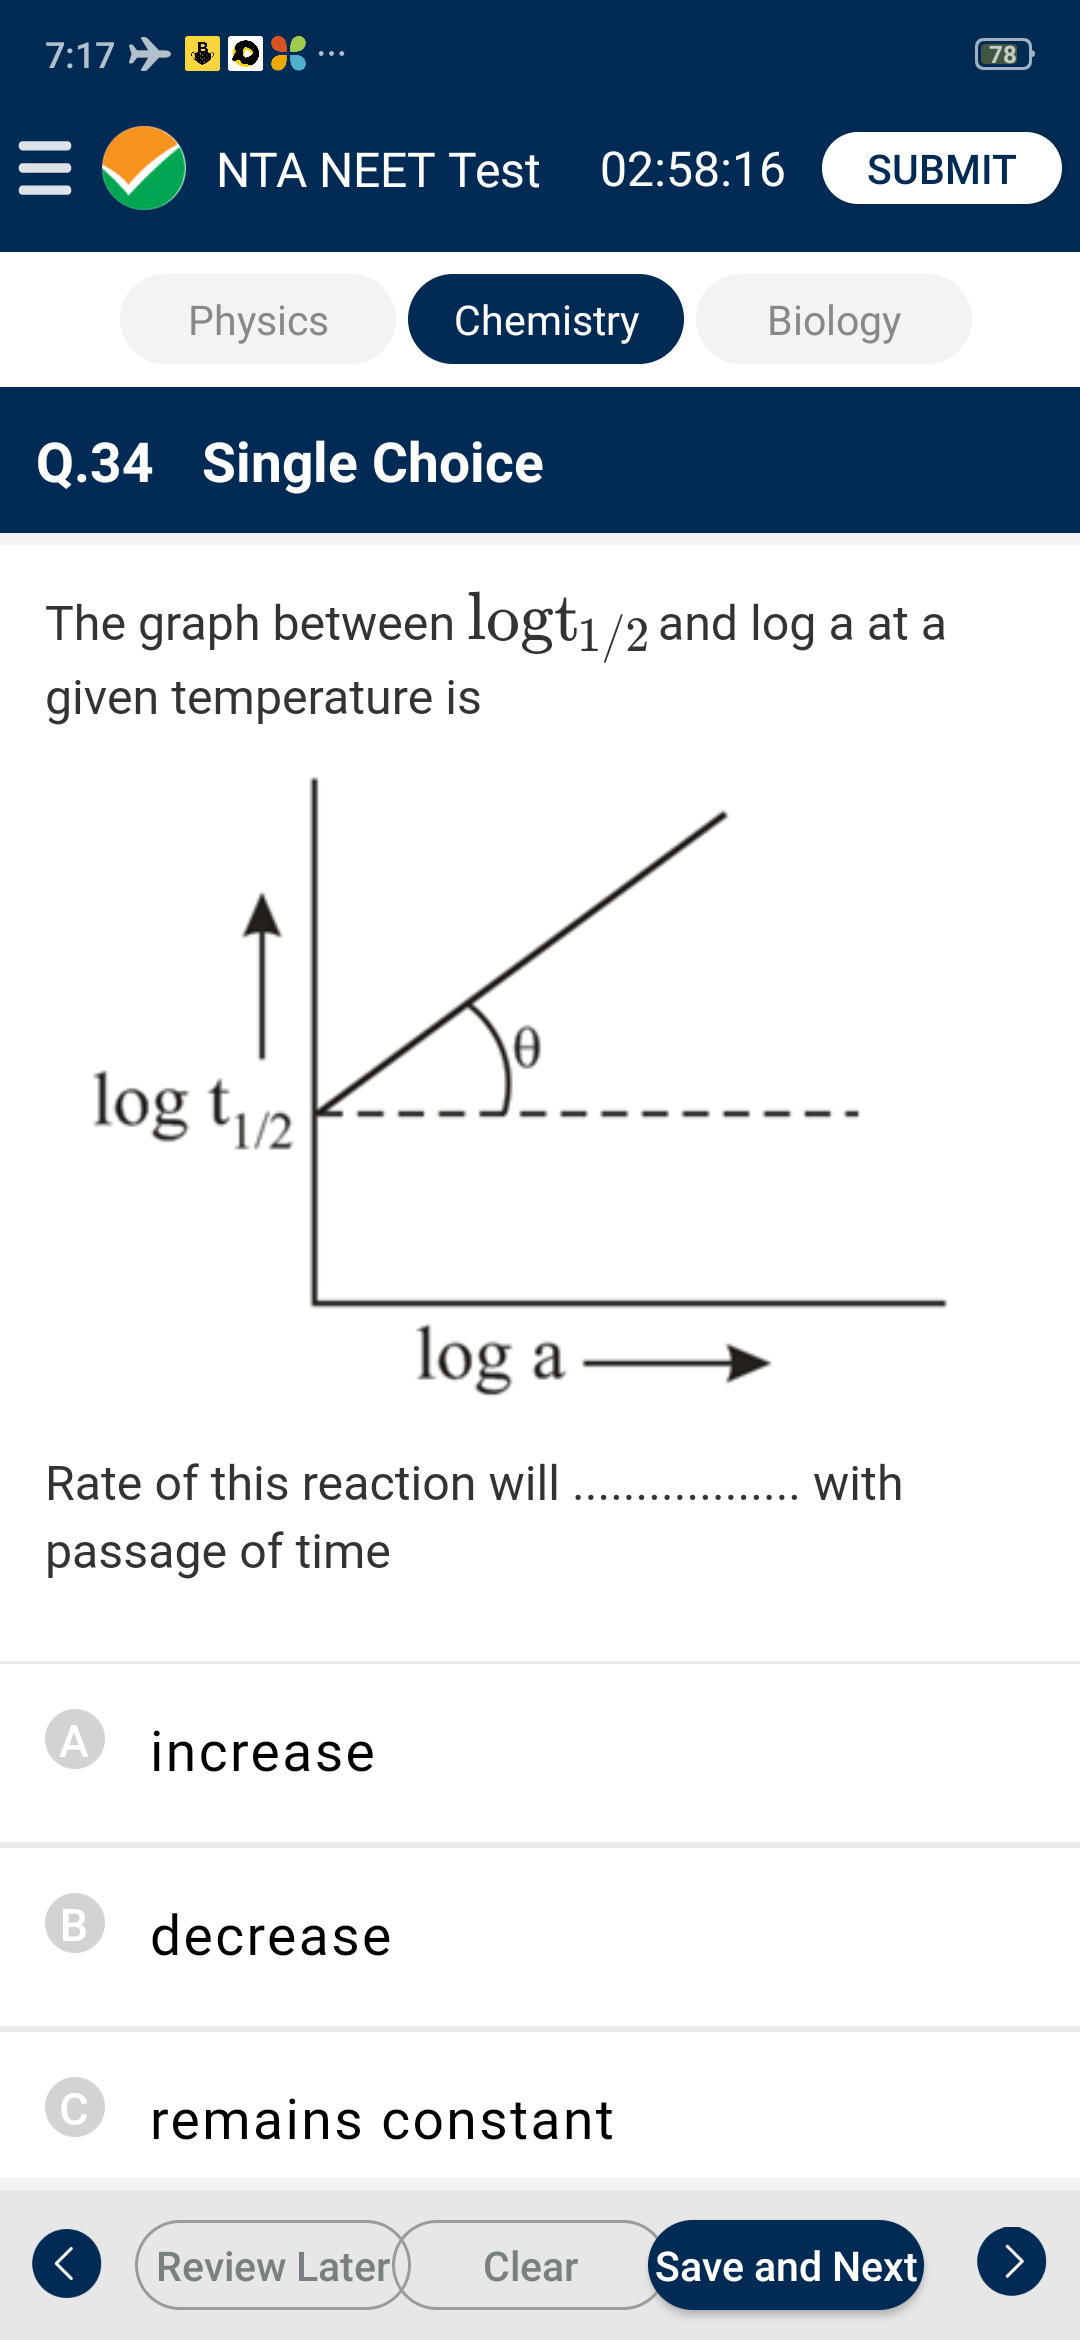
Rate of this reaction will …….with passage of time
View SolutionThe slope of the graph between log P and log V at constant temperature for a given mass of gas is
View SolutionIf a piece of metal is heated to temperature θ and the allowed to cool in a room which is at temperature θ0, the graph between the temperature T of the metal and time t will be closet to
View SolutionThe graph between velocity and position for a damped oscillation will be-
View SolutionFigure shows a parabolic graph between T and 1V (T = temperature, V = Volume) for a gas undergoing an adiabatic process. If the ratio of rms velocity of molecules and speed of sound in the gas at the same temperature is √n, then find the value of n.

View SolutionWhat is the type of graph between log P and log(1V) at constant temperature for a given amount of gas ?
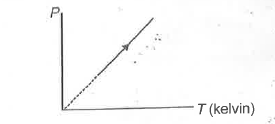
View SolutionThe graph of pressure and temperature for an ideal gas is as shown in figure. The given process is
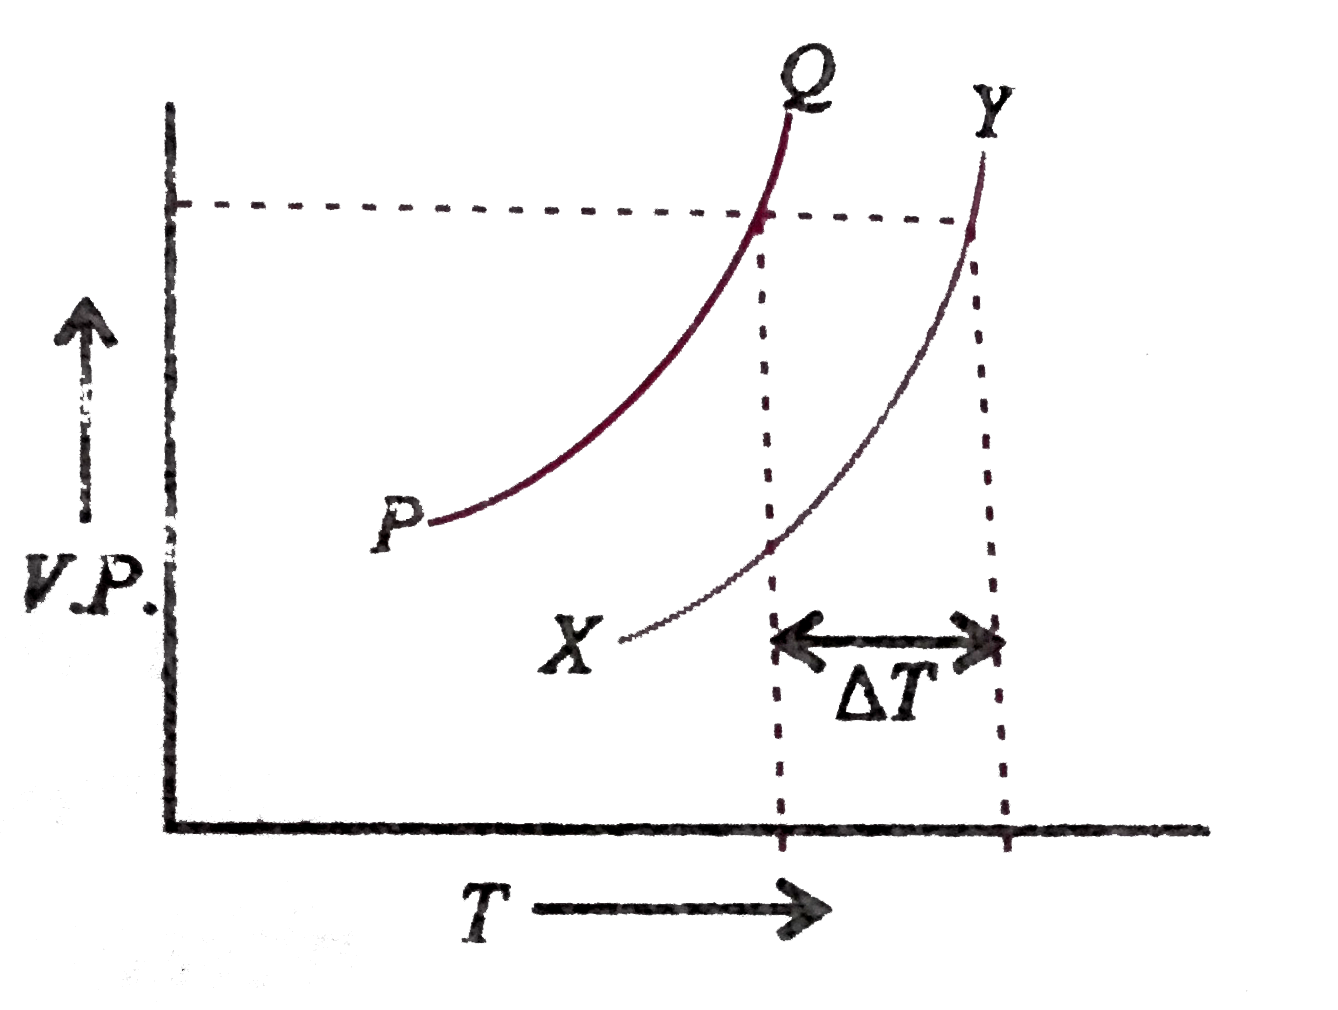
View SolutionIn the graph plotted between vapour pressure (V.P.) and temperature (T),
View Solution
