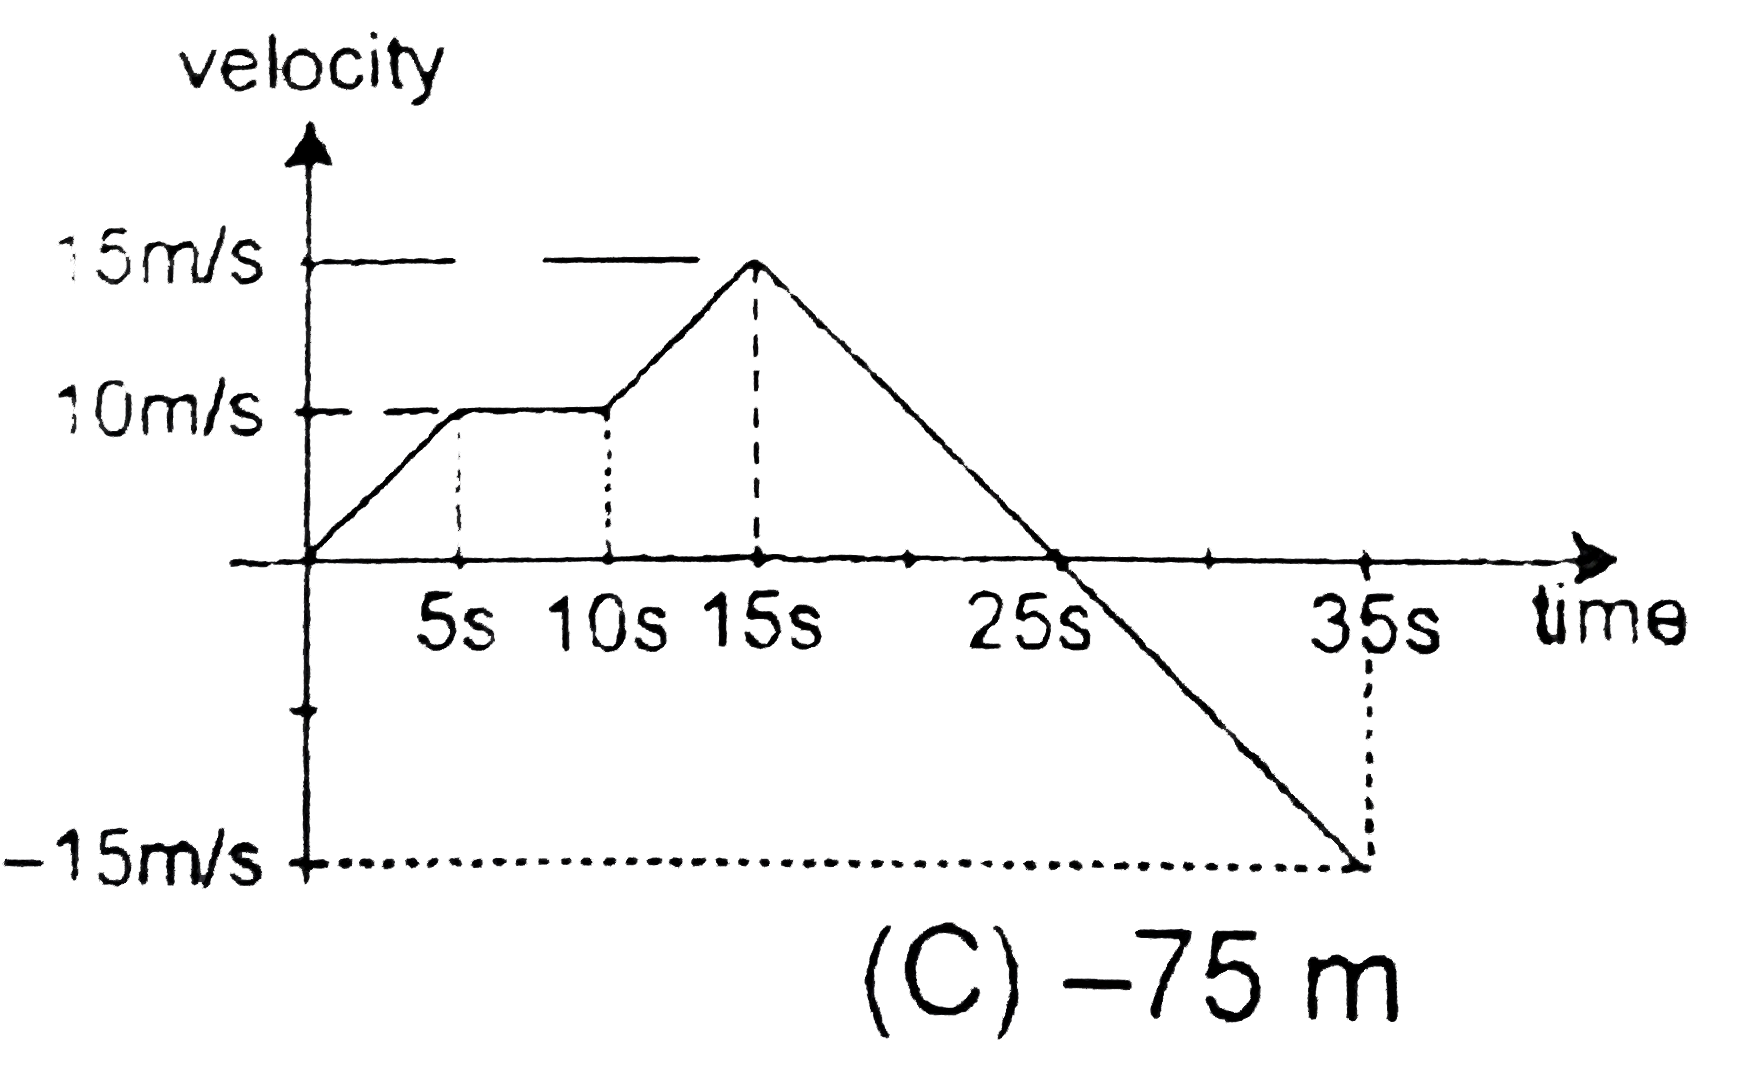
A person starts from origin and for his linear motion velocity is given as shown in figure. Fond displacement of the person from t=15sec to t=35sec.
 .
.
75 m
0
−75m
150 m
The correct Answer is:B
Area under velocity time graph gives displacement.
S=t2∫t1vdt=35∫15vdt
=12×(25−15)×15−12(35−25)×15
S=75−75=0.
Topper's Solved these Questions
- DAILY PRACTICE PROBLEMBOOK - RESONANCE ENGLISHCHAPTER - DAILY PRACTICE PROBLEMEXERCISE - DPP No.4
9 Videos
- DAILY PRACTICE PROBLEMBOOK - RESONANCE ENGLISHCHAPTER - DAILY PRACTICE PROBLEMEXERCISE - DPP No.5
20 Videos
- DAILY PRACTICE PROBLEMBOOK - RESONANCE ENGLISHCHAPTER - DAILY PRACTICE PROBLEMEXERCISE - DPP No.2
10 Videos
- CURRENT ELECTRICITYBOOK - RESONANCE ENGLISHCHAPTER - CURRENT ELECTRICITYEXERCISE - High Level Problems (HIP)
19 Videos
- ELECTRO MAGNETIC WAVESBOOK - RESONANCE ENGLISHCHAPTER - ELECTRO MAGNETIC WAVESEXERCISE - Exercise 3
27 Videos
Similar Questions
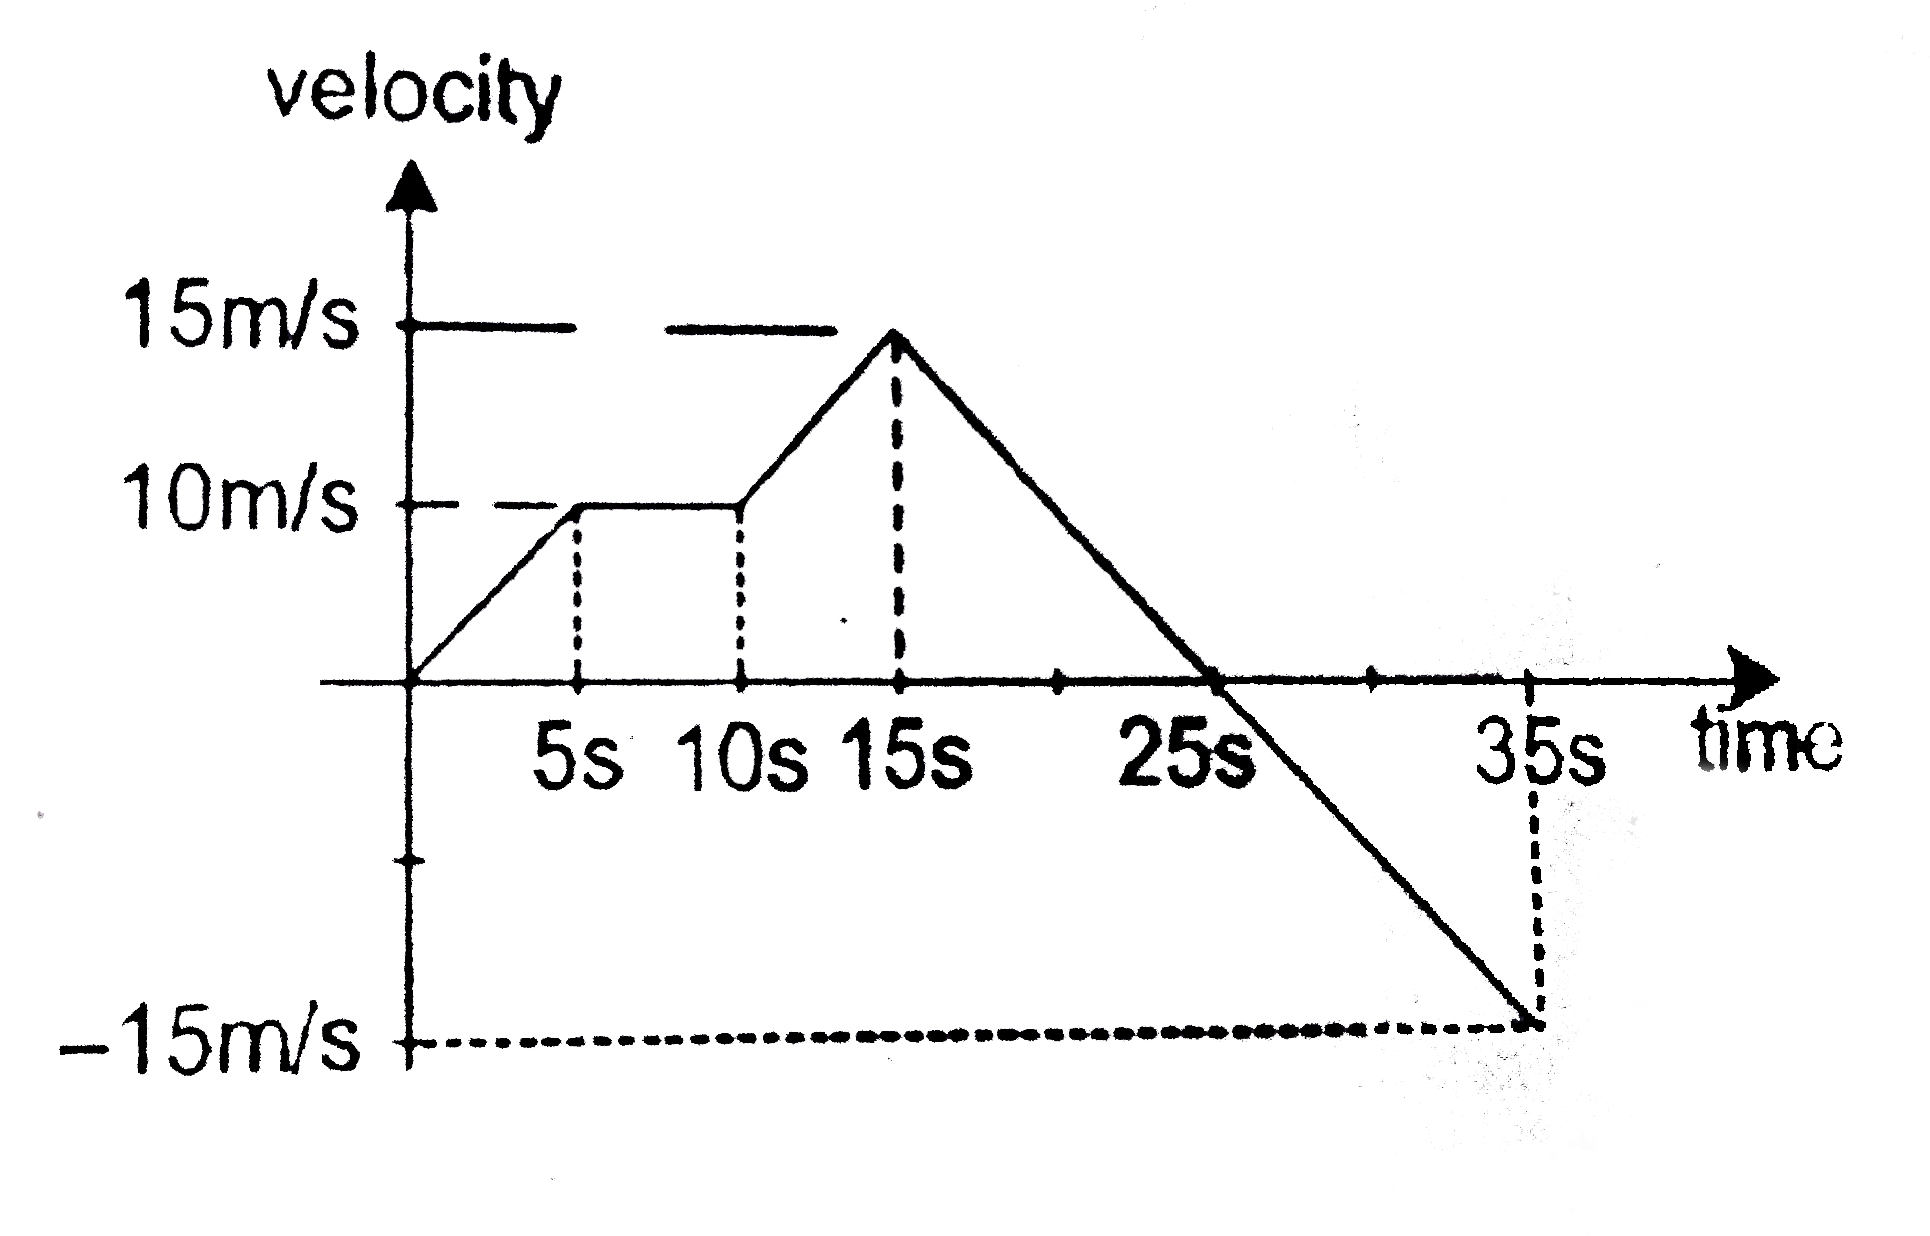
A person starts from origin and for his linear motion velocity is given as shown in figure. Draw displacement and acceleration graph with respect to time. Also find maximum displacement of the person.
View SolutionAssertion : A body is moving along a straight line such the its velocity varies with a time as shown in figure. Magnmitude of displacement of the body from t = 0 to t = 12 s is the same as the distance travelled by it in the given time duration.
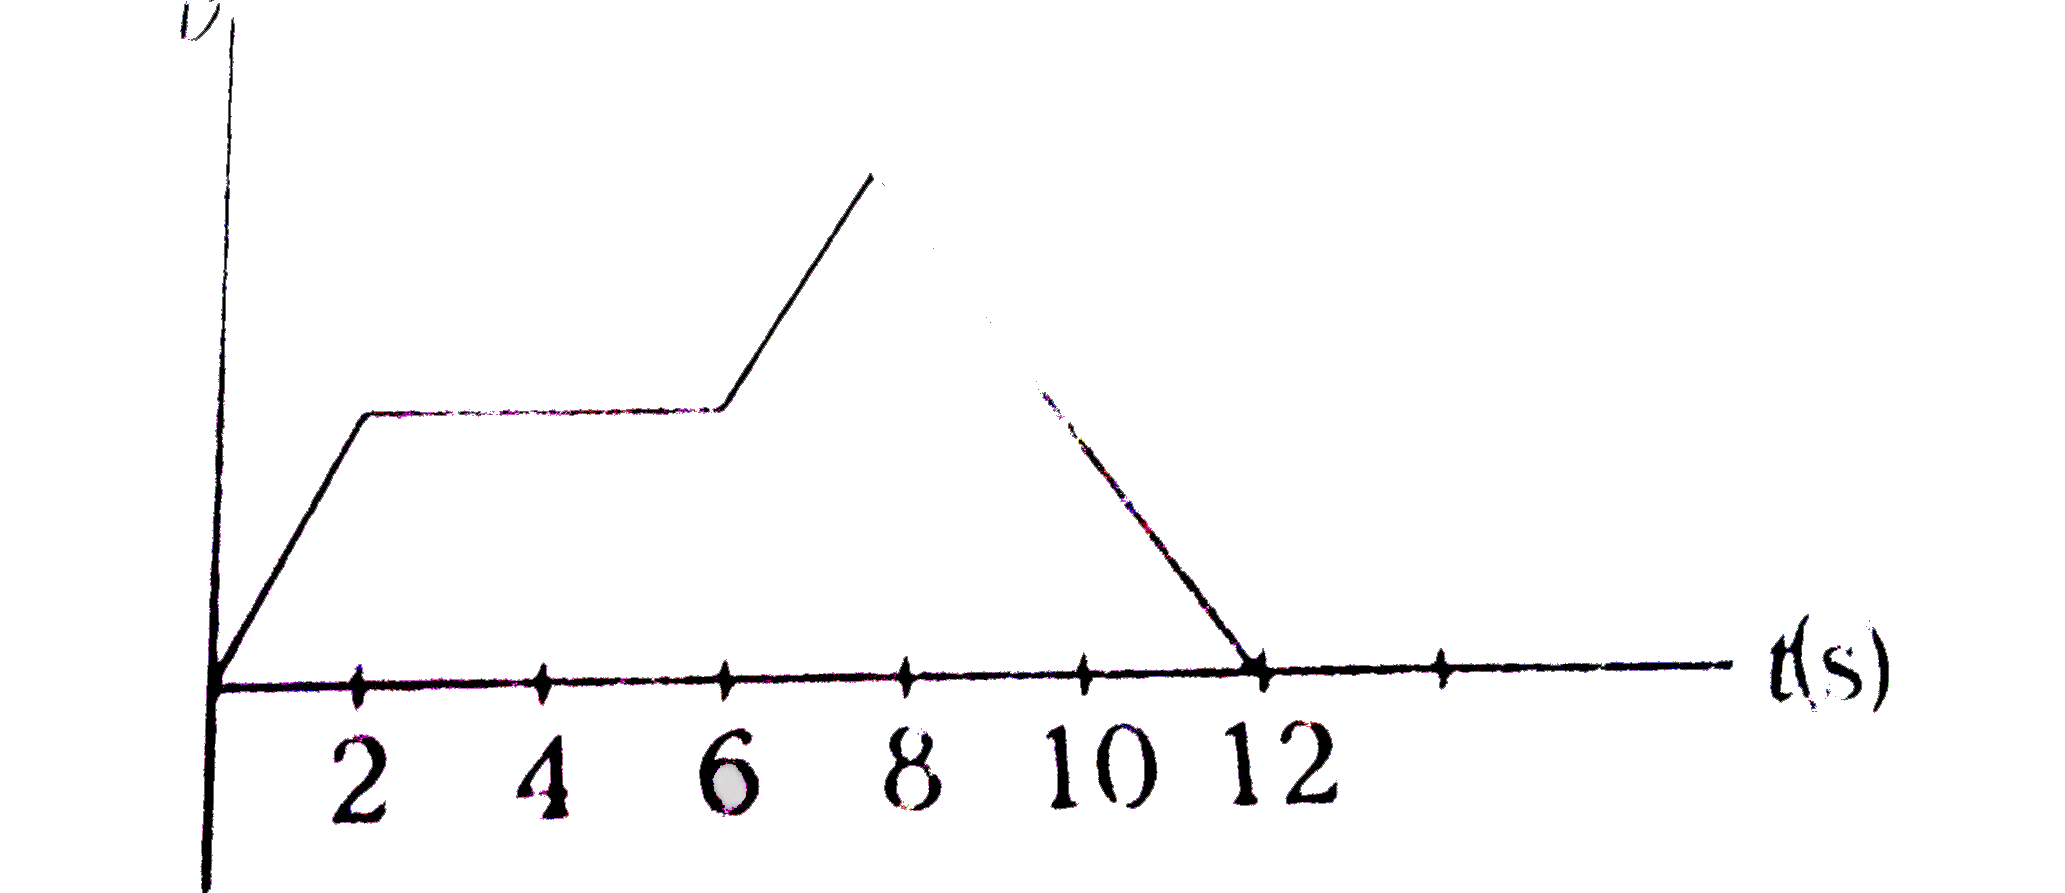
Reason : For unidirectional motion of a body,
|displacement|=distance
View Solution
Knowledge Check
The velocity-time graph of a linear motion is shown below . The displacement from the origin after 8 seconds is
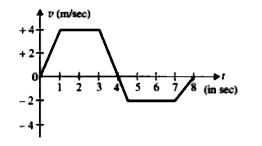 A18 mB6 mC8 mD16 m
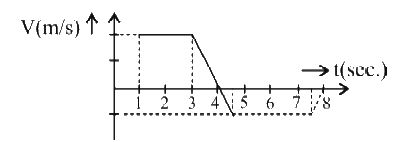
The velocity-time graph of a linear motion is shown in figure. The displacement from the origin after 8 sec is :
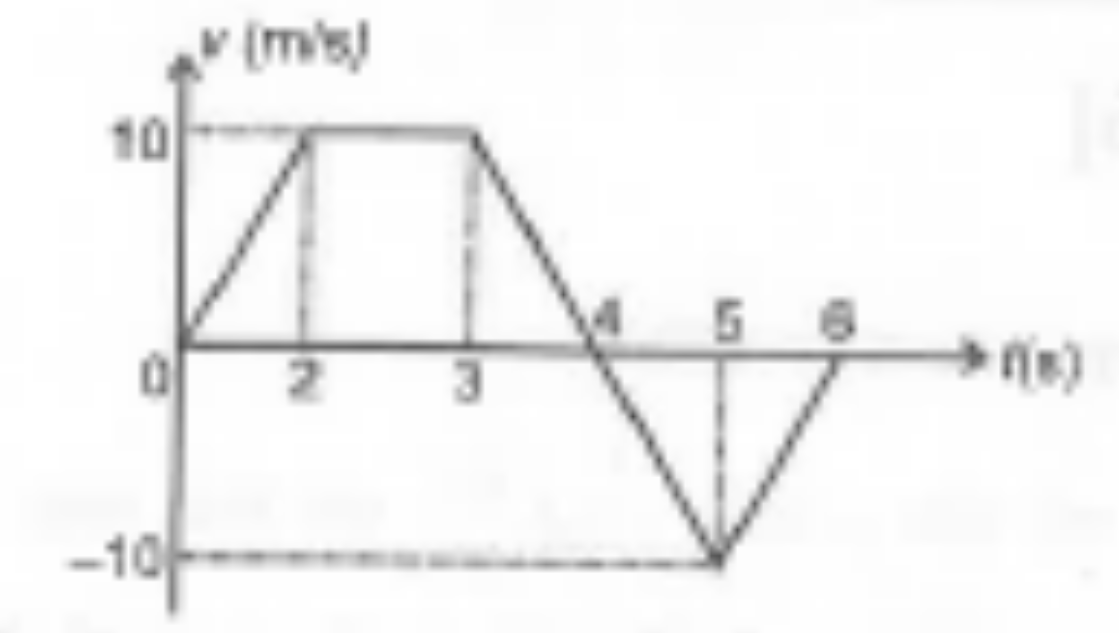
View SolutionThe velocity (v)-time (t) graph of a partide moving along a straight line is as shown in the figure. The displacement of the particle from t = 0 to t = 4 is
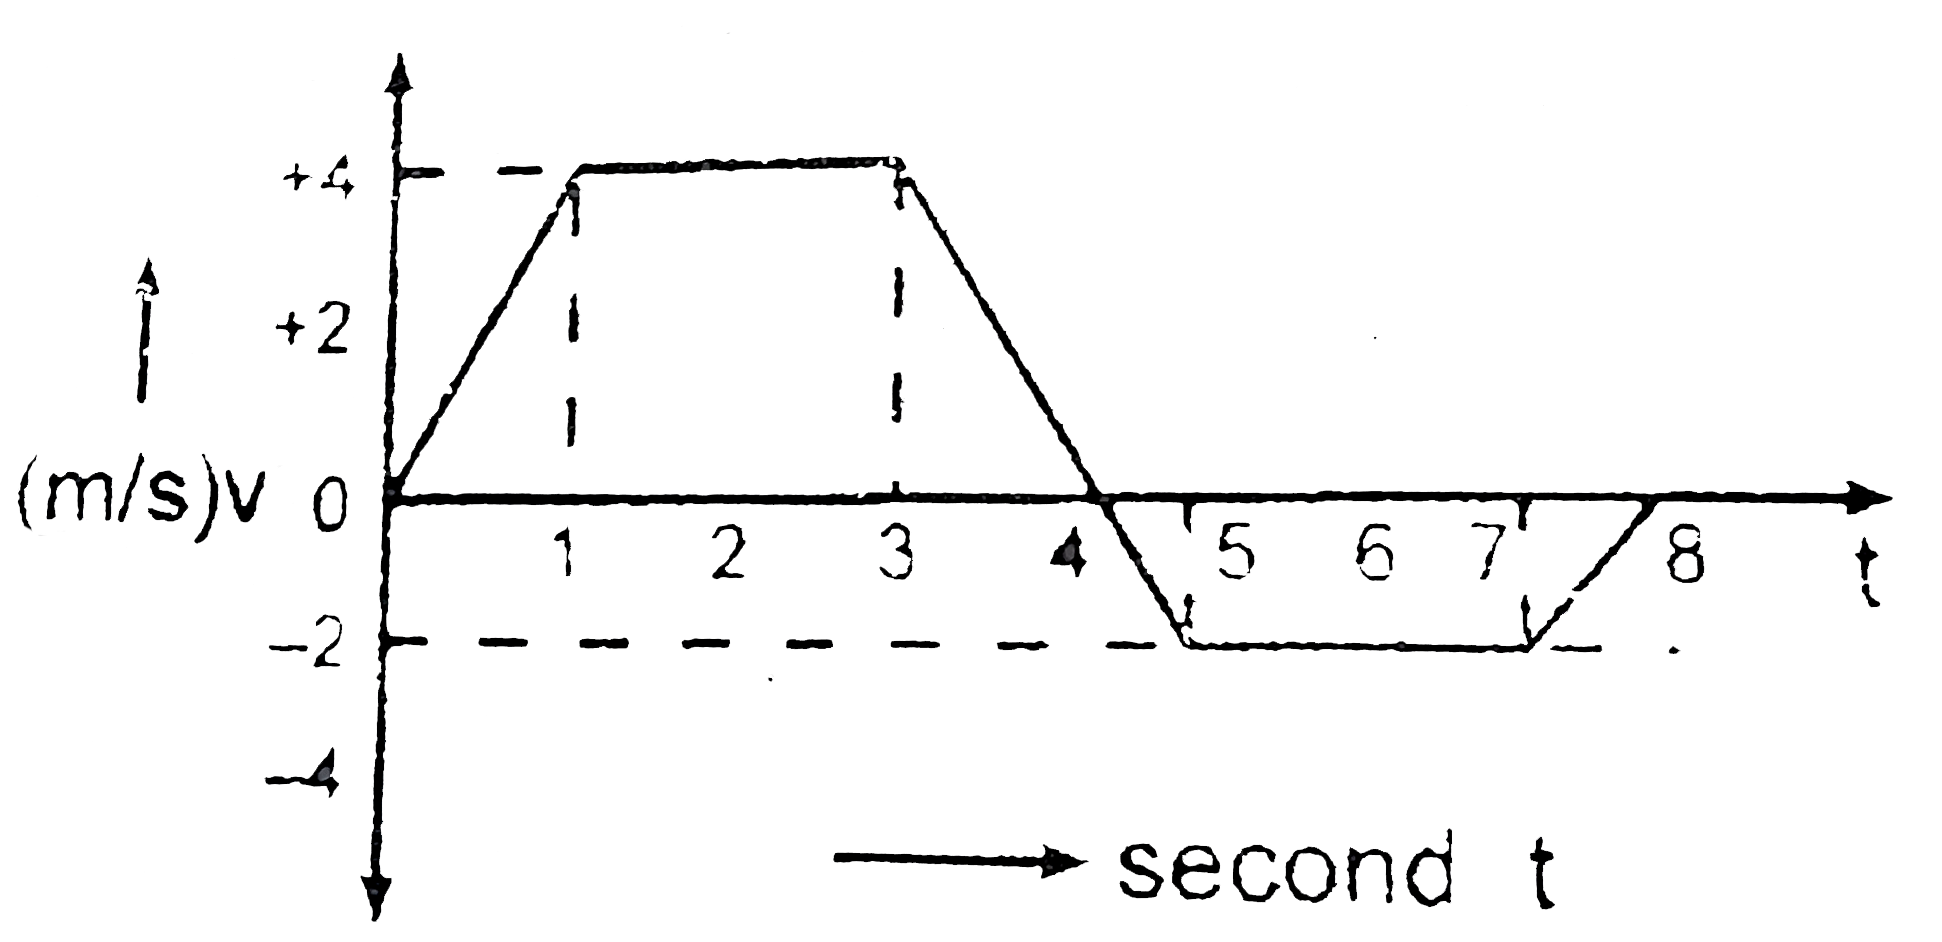
View SolutionThe velocity time graph of a linear motion is shown in the figure. The distance from the starting point after 8 seconds will be
 .
.
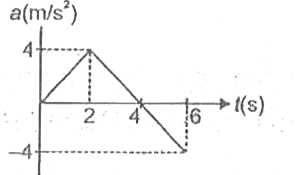
View SolutionFor the acceleration - time (a - t) graph shown in figure, the change in velocity of particle from t = 0 to t = 6 s is
View SolutionA particle starting from rest. Its acceleration (a) versus time (t) is as shown in the figure.
The maximum speed of the particle will be.
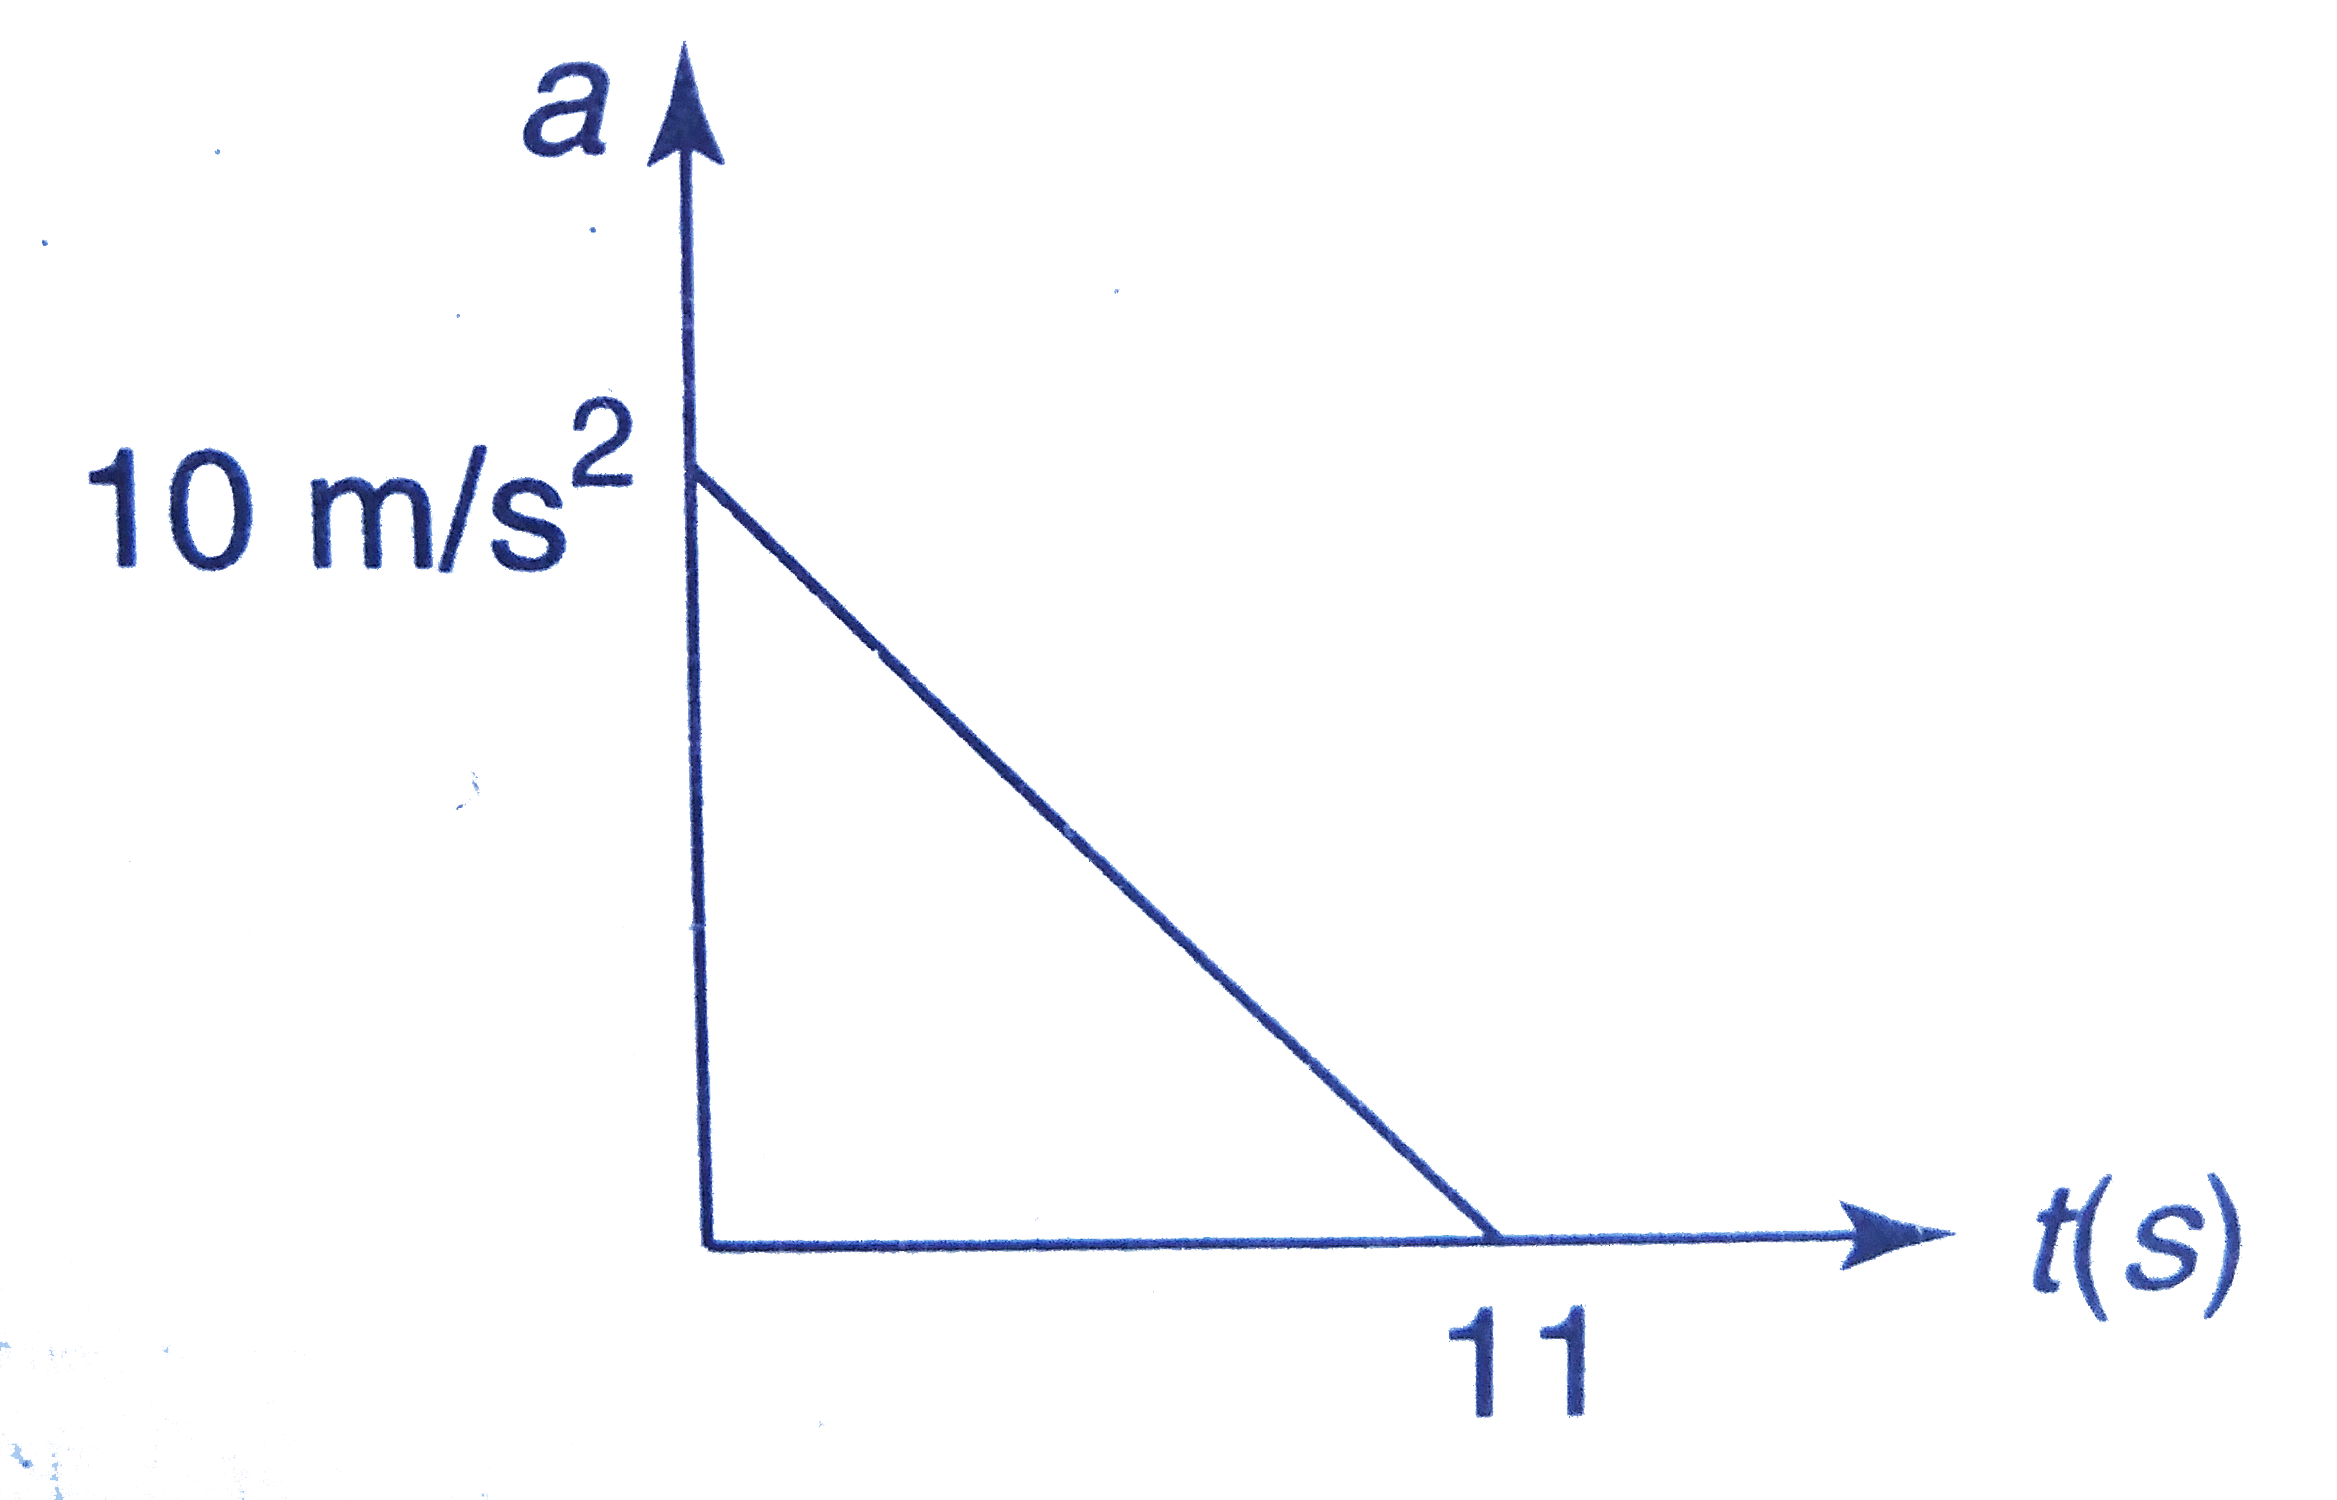
View SolutionA particle starting from rest. Its acceleration (a) versus time (t) is as shown in the figure.
The maximum speed of the particle will be.

View SolutionA particle starts from the origin at time t = 0 and moves along the positive x-axis. The graph of velocity with respect to time is shown in figure. What is the position of the particle at time t = 5s ?

View Solution
