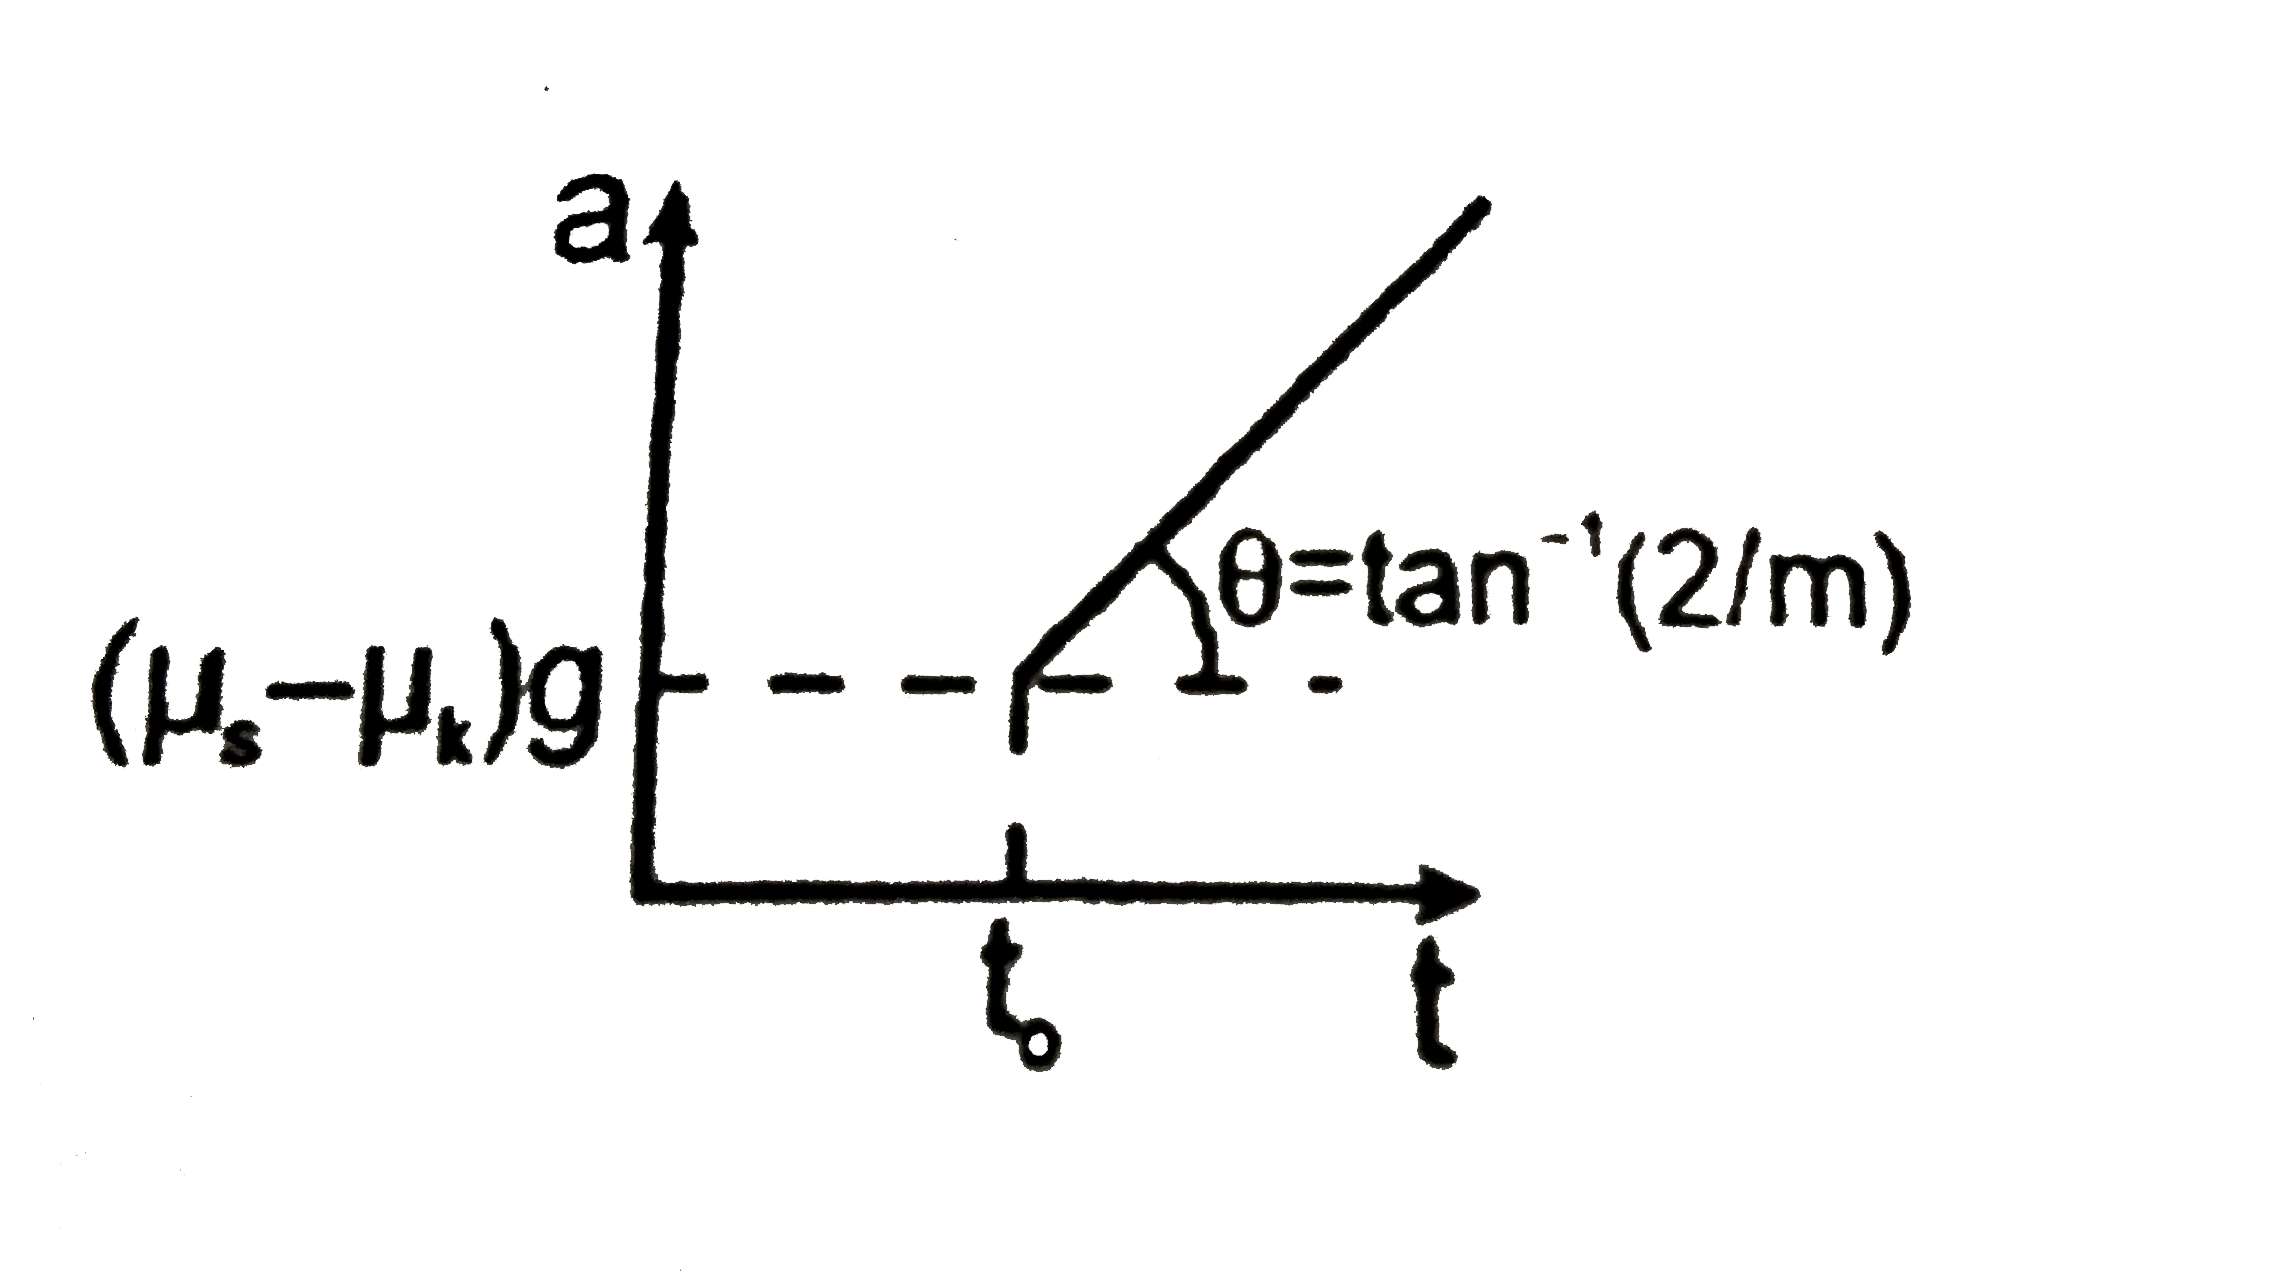
A force F = 2t (where t is time in seconds) is applied at t = 0 sec to the block of mass m placed on rough horizontal surface. The coefficient of static and kinetic friction between the block and surface μs and μk respectively. Which of the following graphs best represents the acceleration vs time of the block (μs>μK)

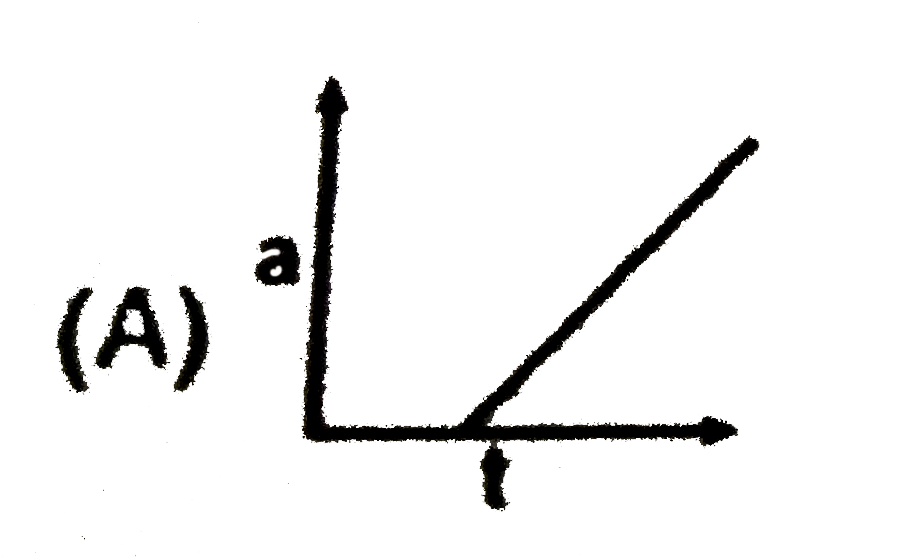
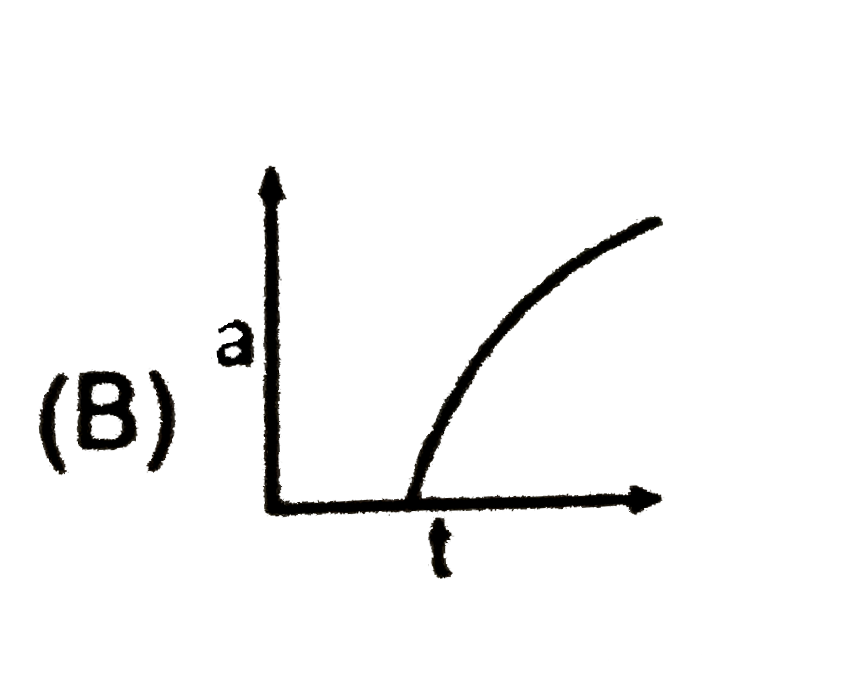
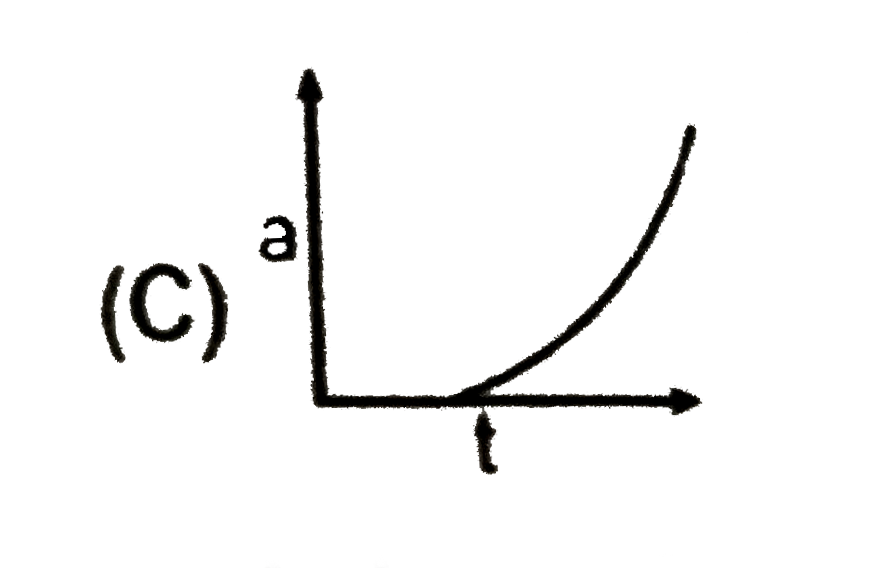
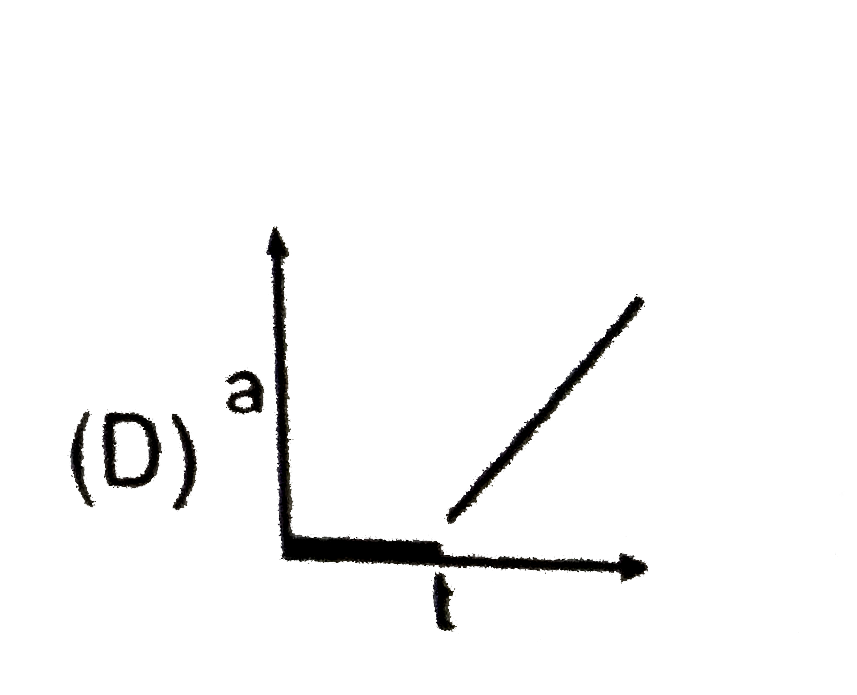
The correct Answer is:D
Let t0 be the time when friction force is maximum
F=2t0=μgmg
The block just starts moving immediately after this instant, with acceleration
=μsmg−μkmgm=(μs−μk)g
For t>t0 the acceleration of the block is
a=2t0−μkmgm
Topper's Solved these Questions
- DAILY PRACTICE PROBLEMSBOOK - RESONANCE ENGLISHCHAPTER - DAILY PRACTICE PROBLEMSEXERCISE - dpp 31
7 Videos
- DAILY PRACTICE PROBLEMSBOOK - RESONANCE ENGLISHCHAPTER - DAILY PRACTICE PROBLEMSEXERCISE - dpp 32
8 Videos
- DAILY PRACTICE PROBLEMSBOOK - RESONANCE ENGLISHCHAPTER - DAILY PRACTICE PROBLEMSEXERCISE - dpp29
5 Videos
- CURRENT ELECTRICITYBOOK - RESONANCE ENGLISHCHAPTER - CURRENT ELECTRICITYEXERCISE - Exercise
53 Videos
- ELASTICITY AND VISCOCITYBOOK - RESONANCE ENGLISHCHAPTER - ELASTICITY AND VISCOCITYEXERCISE - Advanced Level Problems
9 Videos
Similar Questions

A force F=2t is spplied at t=0 sec to the block of mass m placed on a rough horizontal surface. The coefficient of static and kinetic friction between the block and surface are μS and μk respectively. Which of the following graphs best represents the acceleration vs time of the block(μS>μk)?
View Solution
A force F=2t is spplied at t=0 sec to the block of mass m placed on a rough horizontal surface. The coefficient of static and kinetic friction between the block and surface are μS and μk rspectively. Which of the following graphs best represents the acceleration vs time of the block(μS>μk)?
View Solution
Knowledge Check
A block of mass 1 kg lies on a horizontal surface in a truck. The coefficient of static friction between the block and the surface is 0.6. If the acceleration of the truck is 5m/s2, the frictional force acting on the block is…………newtons.
A10NB5NC2.5ND20N
A block of mass m is moving on a rough horizontal surface. μ is the coefficient of kinetic friction between the block and the surface. What is the net force exerted by the surface on the block?
View SolutionCoefficient of kinetic friction and coefficient of static friction between two blocks is μk and μs respectively. In general
View SolutionA block of mass m is pulled by a force of constant power P placed on a rough horizontal plane. The friction coefficient between the block and the surface is μ. Then
View SolutionA block of mass 1 kg lies on a horizontal surface in a truck. The coefficient of static friction between the block and the surface is 0.6. If the acceleration of the truck is 5m/s2, the frictional force acting on the block is…………newtons.
View SolutionA block of mass M is kept on as rough horizontal surface. The coefficient of static frictionbetween the block and the surface is μ. The block is to be pulled by applying a force to it. What minimum force is needed to slide the block? In which direction should this force act?
View SolutionA block of mass M is kept on as rough horizontal surface. The coefficient of static friction between the block and the surface is μ. The block is to be pulled by applying a force to it. What minimum force is needed to slide the block? In which direction should this force act?
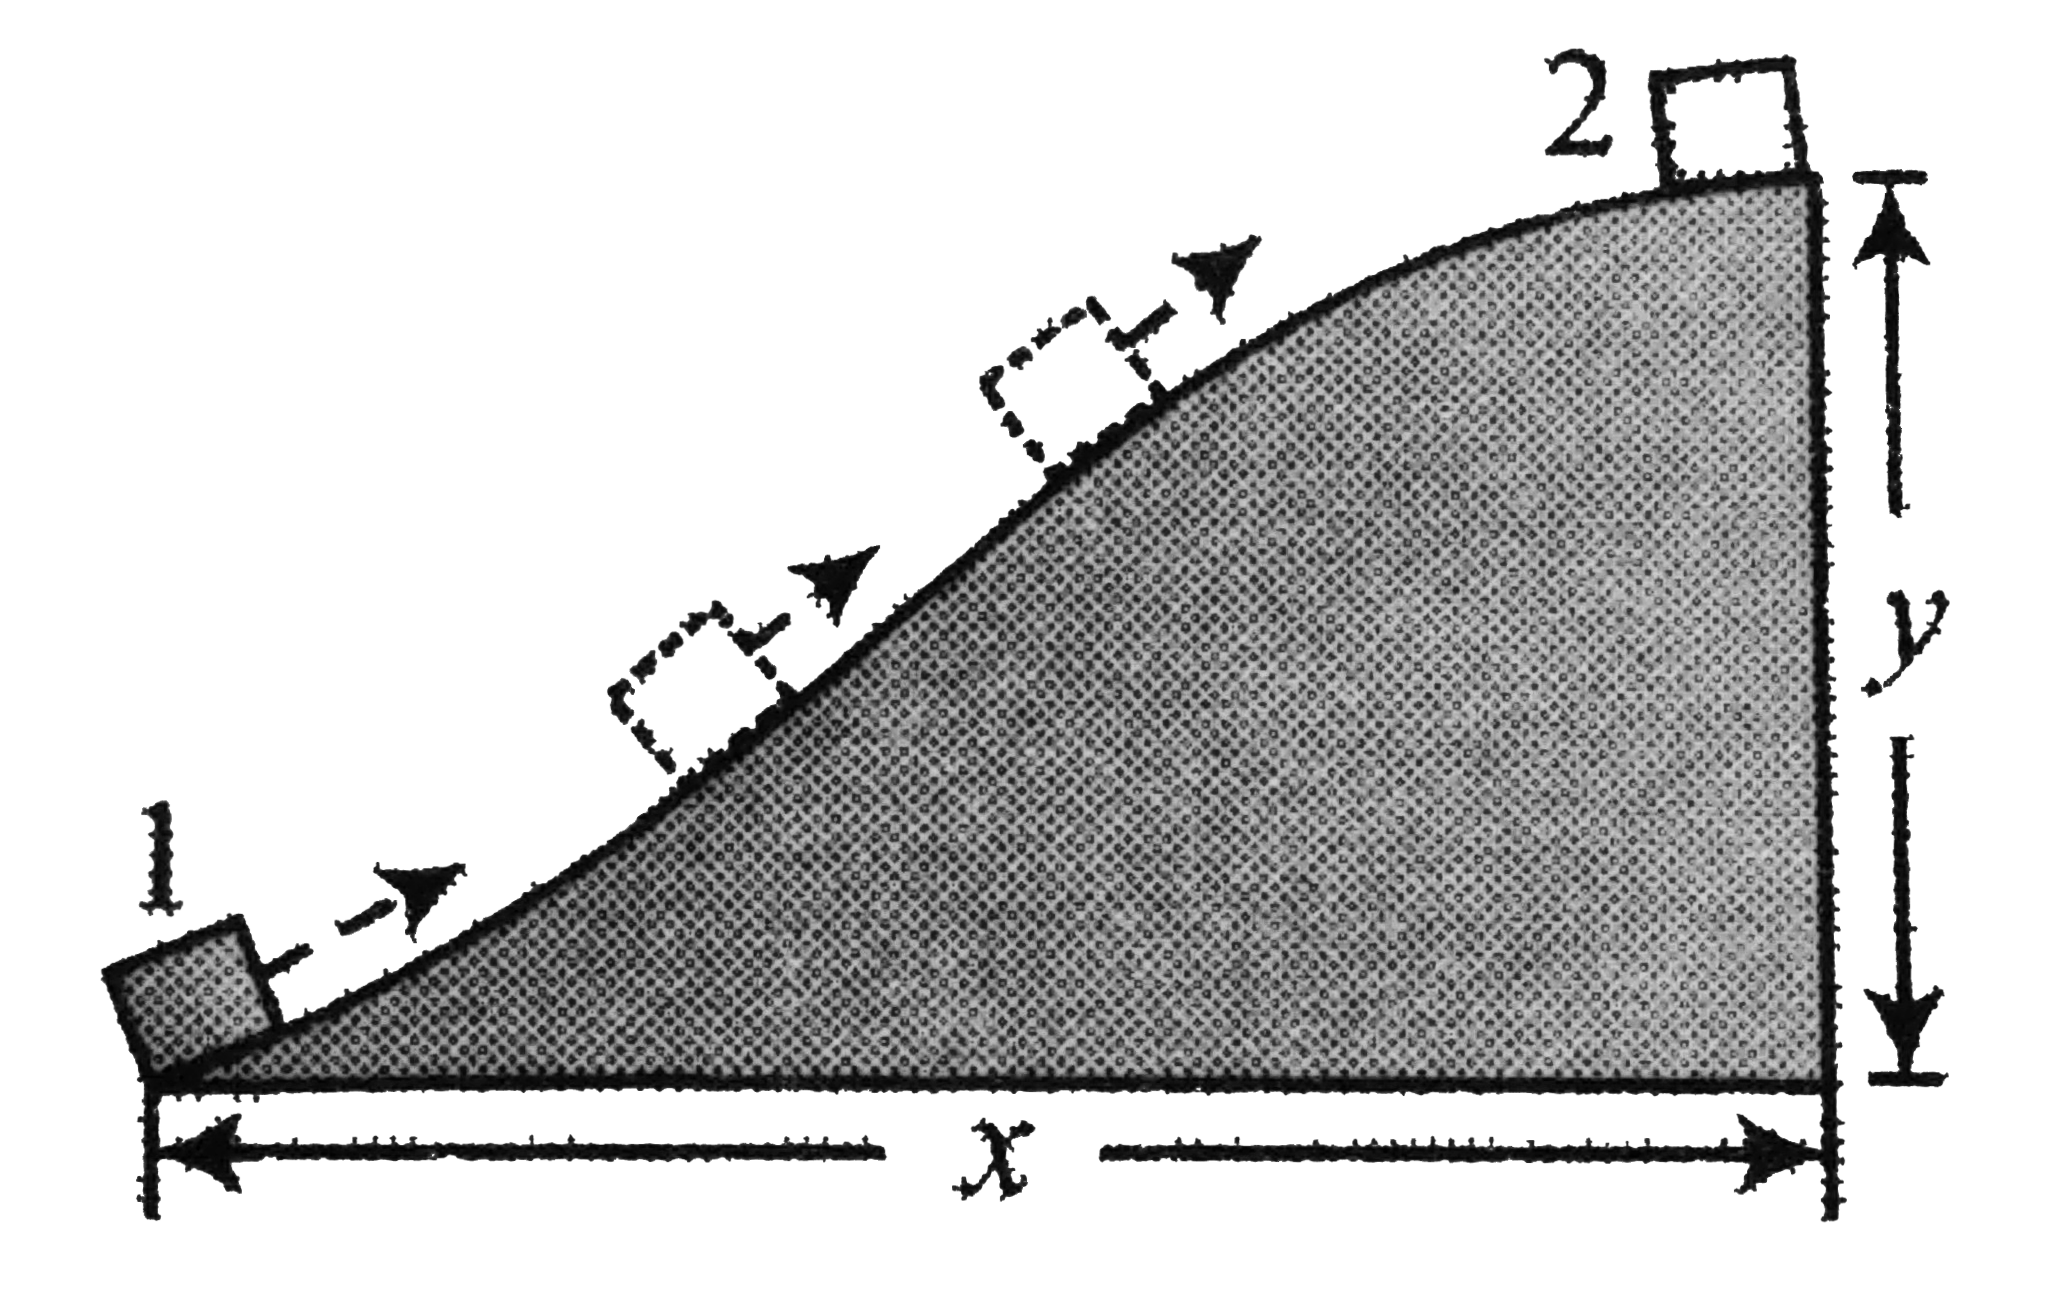
View SolutionA block of mass m is slowly pulled along a curved surface from position 1 and 2. If the coefficient of kinetic friction between the block and surface is μ, find the work done by the applied force.
View Solution
