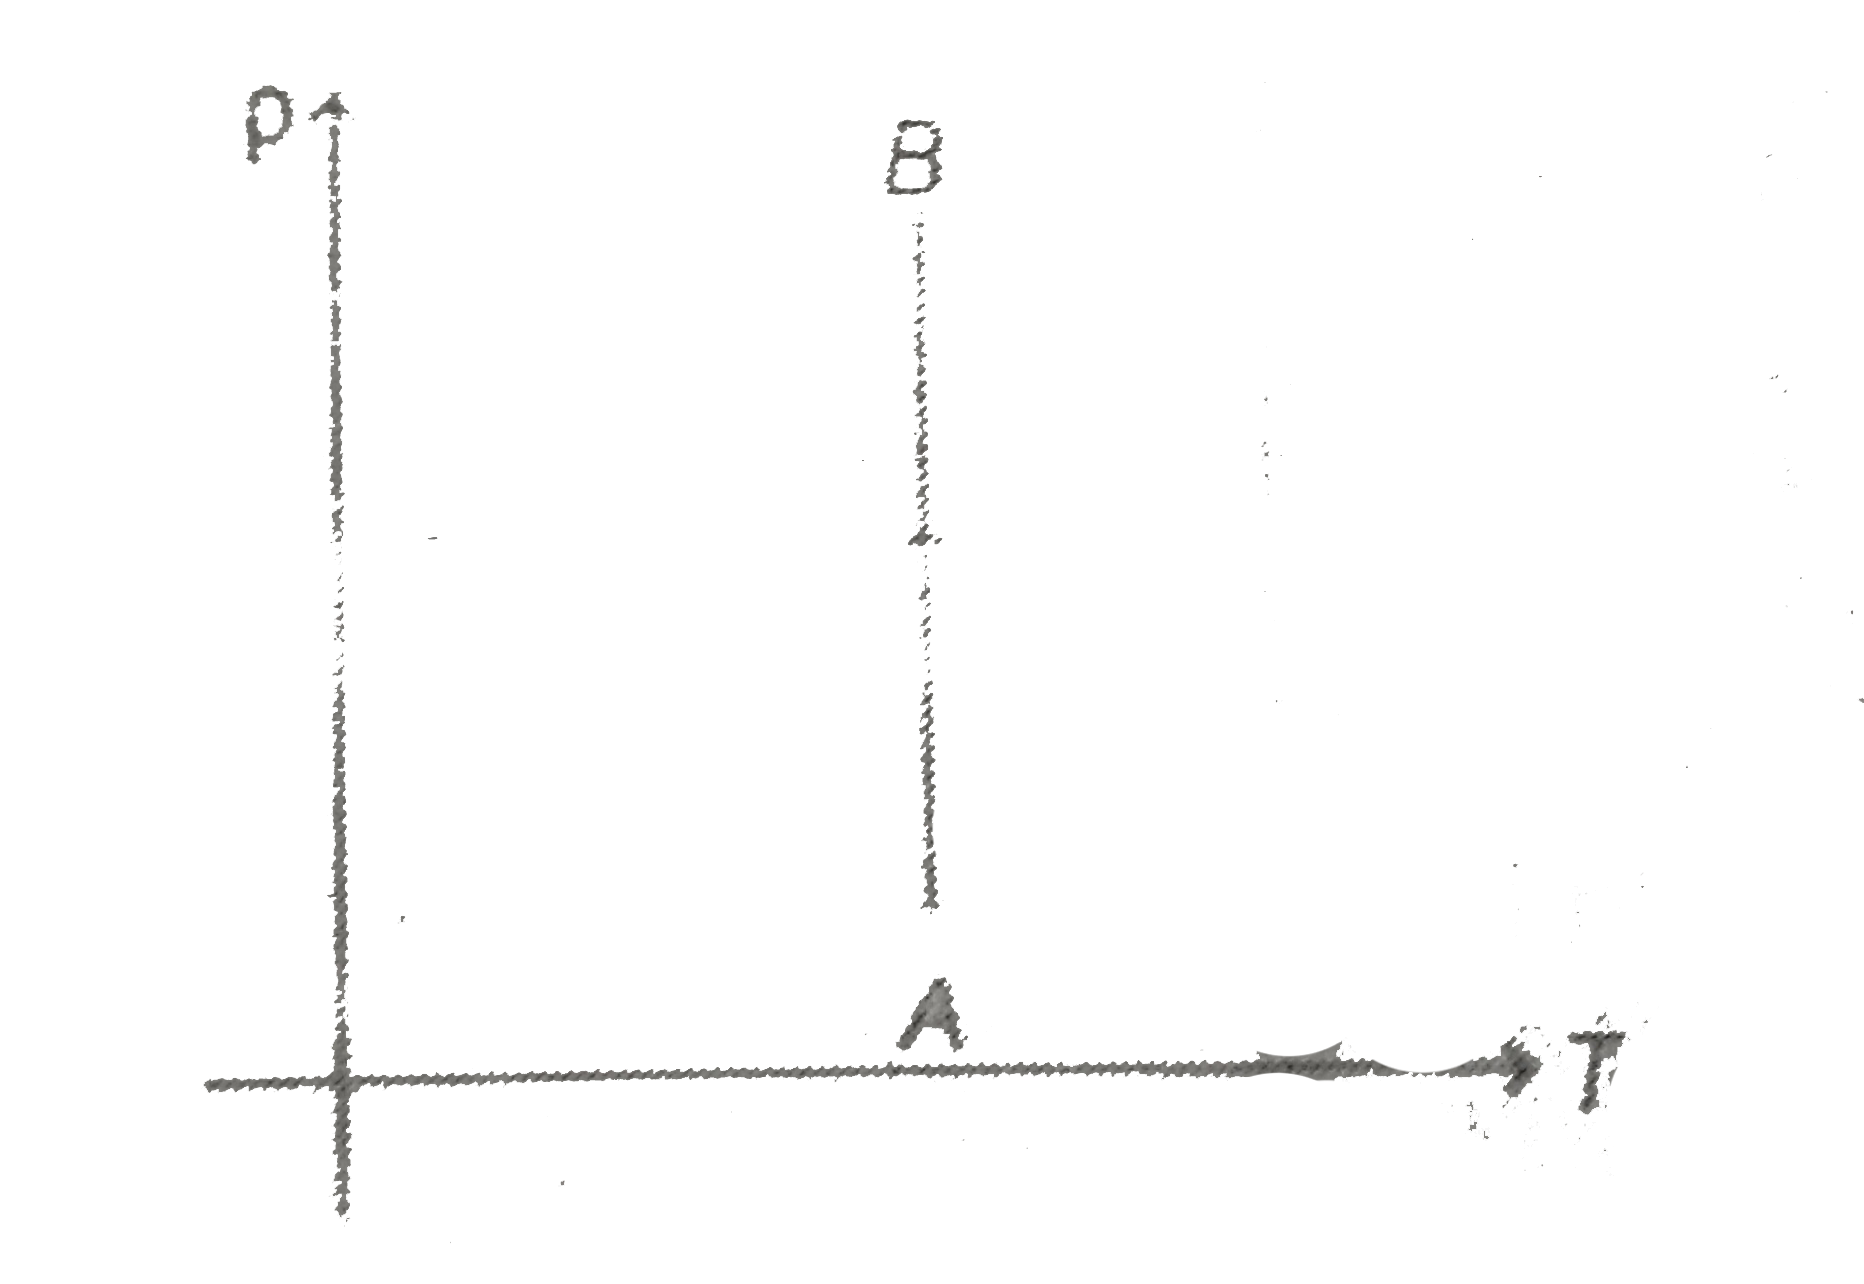
During an experiment, an ideal gas is found to obey a condition p2ρ=constant. (ρ = density of the gas). The gas is initially at temperature (T), pressure (p) and density ρ. The gas expands such that density changes to ρ/2.
The pressure of the gas changes to √2P.
The temperature of the gas changes to √2T.
The graph of the above process on the P−T diagram is parabola.
The graph of the above process on the P−T diagram is hyperbola.
The correct Answer is:B, D
To solve the problem, we need to analyze the relationship given by the condition p2ρ=constant and how it affects the pressure, temperature, and the graphical representation in the P−T diagram when the gas expands and its density changes from ρ to ρ2.
1. Understanding the Given Condition:
The condition states that p2ρ=constant. This implies that p2 is directly proportional to ρ:
p2∝ρ⇒p∝√ρ
2. Initial and Final Conditions:
- Initial density: ρinitial=ρ
- Final density: ρfinal=ρ2
3. Relating Initial and Final Pressures:
From the proportionality derived earlier, we can write:
pinitialpfinal=√ρinitialρfinal
Substituting the values:
ppfinal=√ρρ2=√2
Rearranging gives:
pfinal=p√2=p√2⇒pfinal=p√2
4. Checking the First Option:
The first option states that the pressure changes to √2p. Since we found that pfinal=p√2, this option is incorrect.
5. Using the Ideal Gas Law:
The ideal gas law states:
ρ=pMRT
Rearranging gives:
p=ρRTM
6. Finding the Relationship Between Pressure and Temperature:
Since we know that p2∝ρ, we can also express it in terms of temperature:
p2∝pMRT⇒p∝1T
Therefore, we can write:
pT=constant
7. Relating Initial and Final Temperatures:
Using the relationship pinitialTinitial=pfinalTfinal:
pT=p√2Tfinal⇒Tfinal=√2T
8. Checking the Second Option:
The second option states that the temperature changes to √2T. Since we derived Tfinal=√2T, this option is correct.
9. Analyzing the Graph on the P−T Diagram:
From the relationship p∝1T, we see that pressure is inversely proportional to temperature. This indicates that the graph of pressure versus temperature will be a hyperbola.
10. Checking the Third and Fourth Options:
- The third option states that the graph is a parabola, which is incorrect.
- The fourth option states that the graph is a hyperbola, which is correct.
Final Answers:
- The correct options are:
- Second option: Temperature changes to √2T (Correct)
- Fourth option: The graph of the above process on the P−T diagram is a hyperbola (Correct)
The condition states that p2ρ=constant. This implies that p2 is directly proportional to ρ:
p2∝ρ⇒p∝√ρ
- Initial density: ρinitial=ρ
- Final density: ρfinal=ρ2
From the proportionality derived earlier, we can write:
pinitialpfinal=√ρinitialρfinal
Substituting the values:
ppfinal=√ρρ2=√2
Rearranging gives:
pfinal=p√2=p√2⇒pfinal=p√2
The first option states that the pressure changes to √2p. Since we found that pfinal=p√2, this option is incorrect.
The ideal gas law states:
ρ=pMRT
Rearranging gives:
p=ρRTM
Since we know that p2∝ρ, we can also express it in terms of temperature:
p2∝pMRT⇒p∝1T
Therefore, we can write:
pT=constant
Using the relationship pinitialTinitial=pfinalTfinal:
pT=p√2Tfinal⇒Tfinal=√2T
The second option states that the temperature changes to √2T. Since we derived Tfinal=√2T, this option is correct.
From the relationship p∝1T, we see that pressure is inversely proportional to temperature. This indicates that the graph of pressure versus temperature will be a hyperbola.
- The third option states that the graph is a parabola, which is incorrect.
- The fourth option states that the graph is a hyperbola, which is correct.
- The correct options are:
- Second option: Temperature changes to √2T (Correct)
- Fourth option: The graph of the above process on the P−T diagram is a hyperbola (Correct)
Topper's Solved these Questions
- KTG & THERMODYNAMICSBook:RESONANCE ENGLISHChapter:KTG & THERMODYNAMICSExercise:PART -IV
Explore 9 Videos
- KTG & THERMODYNAMICSBook:RESONANCE ENGLISHChapter:KTG & THERMODYNAMICSExercise:Exercise-3
Explore 1 Video
- KTG & THERMODYNAMICSBook:RESONANCE ENGLISHChapter:KTG & THERMODYNAMICSExercise:PART -I
Explore 15 Videos
- KINETIC THEORY OF GASES AND THERMODYNAMICSBook:RESONANCE ENGLISHChapter:KINETIC THEORY OF GASES AND THERMODYNAMICSExercise:Exercise
Explore 64 Videos
- MAGNETIC FIELD AND FORCESBook:RESONANCE ENGLISHChapter:MAGNETIC FIELD AND FORCESExercise:Exercise
Explore 64 Videos
Similar Questions
During an experiment, an ideal gas is found to obey a condition Vp2= constant. The gas is initially at a temperature (T), pressure (p) and volume (V). The gas expands to volume (4V).
View SolutionDuring an experiment, an ideal gas is found to obey an additional law pV2=constant. The gas is initially at a temperature T and volume V. Find the temperature when it expands to a volume 2V.
View Solution
Knowledge Check
The pressure inside a liquid of density ρ at a depth h is :
AhρgBhρgChρgDhρ
During an experiment, an ideal gas is found to obey an additional law VP2=constant, The gas is initially at a temperature T, and volume V. When it expands to a volume 2V, the temperature becomes…….
View SolutionDuring adiabatic process pressure (p) versus density (ρ) equation is
View SolutionThe ednsity (ρ) of an ideal gas varies with temperature T as shown in figure. Then

View SolutionIf P is the pressure and ρ is the density of a gas, then P and ρ are related as :
View SolutionAn ideal gas is found to obey the law V2T=constant. The initial pressure and temperature are P0 and T0. If gas expands such that its pressure becomes P04, then the final temperature of the gas will be
View SolutionThe energy density uV of an ideal gas is related to its pressure P as
View SolutionWhich of the following shown the correct relationship between the pressure 'P' and density ρ of an ideal gas at constant temperature?
View Solution

