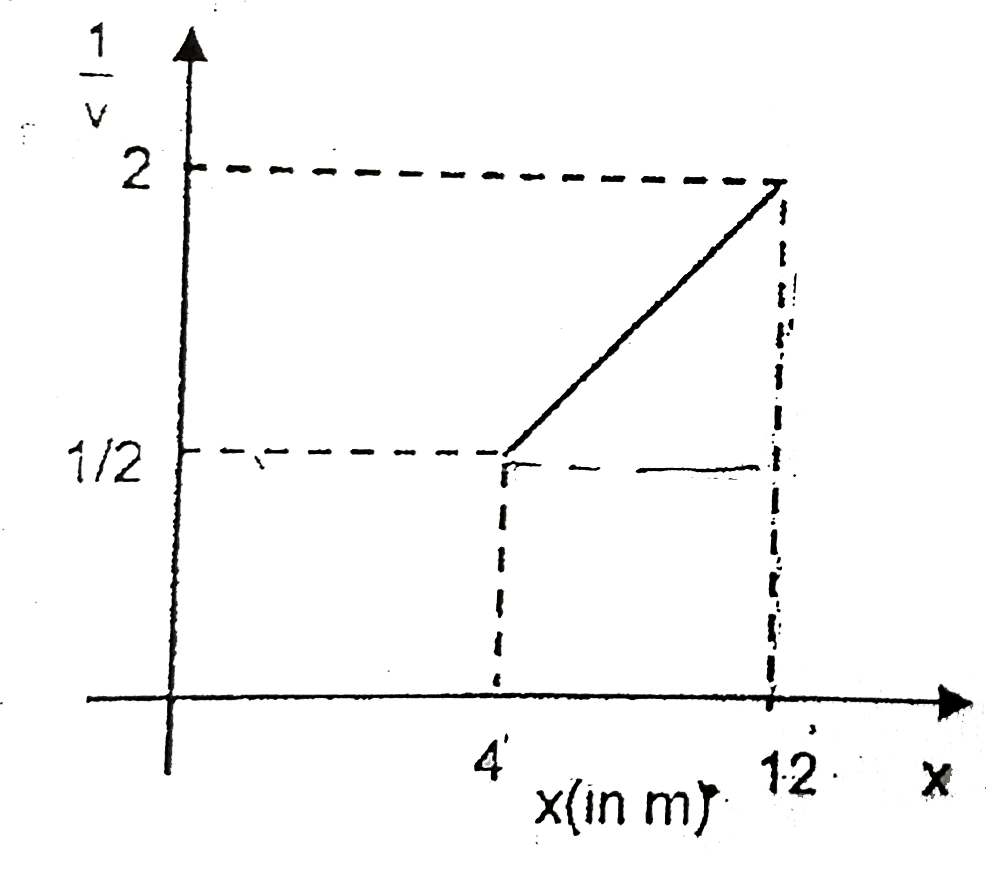
For an object, graph of 1v and x is as shown in figure, where v is velocity and x is position of object. Find time taken by object from x = 4m to x = 12m
10s
8s
6s
3s
The correct Answer is:A
For an object …………….
Equation of graph
1v=3x16−14
or v=13x16−14
dxdt=13x16−14⇒12∫4(3x16−14)dx=t∫0dt
t=10s
Topper's Solved these Questions
- TEST PAPERSBook:RESONANCE ENGLISHChapter:TEST PAPERSExercise:PART - II PHYSICS
Explore 106 Videos
- SIMPLE HARMONIC MOTION Book:RESONANCE ENGLISHChapter:SIMPLE HARMONIC MOTION Exercise:Advanced Level Problems
Explore 13 Videos
- TEST SERIESBook:RESONANCE ENGLISHChapter:TEST SERIESExercise:PHYSICS
Explore 130 Videos
Similar Questions
A Force F acting on an object varies with distance x as shown in the figure . The force is in newton and x in metre. The work done by the force in moving the object from x=0 to x=6m is
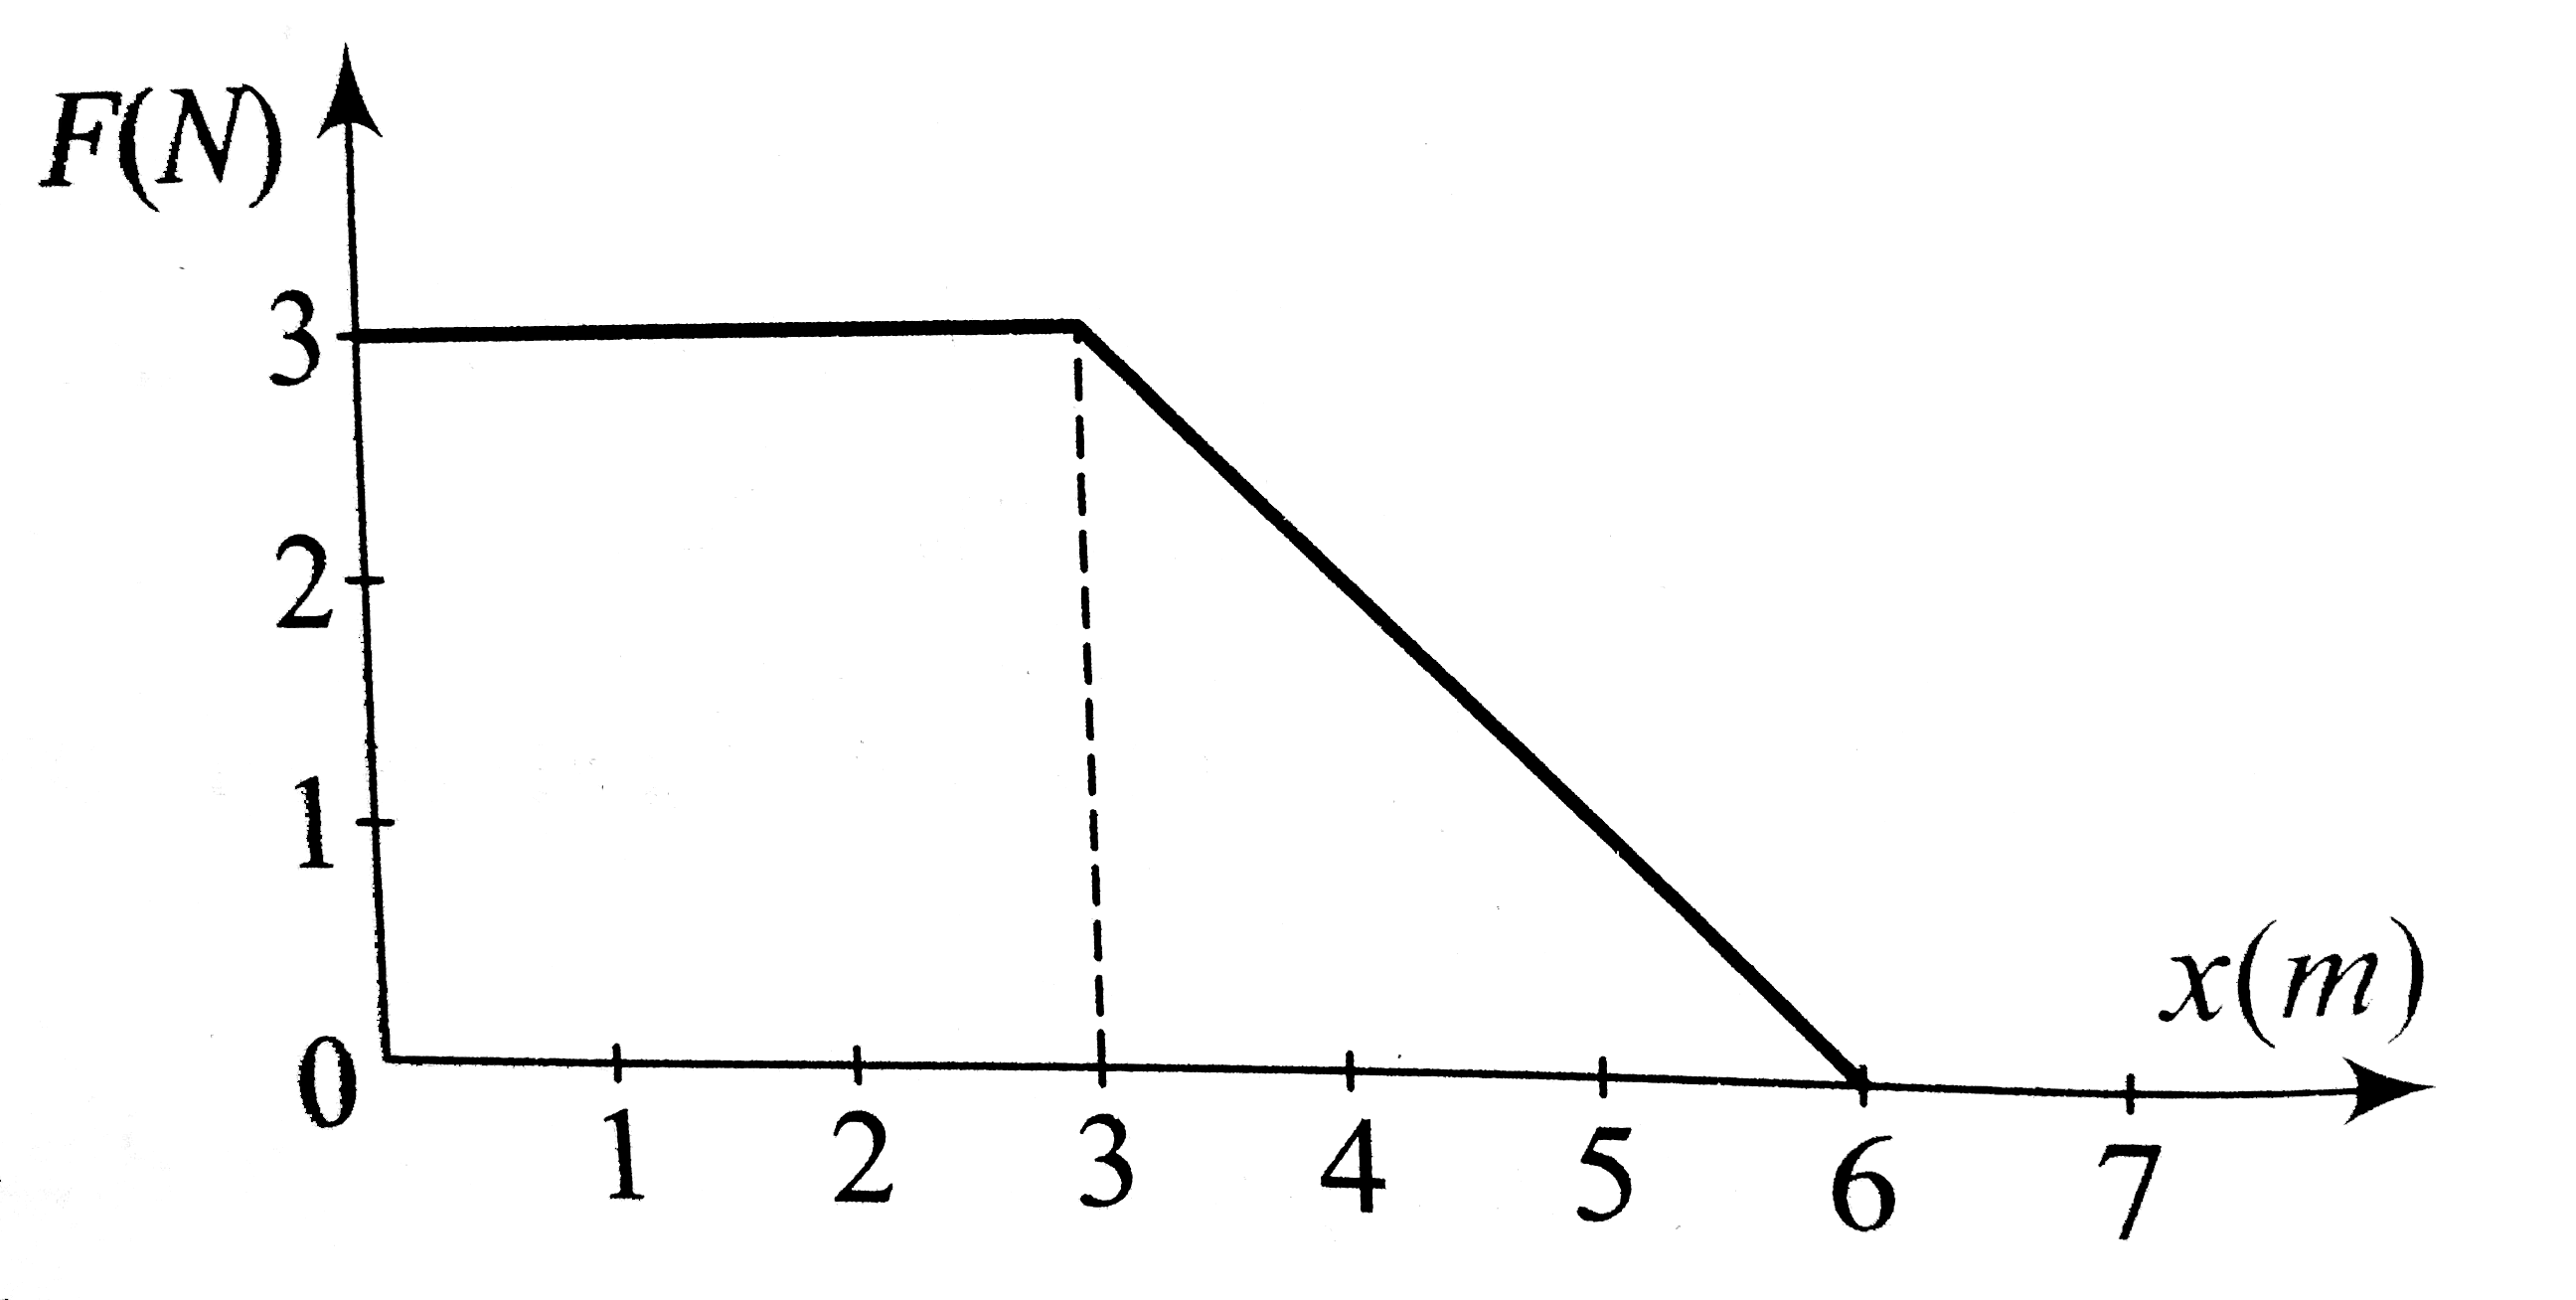
(a) 4.5 J (b) 13.5 J (c) 9.0 J (d) 18.0 J
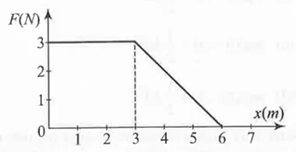
View SolutionA force F acting on an object varies with distance x as shown here.

The force is in N and x in m. The work done by the force in moving the object from x = 0 to x = 6 m is
View Solution
Knowledge Check
A force F acting on an object varies with distance x as shown in the figure. The work done by the force in moving the object from x=0 to x = 20 m is
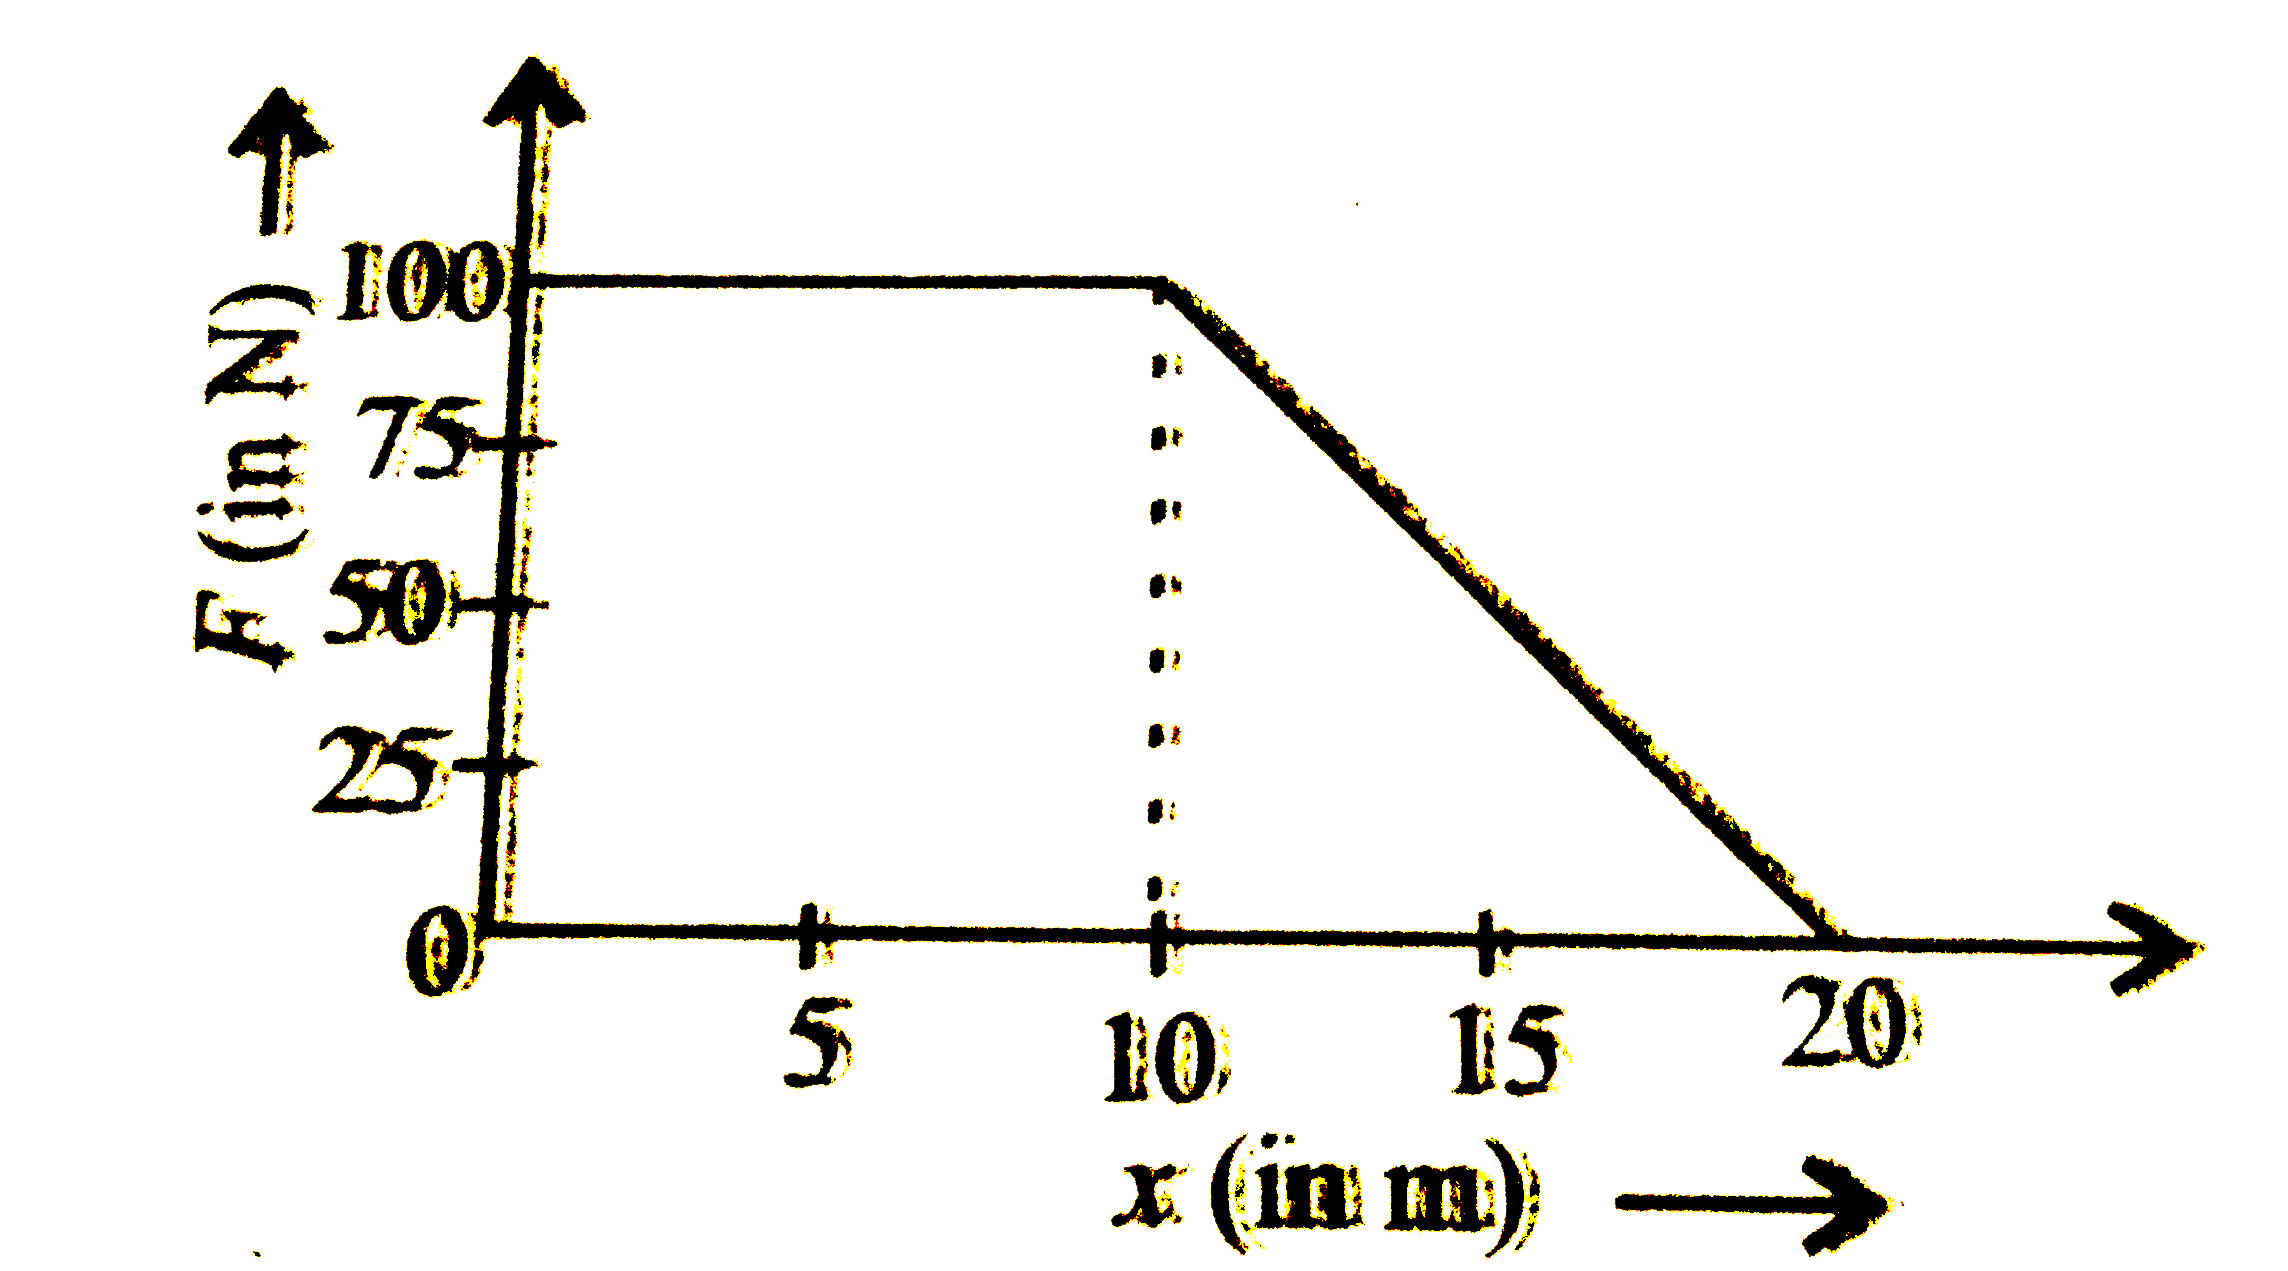 A500 JB1000 JC1500 JD2000 J
A Force F acting on an object varies with distance x as shown in the here . The force is in newton and x in metre. The work done by the force in moving the object from x=0 to x=6m is

View SolutionAn object and a plane mirror are shown in figure. Mirror is moved with velocity V as shown. The velocity of image is :
 .
.
View SolutionThe velocity - time (V - t) graph of an object of mass 2 kg is as shown in figure while it is moving on a rough horizontal surface. The coefficient of friction between object and the surface is (g=10ms2)
View SolutionA force F acting on an object varies with distancex as shown in figure. Work done by the force in moving the object from x = 1 m to x= 6 m is
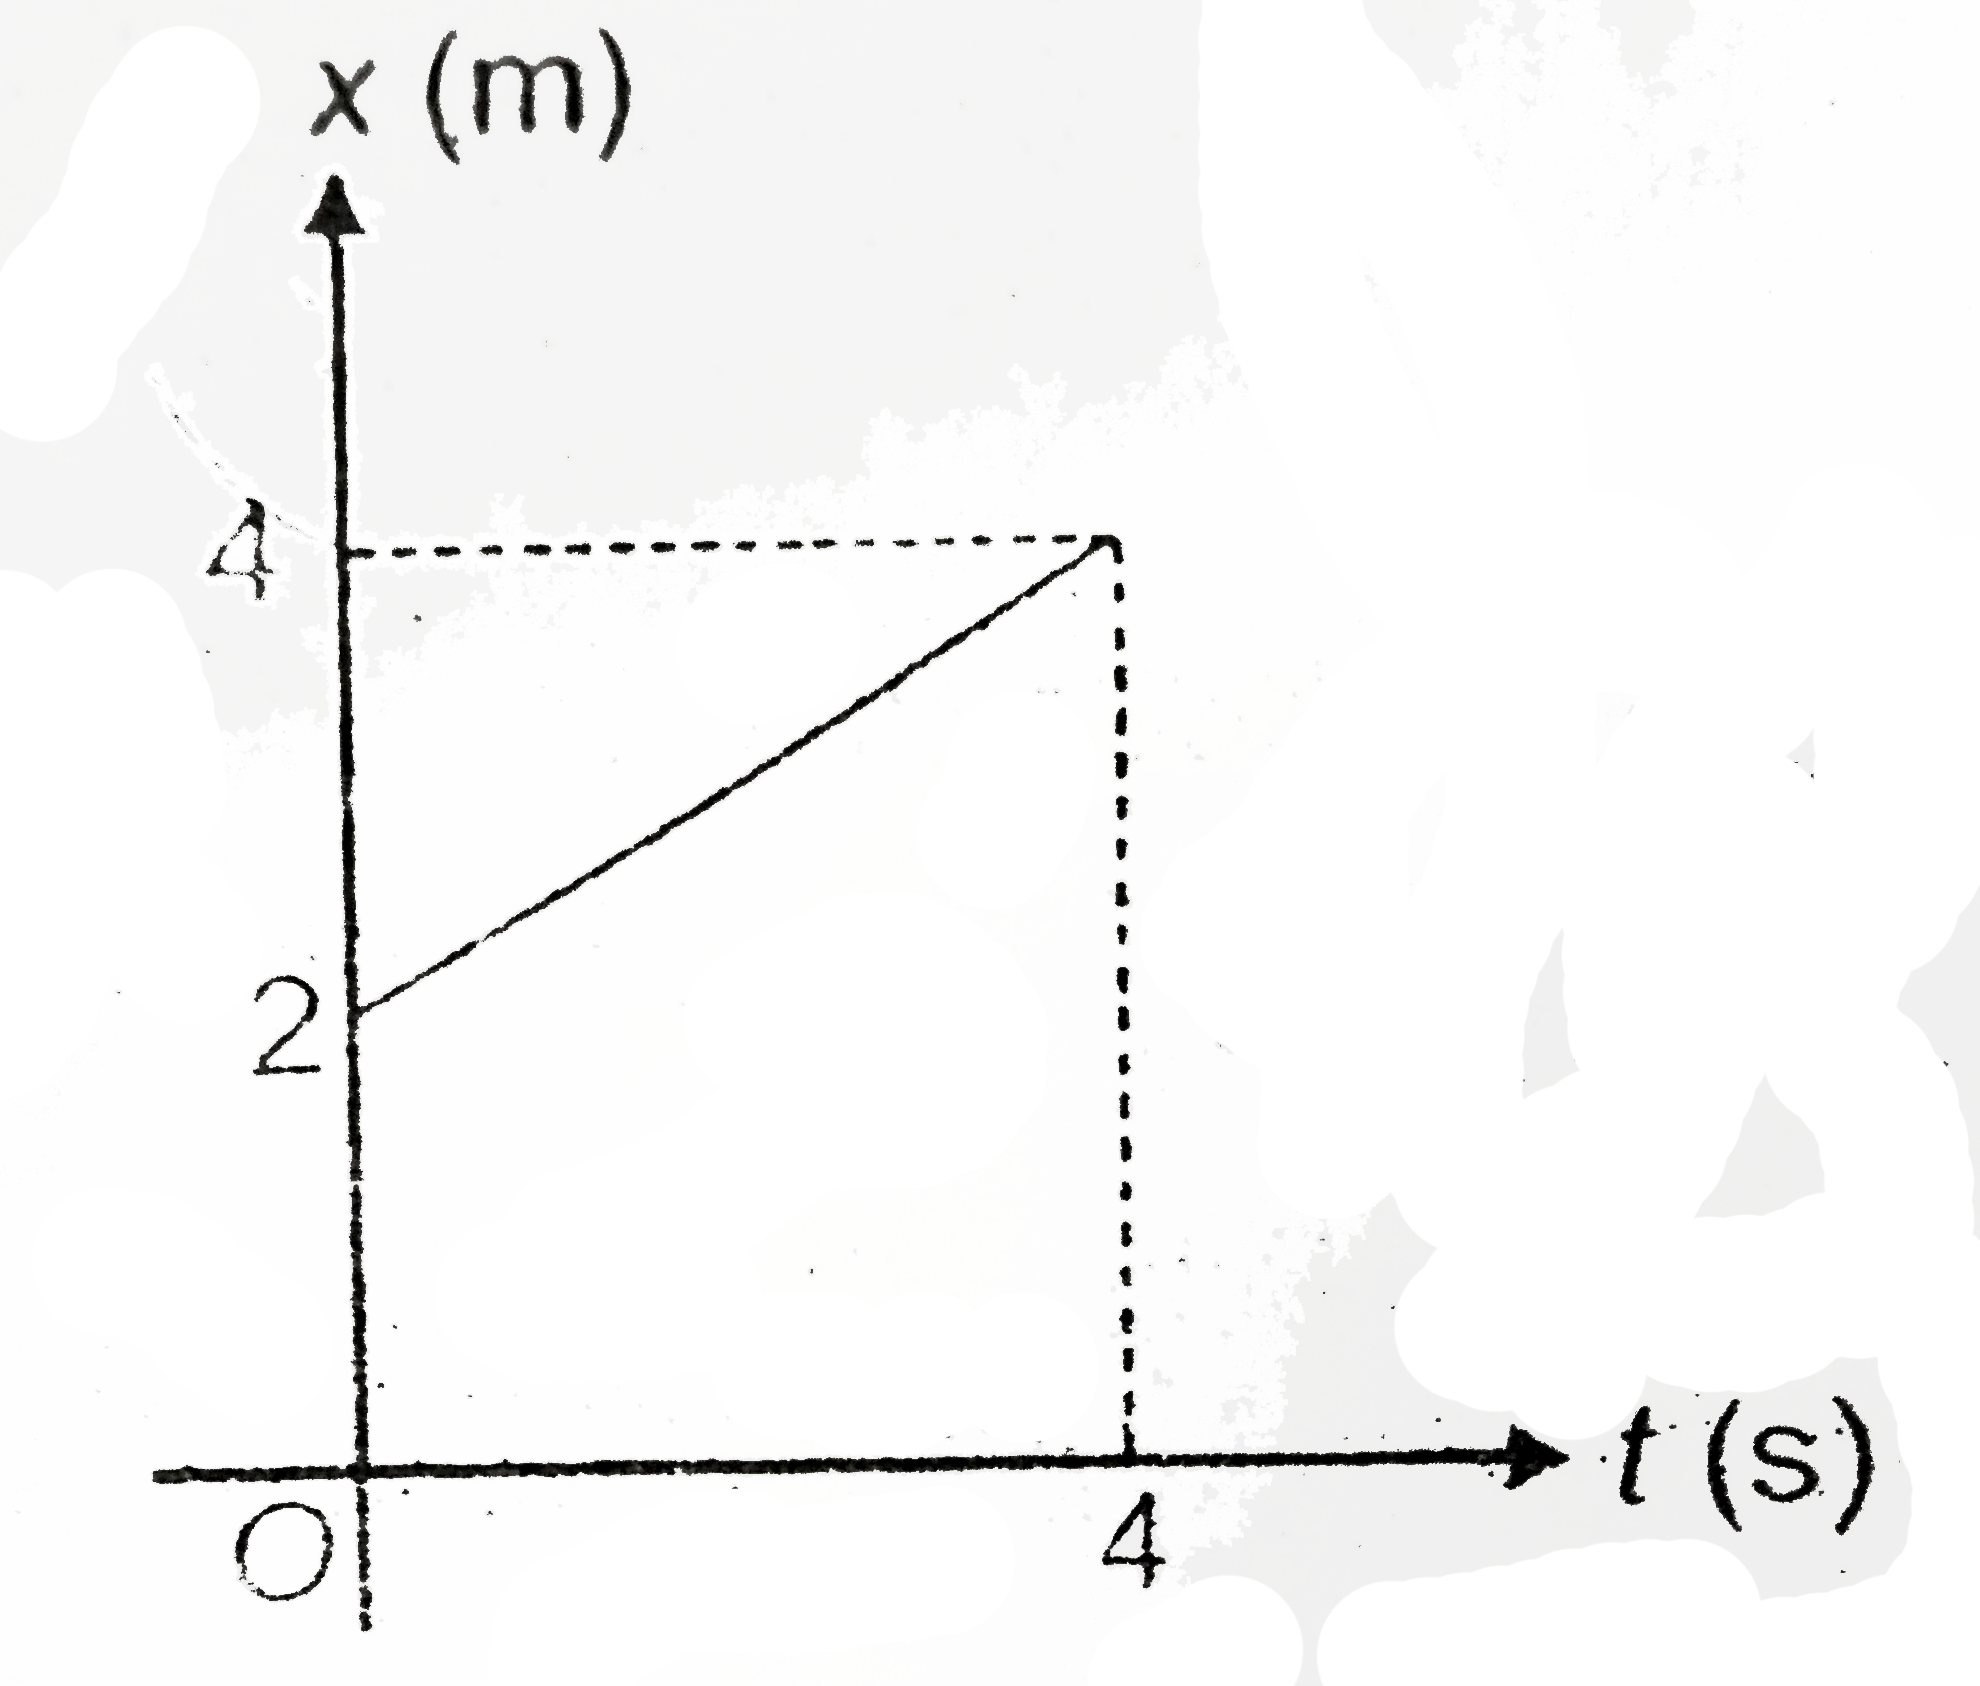
View SolutionIn the given x - t graph. Find the position of an object at t = 3 second
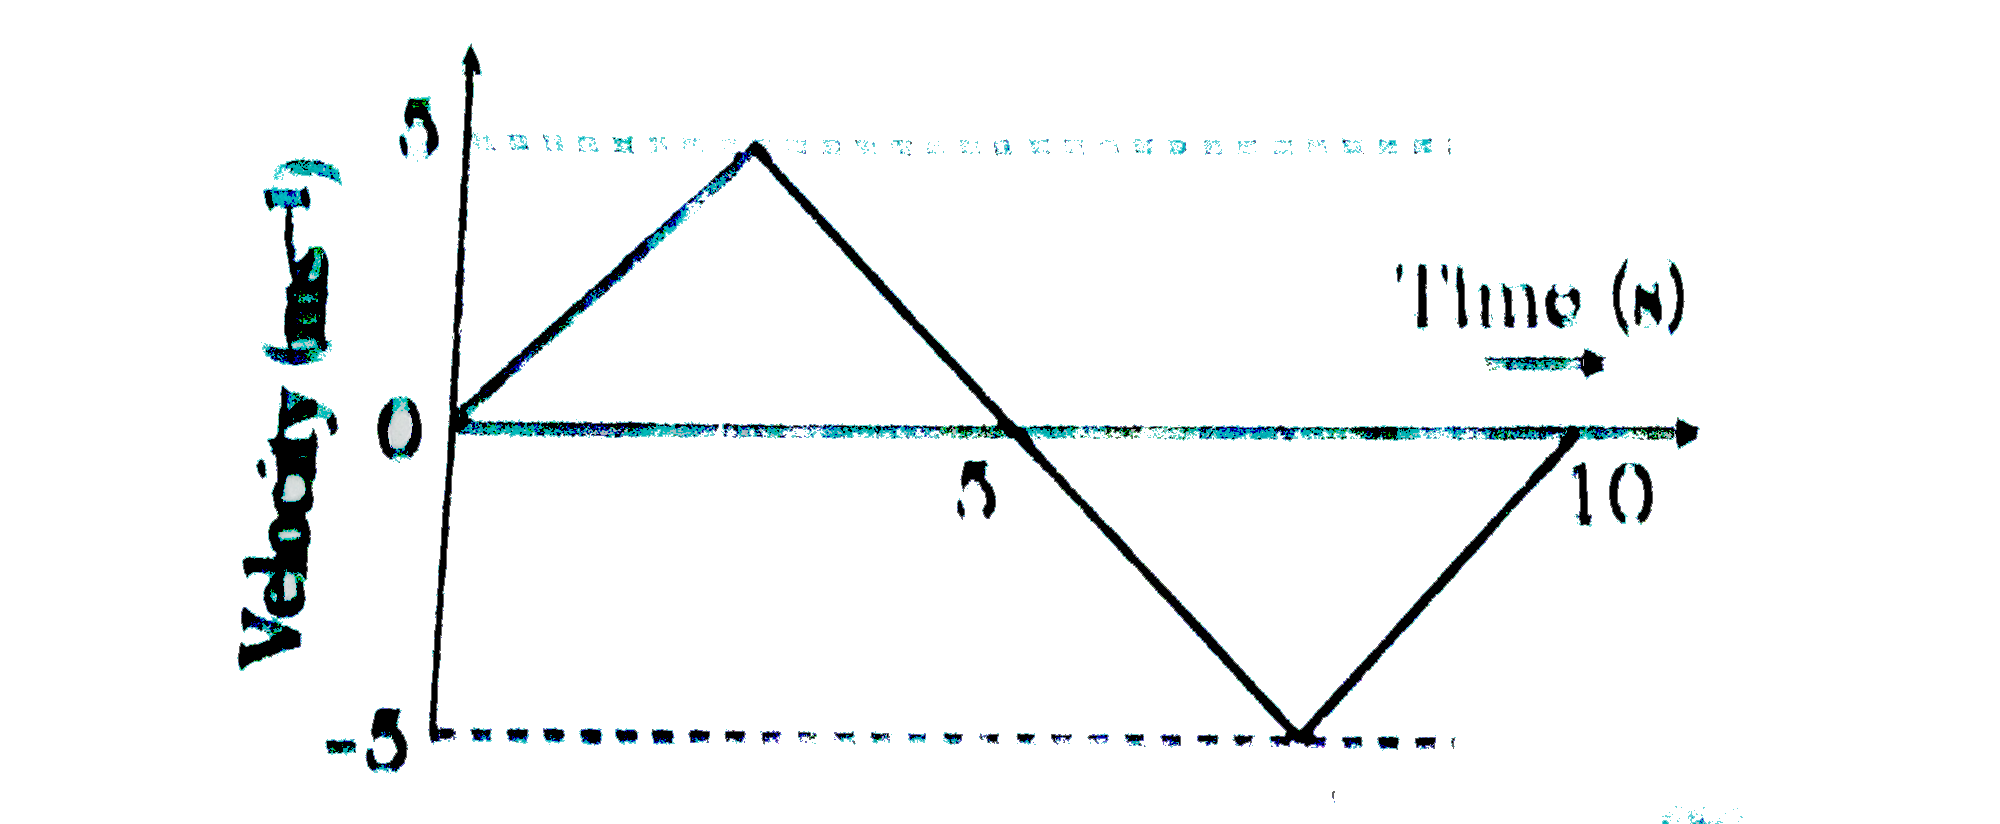
View SolutionThe v-t plot of a moving object ios shown in the figure. The average velocity of the object during the first 10 s is
View Solutionwhen a constant power is delivered to an object, then the graph between velocity and position of the object is( motion of object is along x-axis)
View Solution