Figure shows a graph between the magnitude of magnetic field passing normally through a closed loop and time t. Rank the five region's of the graph according to the emf in magnitude indụced in the loop, greatest first.
To solve the problem of ranking the regions of the graph according to the magnitude of the induced EMF in the loop, we can follow these steps:
Step 1: Understand the Relationship Between Magnetic Field and Induced EMF
The induced EMF (ε) in a closed loop is given by Faraday's law of electromagnetic induction, which states:
ε=−dΦBdt
where ΦB is the magnetic flux. For a uniform magnetic field passing normally through the loop, the magnetic flux is given by:
ΦB=B⋅A
where B is the magnetic field and A is the area of the loop. The induced EMF is thus related to the rate of change of the magnetic field (B) over time.
Step 2: Analyze the Graph
From the problem, we have a graph that shows the magnitude of the magnetic field B versus time t. The slope of the graph (dB/dt) indicates how quickly the magnetic field is changing. The greater the slope, the greater the induced EMF.
Step 3: Identify the Regions with Maximum Slope
1. Identify the regions A, B, C, D, and E on the graph.
2. Determine the slope in each region:
- Region AB: This region has the steepest slope, indicating the maximum rate of change of the magnetic field.
- Region CD: This region has a moderate slope.
- Region DE: This region has a smaller slope compared to CD.
- Region BC: This region has the least slope.
Step 4: Rank the Regions
Based on the slopes identified in the previous step, we can rank the regions according to the magnitude of the induced EMF:
1. AB (greatest slope, greatest EMF)
2. CD (moderate slope, moderate EMF)
3. DE (smaller slope, lesser EMF)
4. BC (least slope, least EMF)
Final Ranking
Thus, the ranking from greatest to least induced EMF is:
1. AB
2. CD
3. DE
4. BC
The induced EMF (ε) in a closed loop is given by Faraday's law of electromagnetic induction, which states:
ε=−dΦBdt
where ΦB is the magnetic flux. For a uniform magnetic field passing normally through the loop, the magnetic flux is given by:
ΦB=B⋅A
where B is the magnetic field and A is the area of the loop. The induced EMF is thus related to the rate of change of the magnetic field (B) over time.
From the problem, we have a graph that shows the magnitude of the magnetic field B versus time t. The slope of the graph (dB/dt) indicates how quickly the magnetic field is changing. The greater the slope, the greater the induced EMF.
1. Identify the regions A, B, C, D, and E on the graph.
2. Determine the slope in each region:
- Region AB: This region has the steepest slope, indicating the maximum rate of change of the magnetic field.
- Region CD: This region has a moderate slope.
- Region DE: This region has a smaller slope compared to CD.
- Region BC: This region has the least slope.
Based on the slopes identified in the previous step, we can rank the regions according to the magnitude of the induced EMF:
1. AB (greatest slope, greatest EMF)
2. CD (moderate slope, moderate EMF)
3. DE (smaller slope, lesser EMF)
4. BC (least slope, least EMF)
Thus, the ranking from greatest to least induced EMF is:
1. AB
2. CD
3. DE
4. BC
Similar Questions
The graph gives the magnitude B(t) of a uniform magnetic field that exists throughout a conductig loop, perpendicular to the plane of the loop. Rank the five regions of the graph according to the magnitude fo the emf induced in the loop, greater first

View SolutionThe graph shows the variation of magnetic field B that exists through a conducing loop, perpendicular to the plane of the loop. The emf's induced in the loop during equal intervals a, b, c, d and e are related as
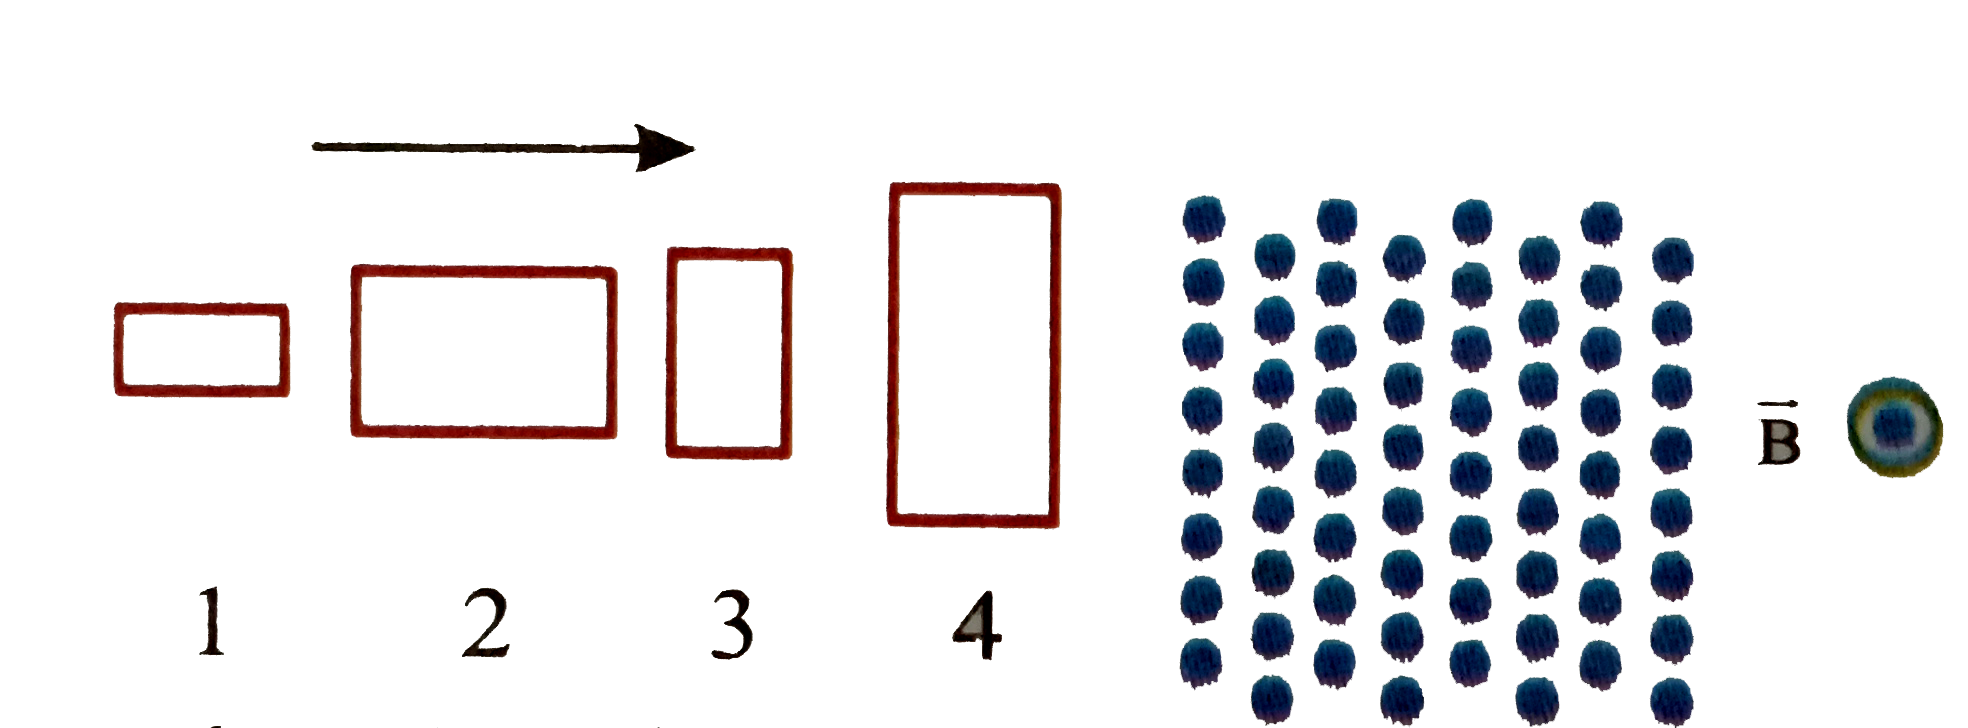
View SolutionThe figure shows four wire loops, with edge length of either L or 2L. All four loops will move through a region of uniform magnetic field →B (directed out of the page) at the same constant velocity . Rank the four loops according to the maximum magnitude of the e.m.f. induced as they move through the field, greatest first

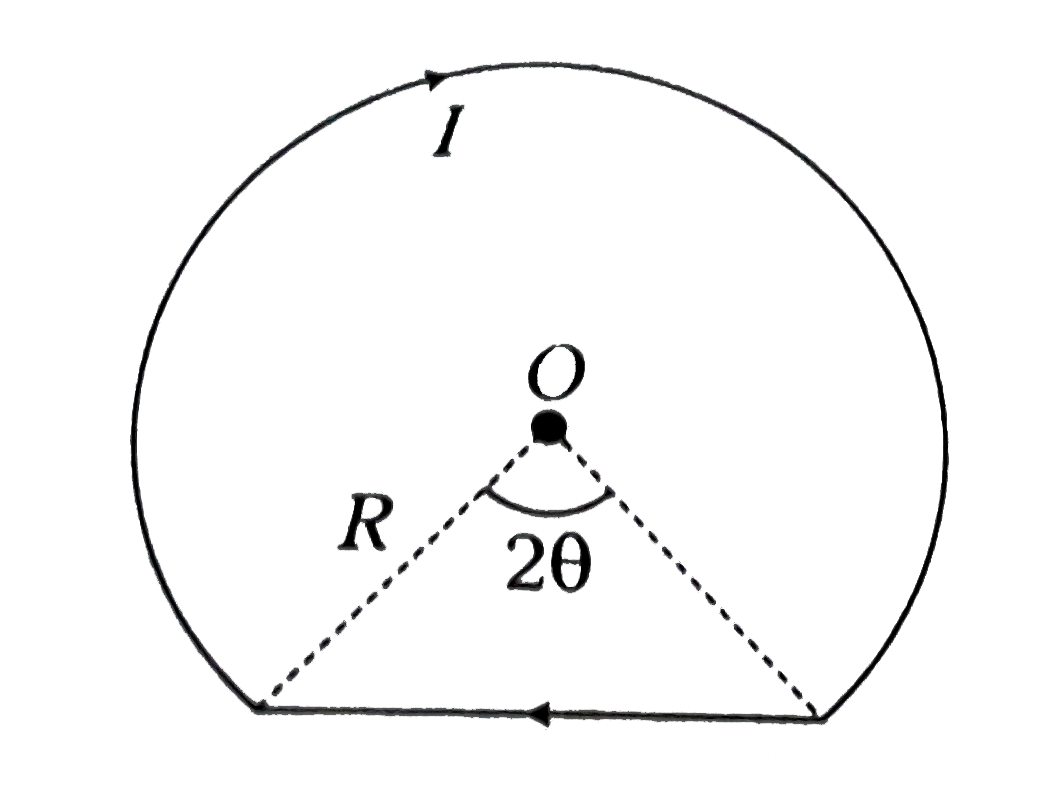
View SolutionA current l flows through a closed loop as shown in figure .The magnetic field at the centre O is
View SolutionFollowing figures show four situations in which positive and negative charges move horizontaly through a region and give the rate at which each charge moves. Rank the situations according to the effective current through the region greatest first.

View SolutionFigure shows a conducting loop placed in a magnetic field. The flux through the loop changes due to change in magnetic field according to the equation ϕ=5t−10t2. What is the direction and magnitude of induced current at t=0.25s?

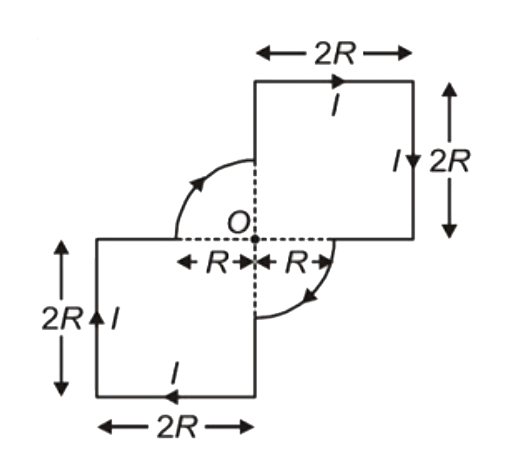
View SolutionA current - carrying loop is shown in the figure. The magnitude of the magnetic field produced at a point O is
View SolutionThe four wire loops shown figure have vertical edge lengths of either L,2L or 3L. They will move with the same speed into a region of uniform magnetic field →B directed out of the page. Rank them according to the maximum magnitude of the induced emf greatest to least.
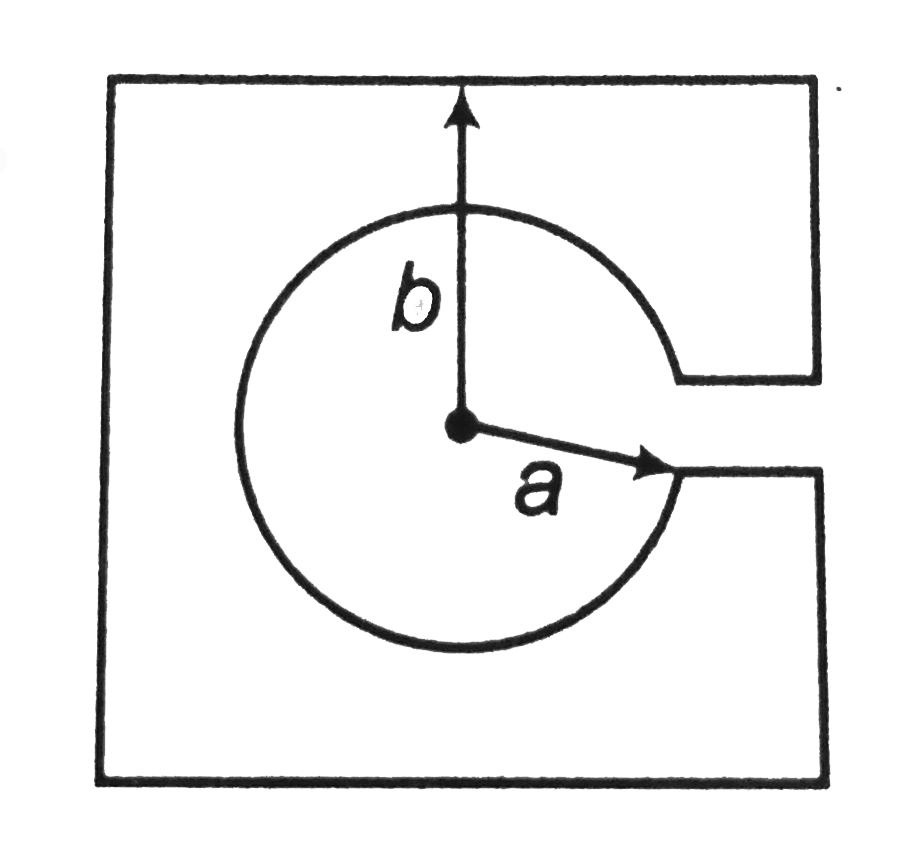
View SolutionA loop shown in the figure is immersed in the varying magnetic field B=B0t, directed into the page. If the total resistance of the loop is R, then the direction and magnitude of induced current in the inner circle is
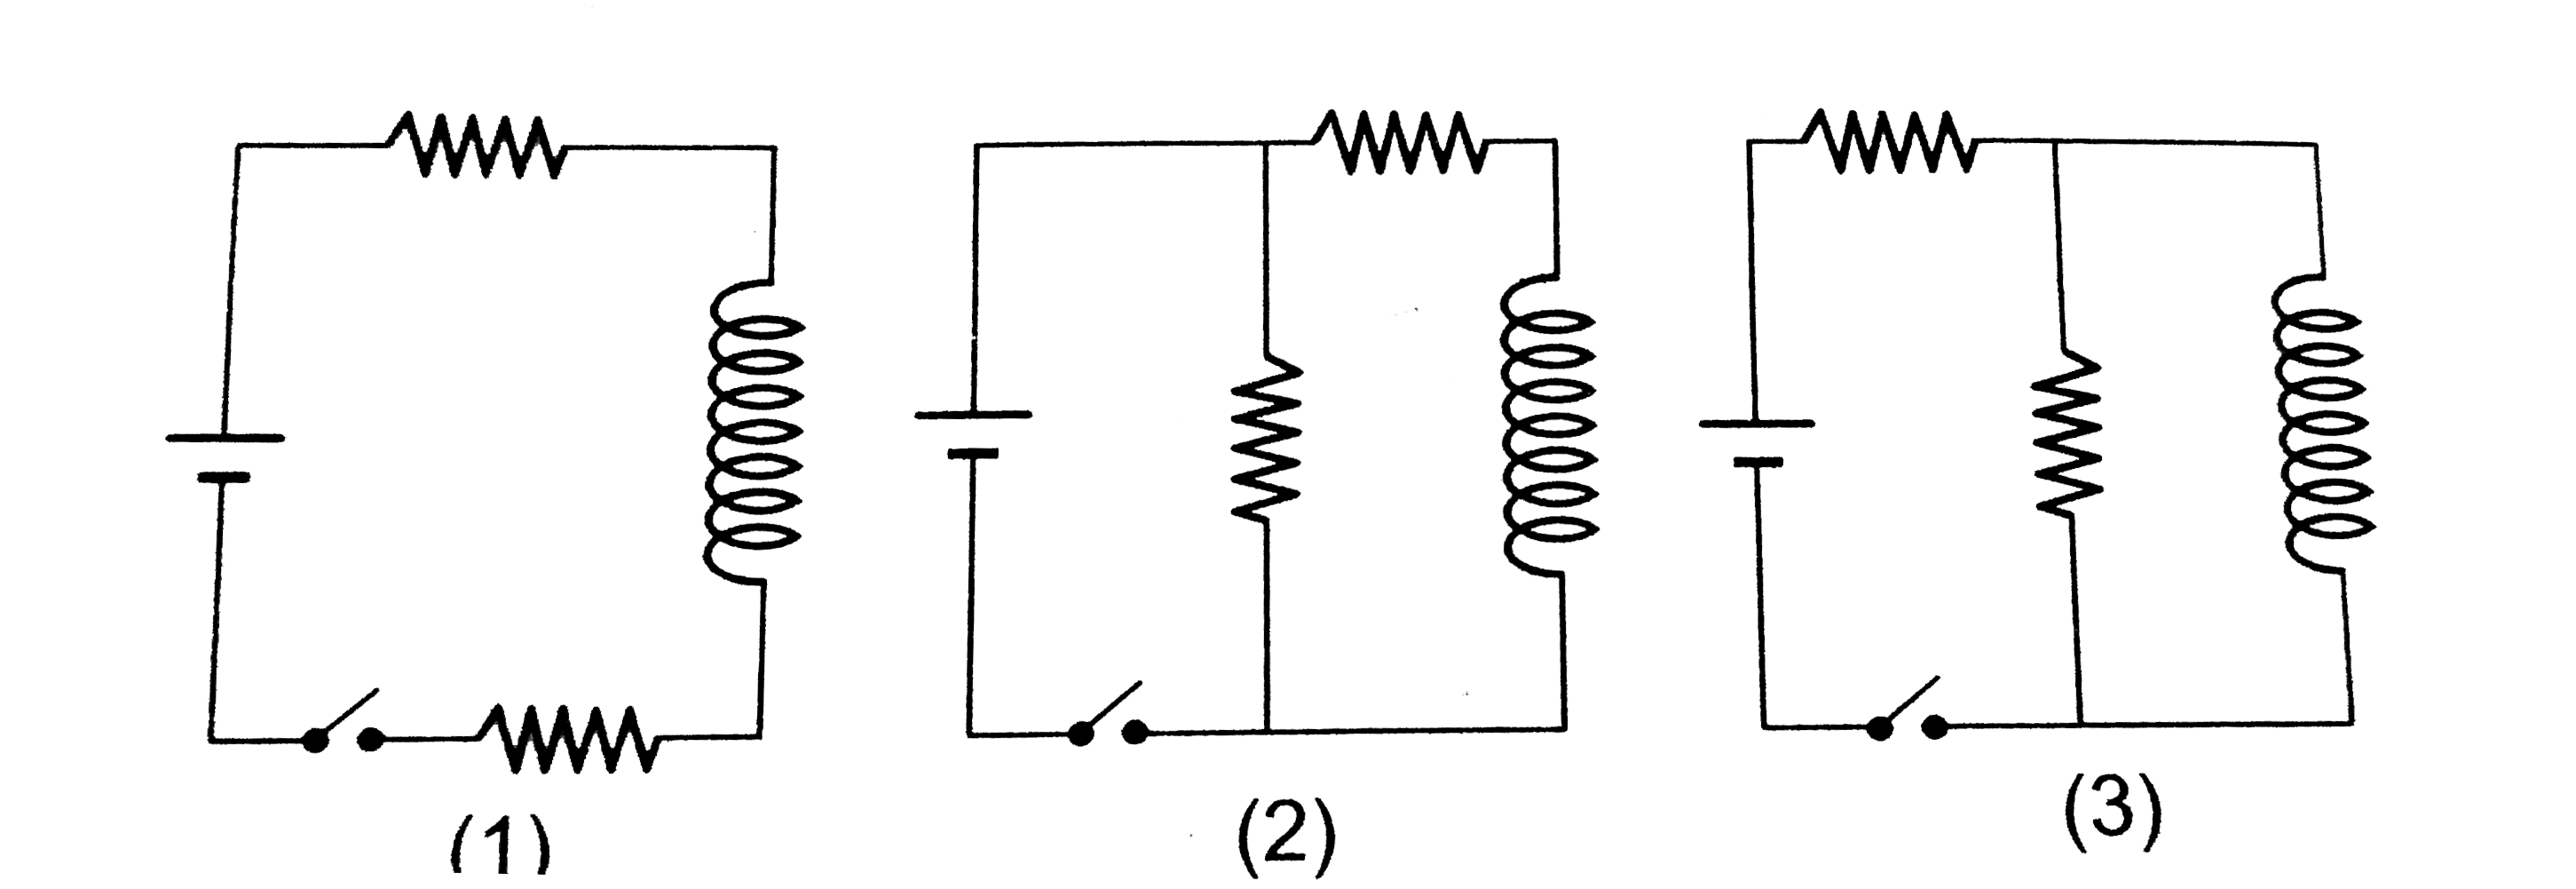
View SolutionThe figure shows theree cirrcuit with idential batteries, inductors, and resistors. Rank the circuit according to the current through the battery (i) just after the switch is closed and (ii) a long time later, greatest first
View Solution
