The stress-strain graph for a metallic wire is shown at two different temperature, T1 and T2 which temperature is high T1 or T2 ?
The slope of stress-strain curve with strain axis gives the value of Young's modulus. In the above graph strain is taken along y-axis. Therefore the slope of graph at temperature T1 is less than the slope of graph at temperature T2
Now as we know with increase in temperature the value of modulus of elasticity decreases. Therefore temperatureT1 is greater than temperature T2
Topper's Solved these Questions
- MECHANICAL PROPERTIES OF SOLIDSBOOK - AAKASH INSTITUTE ENGLISHCHAPTER - MECHANICAL PROPERTIES OF SOLIDSEXERCISE - Try Yourself
32 Videos
- MECHANICAL PROPERTIES OF SOLIDSBOOK - AAKASH INSTITUTE ENGLISHCHAPTER - MECHANICAL PROPERTIES OF SOLIDSEXERCISE - Assignment (SECTION - A)
31 Videos
- MECHANICAL PROPERTIES OF FLUIDSBOOK - AAKASH INSTITUTE ENGLISHCHAPTER - MECHANICAL PROPERTIES OF FLUIDSEXERCISE - SECTION - J
9 Videos
- Mock test 03BOOK - AAKASH INSTITUTE ENGLISHCHAPTER - Mock test 03EXERCISE - EXAMPLE
44 Videos
Similar Questions
The current - voltage graphs for a given metallic wire at two different temperatures T1andT2 are shown in the figure.
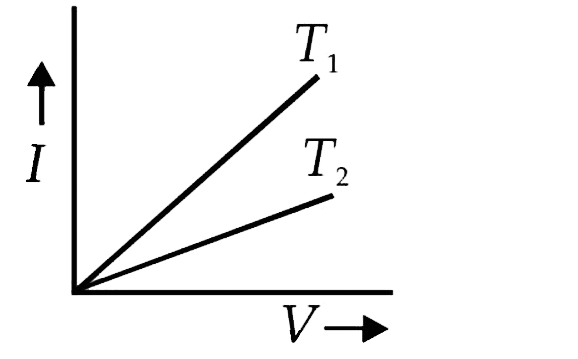
The temperature T2 is greater than T1.
View SolutionThe current - voltage graphs for a given metallic wire at two different temperatures T1andT2 are shown in the figure.

The temperature T2 is greater than T1.
View Solution
Knowledge Check
The voltage V and current I v graphs for a conductor at two different temperatures T1andT2 are shown in the figure. The relation between T1andT2 is
 AT1>T2BT1<T2CT1=T2DT1=1T2
The current voltage graphs for a given metalic wire two different temperature T1 and T2 are shown in figure The temperature T2 is greater than T1. Is this statement true or false?
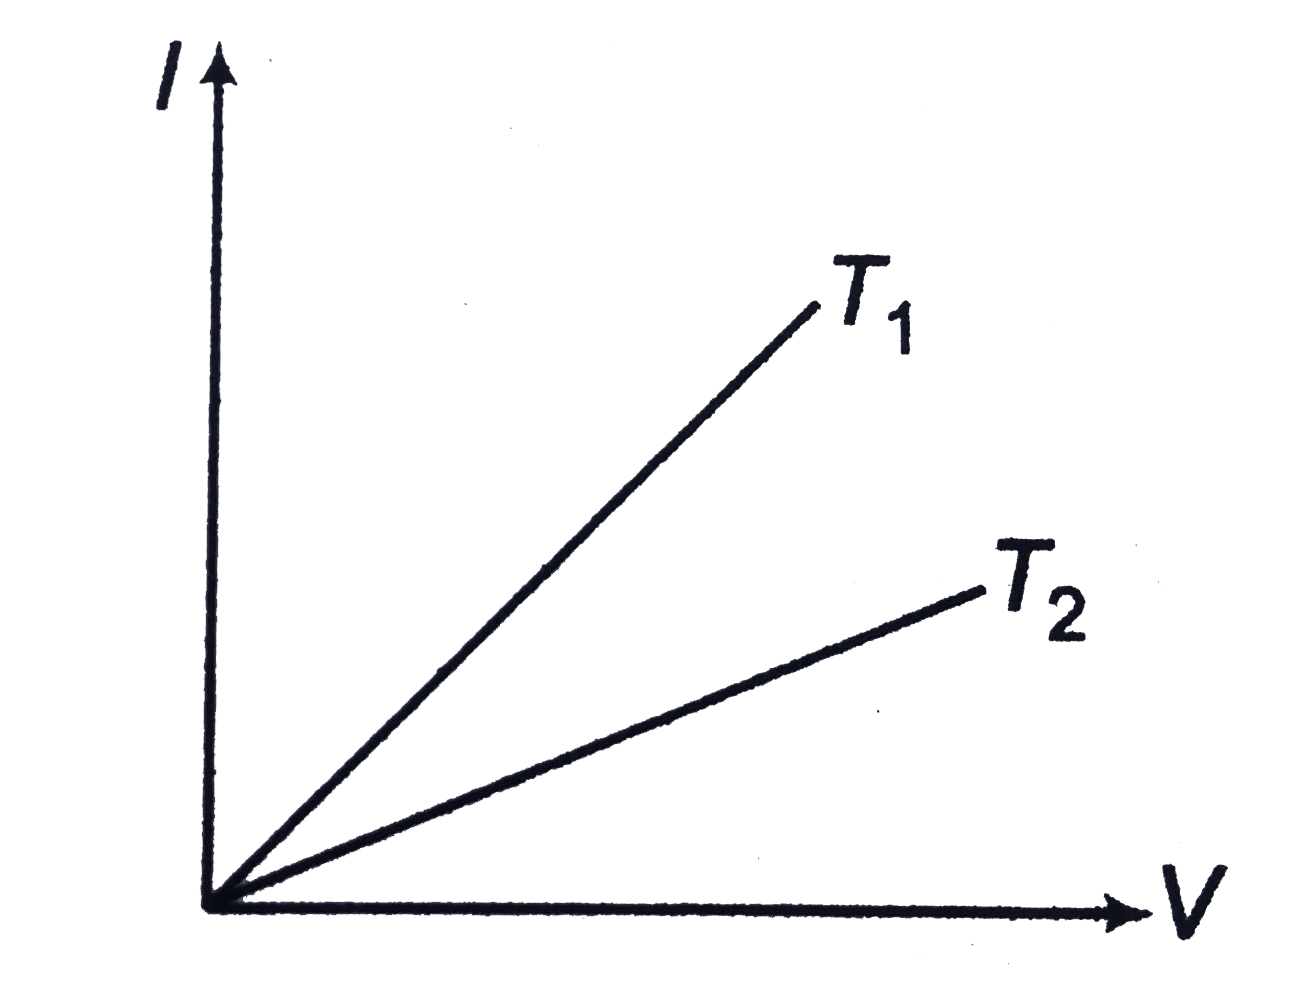
View SolutionThe current voltage graphs for a given metalic wire two different temperature T1 and T2 are shown in figure The temperature T2 is greater than T1. Is this statement true or false?

View SolutionI-V graph for a metallie wire at two different tempearture, T1andT2 is as shown in the figure. Which of the two temperatures is lower and why ?

View SolutionThe current in a metallic conductor is plotted against voltage at two different temperatures T1 and T2. Which is correct
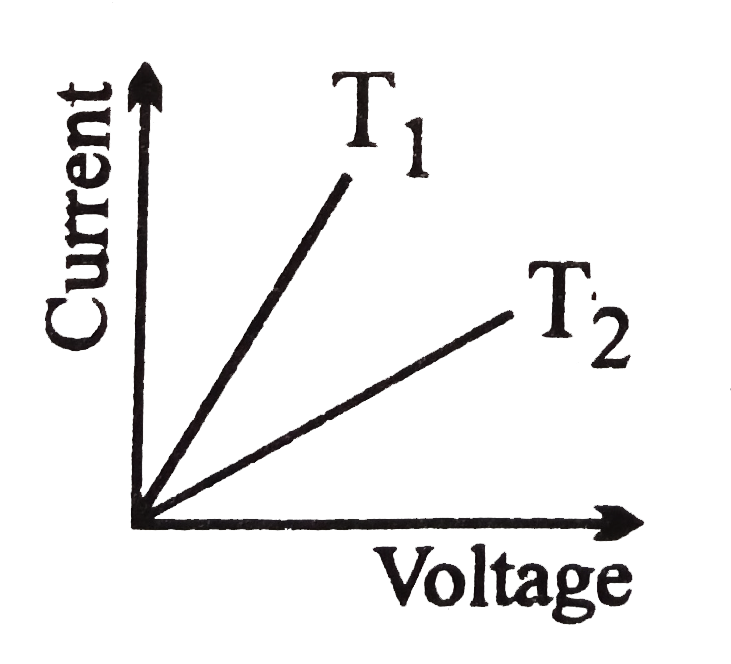
View SolutionThe current (I) and voltage (V) graphs for a given metallic wire at two different temperature (T1) and (T2) are shown in fig. It is concluded that
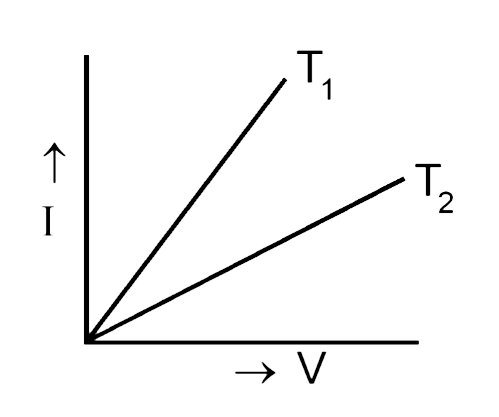
View SolutionAssertion : Current versus potential difference (i-V) graph for a conductor at two different temperatures T1 and T2 is shown in figure. Hence T1>T2.
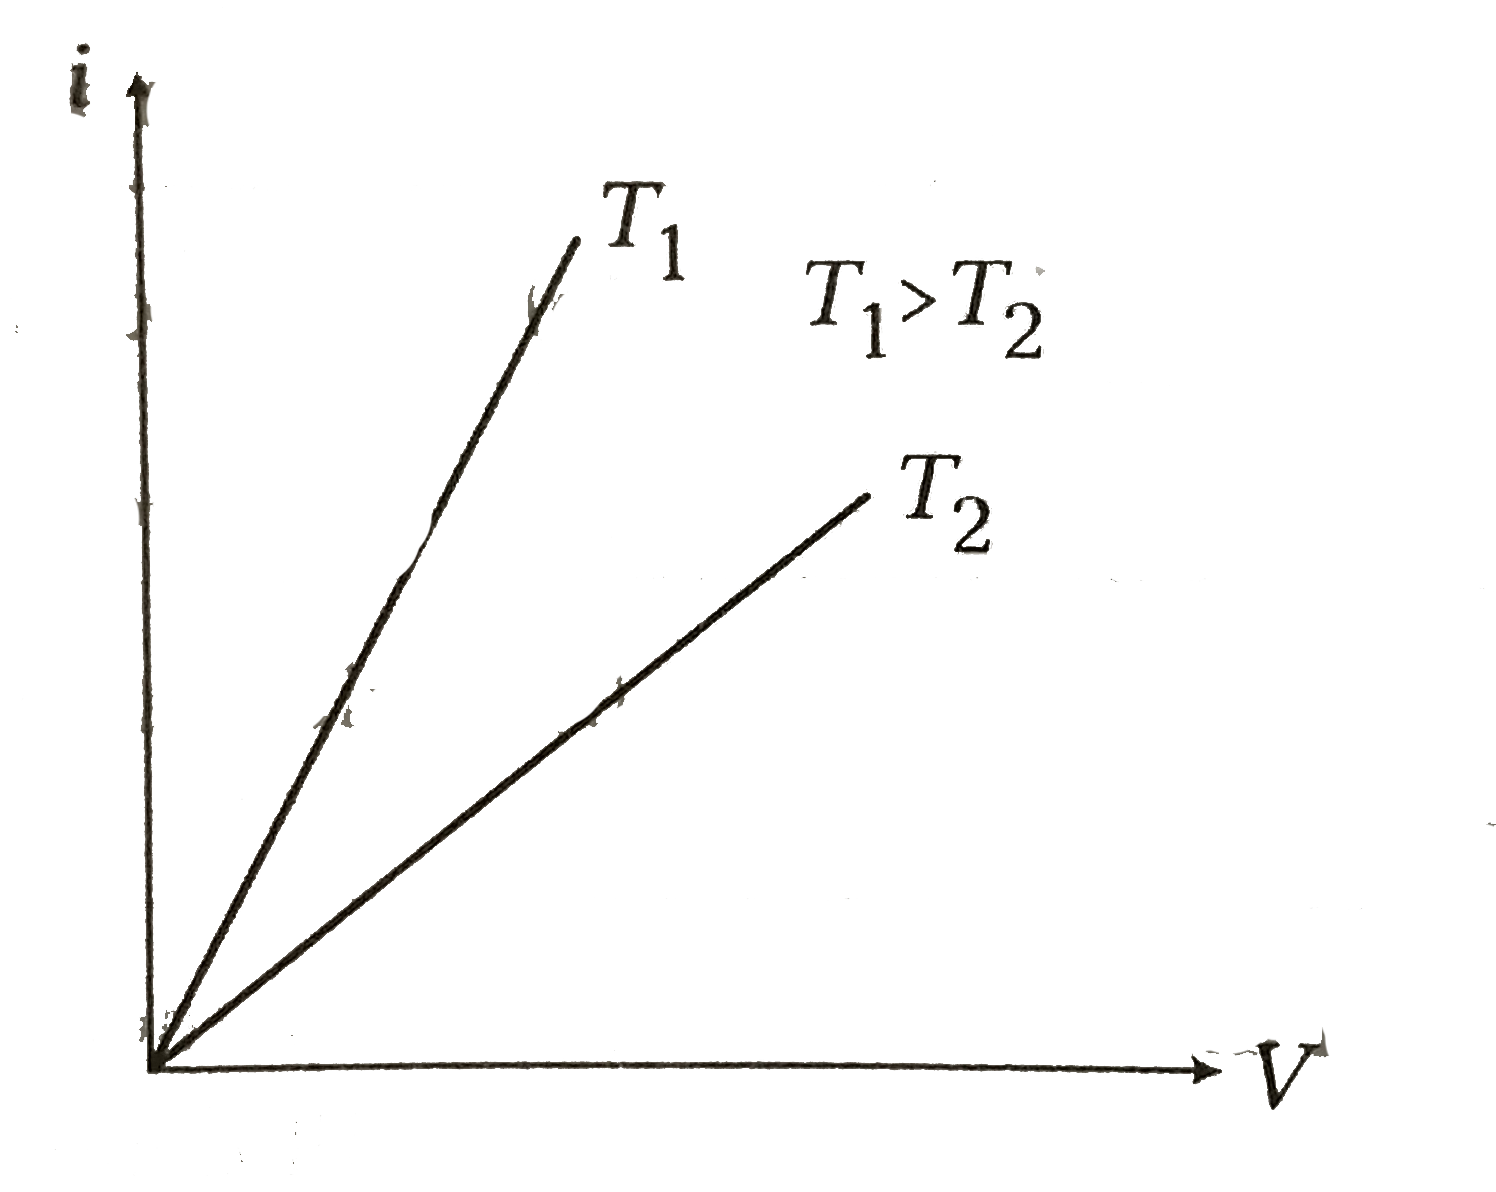
Reason : Resistance of a conductor increases with rise in temperature.
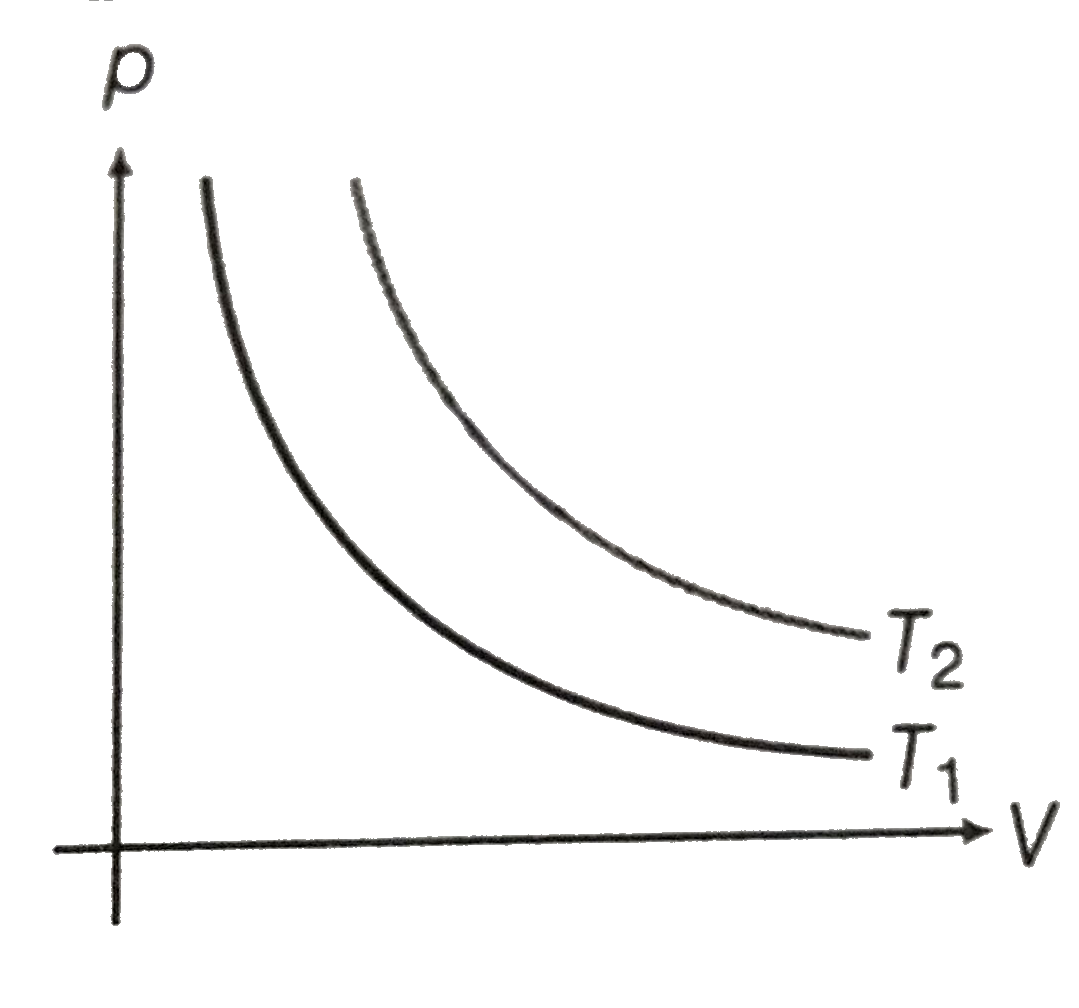
View SolutionThe p−V diagrams of same mass of a gas are drawn at two different temperatues T1 and T2 Explain whether T1>T2 or T2>T1.
View Solution
