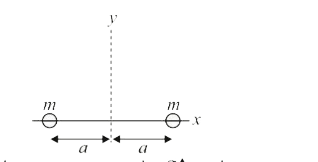
Two identical spherical balls, each of mass m, are placed as shown in figure. Plot the variation of g(gravitation intensity) along the x-axis due to both the masses.
In the minimum deviation position, r=A2=60∘2 for both the prisms. Since A=60∘ for both the prisms. For the first prism, μ1=1.50 and sini1=μ,sinr1=1.50,sin30∘=0.75

∴i1=48∘35'
For the second prism, μ2=1.68 and sini1=μ2sinr1'=1.68sin30∘=0.84
i'1=57∘9'
Let the angle between the bases of the prism be α.
α=360∘−(60∘+β+60∘)
But β+90∘−i1+90∘−i1=180∘
β=i1+i'1=48∘35∘+57∘9'=105∘44'
∴α=360∘−(120∘+105∘44')=134∘16'
(ii) In the minimum deviation position, i=A+δ2
δ=2i−A
For the first prism, δ1=2i1−A=2(48∘35')−60∘=37∘10'
For the second prism, δ2=2i1−A=2(57∘9')−60∘=54∘18'
Topper's Solved these Questions
- RAY OPTICS AND OPTICAL INSTRUMENTSBOOK - AAKASH INSTITUTE ENGLISHCHAPTER - RAY OPTICS AND OPTICAL INSTRUMENTSEXERCISE - Assignment (Section - A) Objective Type Questions (One option is correct)
38 Videos
- RAY OPTICS AND OPTICAL INSTRUMENTSBOOK - AAKASH INSTITUTE ENGLISHCHAPTER - RAY OPTICS AND OPTICAL INSTRUMENTSEXERCISE - Assignment (Section - B) Objective Type Questions (One option is correct)
15 Videos
- PHYSICAL WORLDBOOK - AAKASH INSTITUTE ENGLISHCHAPTER - PHYSICAL WORLDEXERCISE - ASSIGNMENT (Section-B)
4 Videos
- SEMICONDUCTOR ELECTRONICS (MATERIAL, DEVICES AND SIMPLE CIRUITS )BOOK - AAKASH INSTITUTE ENGLISHCHAPTER - SEMICONDUCTOR ELECTRONICS (MATERIAL, DEVICES AND SIMPLE CIRUITS )EXERCISE - Assignment SECTION - D (Assertion & reason type Question)
10 Videos
Similar Questions
Two identical bar magnets, each of magnetic moment M, are placed as shown in figure. Magnetic field at point
View SolutionTwo blocks each having a mass M are placed as shown in the figure. The accleration of the system is:-

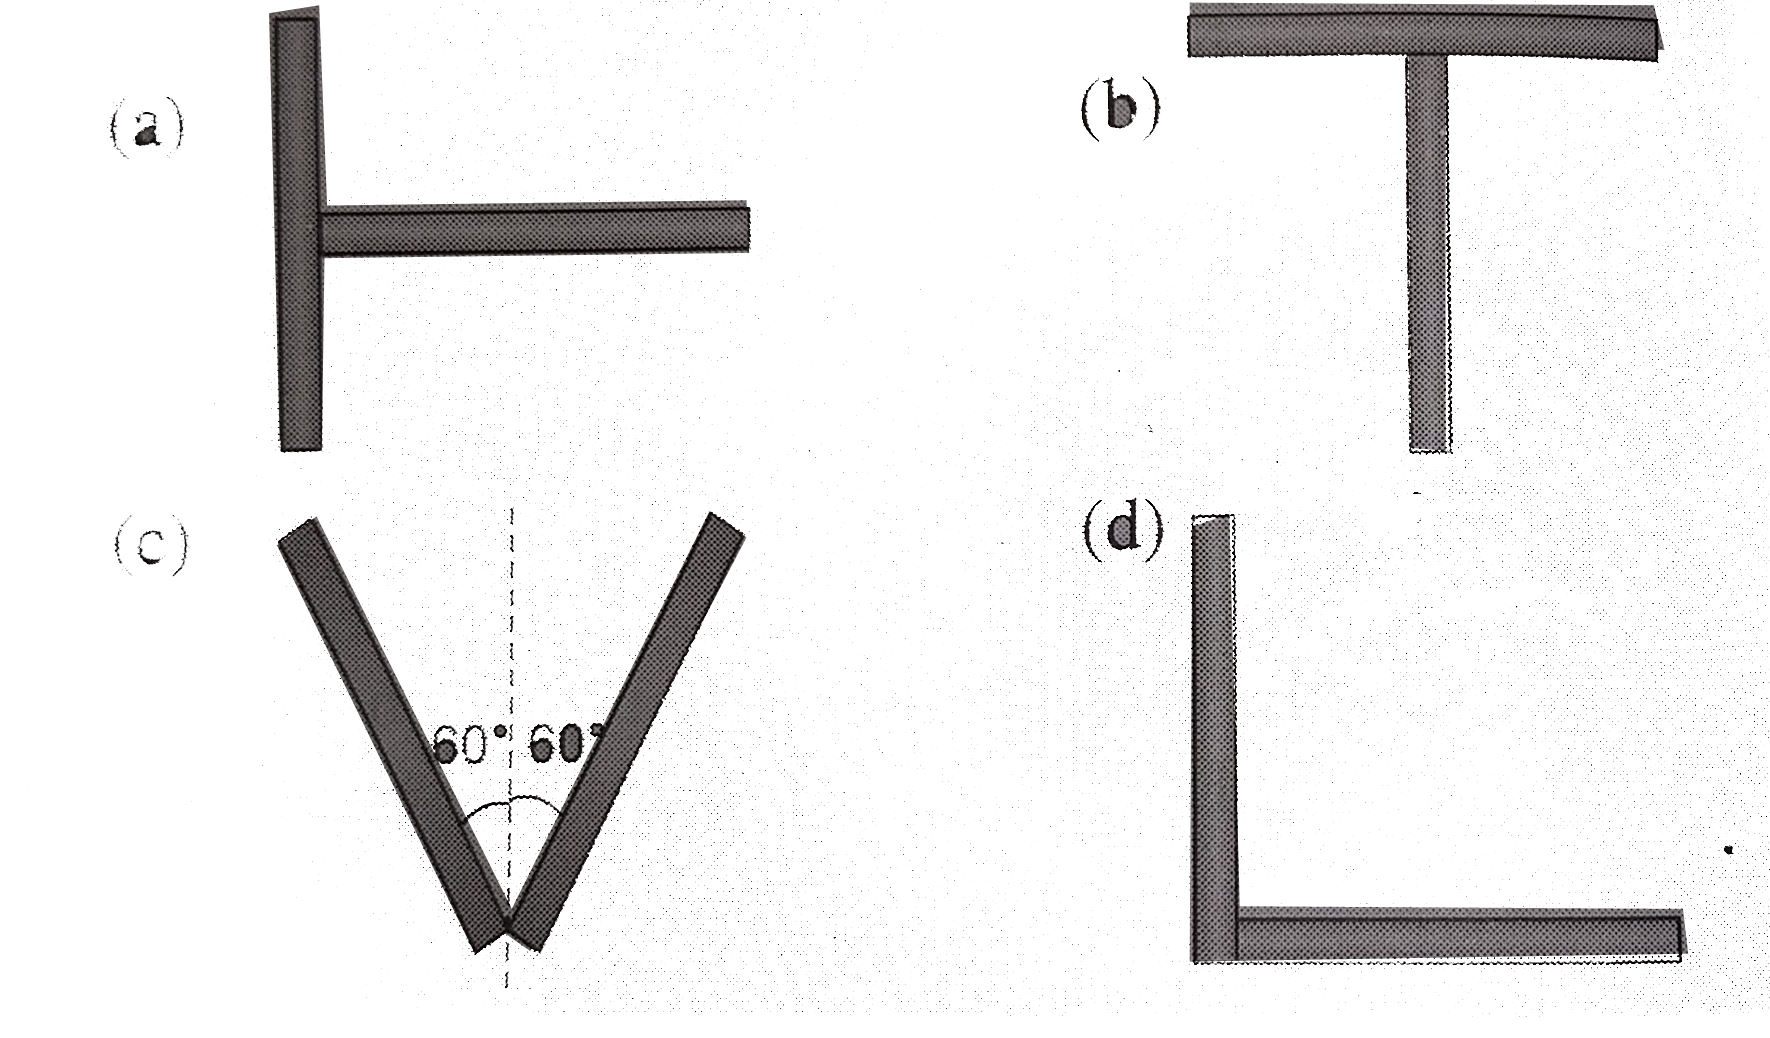
View SolutionTwo identical rods each of mass m and length are connected as shown. Locate c.m.
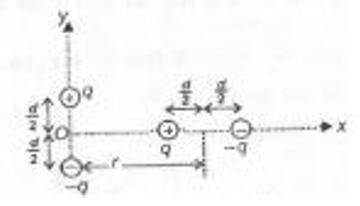
View SolutionTwo identical electric dipoles of dipole moments p are placed as shown in the figure. The electrostatic force on dipole placed along x-axis is (d << r) (14πε0 )
View SolutionTwo spherical balls of mass 10 kg each are placed 100 m apart. Find the gravitational force of attraction between them.
View SolutionTwo spherical balls of mass 10 kg each are placed 10 cm apart. Find the gravitational force of attraction between them.
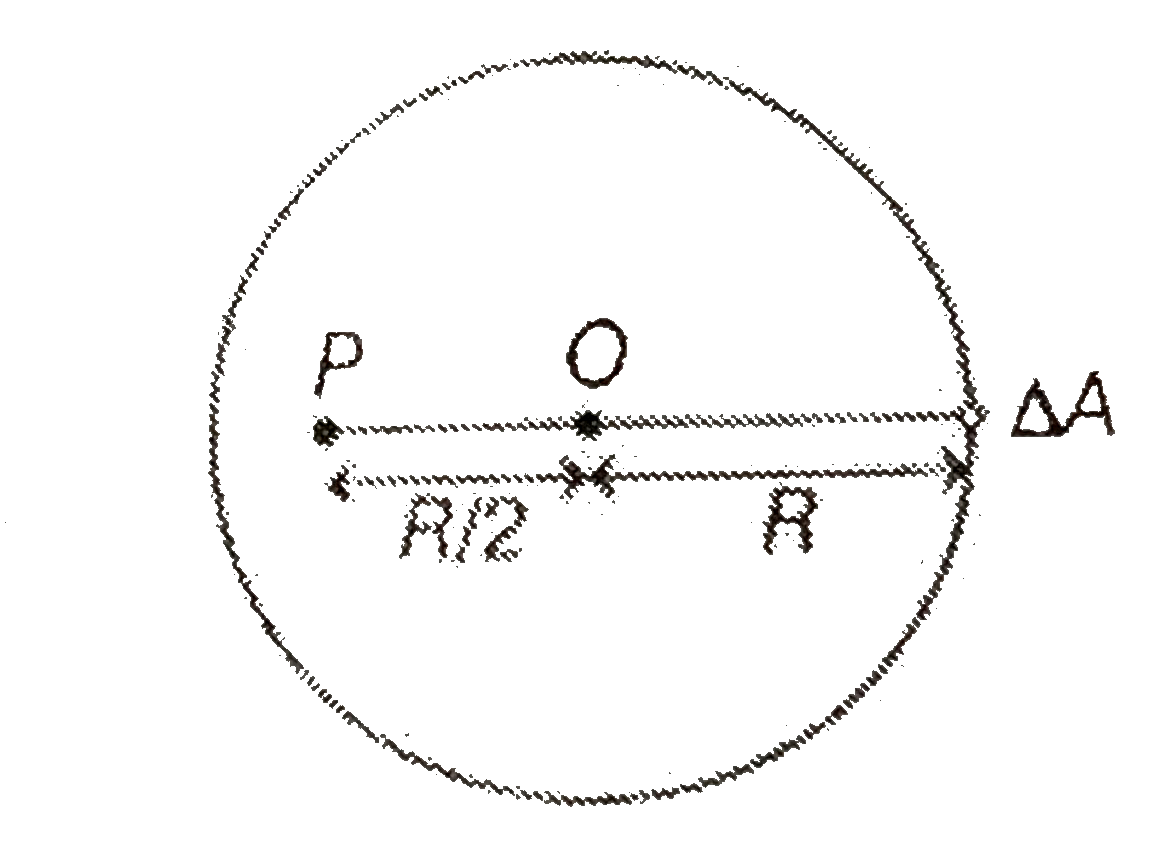
View SolutionA small section of area ΔA is removed from a uniform spherical shell with surface mass density σ and radius R as shown in the figure . Find the magnitude of gravitational field intensity at point P due to the remaining mass .
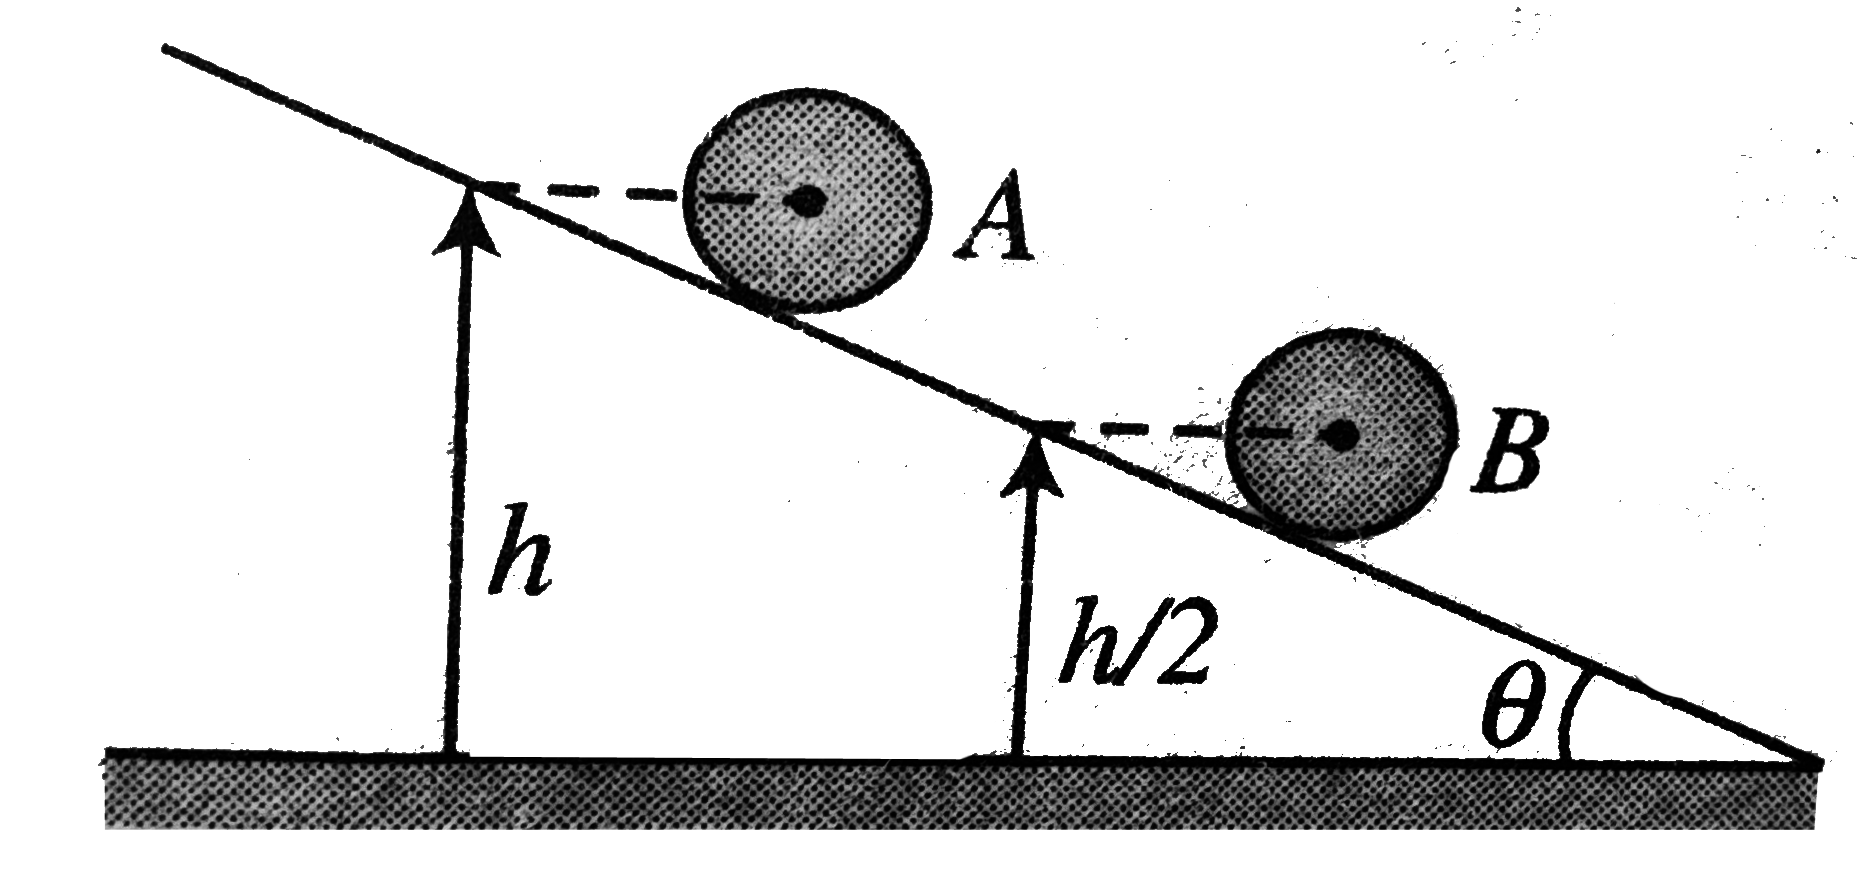
View SolutionTwo identical uniform solid spherical balls A and B of mass m each are placed on a the fixed wedge as shown in figure. Ball B is kept at rest and it is released just before two balls collides. Ball A rolls down without slipping on inclined plane and collide elastically with ball B. The kinetic energy of ball A just after the collision with ball B is:
View SolutionThree identical point objects each of mass m are placed at the vertices of an equilateral triange of side l. What is the gravitational potential at the centre of the equilateral triangle due to the point masses?
View SolutionThree mass points each of mass m are placed at the vertices of an equilateral triangle of side 1. What is the gravitational field and potential due to the three masses at the centroid of the triangle ?
View Solution
