Which of the following is the most appropriate to demonstrate the runs scored in the various ovens of a cricket match ?
time graph
bar graph
pie chart
line graph
The correct Answer is:B
To determine the most appropriate way to demonstrate the runs scored in various overs of a cricket match, we can analyze the types of graphs available and their suitability for this specific data.
1. Understanding the Data:
- In a cricket match, runs scored in different overs are discrete values. Each over has a specific number of runs scored, which does not necessarily follow a continuous trend.
2. Types of Graphs:
- Time Graph: Typically used for continuous data related to time, such as speed or distance over time. Not suitable for discrete data like runs scored in overs.
- Line Graph: Used to show trends over time. However, since the runs scored in each over do not follow a continuous increase or decrease, a line graph would misrepresent the data.
- Pie Chart: Useful for showing parts of a whole but not suitable for comparing discrete values across different categories (overs).
- Bar Graph: Ideal for comparing discrete data. Each bar can represent the runs scored in each over, allowing for easy comparison.
3. Choosing the Right Graph:
- Since the runs scored in each over are distinct values, the bar graph is the most appropriate choice. It allows for clear representation of the runs scored in each over without implying a continuous trend.
4. Conclusion:
- The bar graph is the best option to demonstrate the runs scored in various overs of a cricket match, as it effectively displays discrete data for easy comparison.
- In a cricket match, runs scored in different overs are discrete values. Each over has a specific number of runs scored, which does not necessarily follow a continuous trend.
- Time Graph: Typically used for continuous data related to time, such as speed or distance over time. Not suitable for discrete data like runs scored in overs.
- Line Graph: Used to show trends over time. However, since the runs scored in each over do not follow a continuous increase or decrease, a line graph would misrepresent the data.
- Pie Chart: Useful for showing parts of a whole but not suitable for comparing discrete values across different categories (overs).
- Bar Graph: Ideal for comparing discrete data. Each bar can represent the runs scored in each over, allowing for easy comparison.
- Since the runs scored in each over are distinct values, the bar graph is the most appropriate choice. It allows for clear representation of the runs scored in each over without implying a continuous trend.
- The bar graph is the best option to demonstrate the runs scored in various overs of a cricket match, as it effectively displays discrete data for easy comparison.
Topper's Solved these Questions
- MOTION AND TIMEBOOK - LAKHMIR SINGH & MANJIT KAURCHAPTER - MOTION AND TIMEEXERCISE - EXERCISE
108 Videos
- LIGHTBOOK - LAKHMIR SINGH & MANJIT KAURCHAPTER - LIGHTEXERCISE - EXERCISEE
130 Videos
- WINDS, STORMS AND CYCLONESBOOK - LAKHMIR SINGH & MANJIT KAURCHAPTER - WINDS, STORMS AND CYCLONESEXERCISE - EXERCISE
92 Videos
Similar Questions
Out of a line graph, a pie chart and a bar graph which one is the most suitable to show :
runs scored in various overs of a cricket match ?
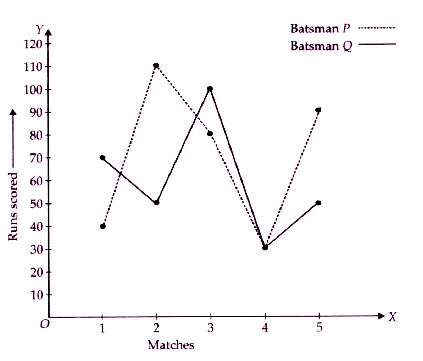
View SolutionPerformance based graph) The given graph shows the total runs scored by two batmans P and Q during each of the five different matches in the year 2011. study the graph and answer the following questions :
Were the run scored by them same in any match in 2011? if so, in which match? .

View Solution
Knowledge Check
Which of the following Cricketers has scored the highest total runs in test cricket?
AAllan BorderBBrian LaraCDonald BradmanDSachin TendulkarWhich of the following cricket players has surpassed Don Bradman as the record for the most runs scored as a captain in international cricket by more than 150 runs?
AVirat KohliBFaf du PlessisCJoe RootDKen WilliamsonWhich of the following cricketers surpassed Australia’s Don Bradman to create the record of scoring the most number of 150 plus scores as a captain in international cricket?
AKane WilliamsonBFaf du PlessisCJoe RootDVirat Kohli
What is the average run scored by the batsman man in the five matches?
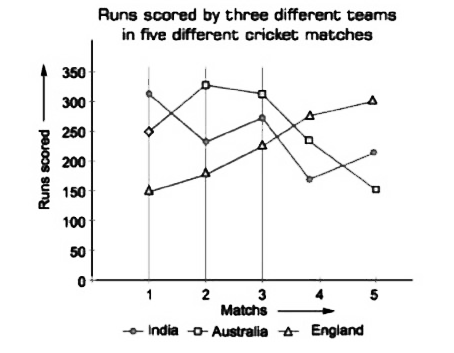
View SolutionStudy the following graph carefully and answer the questions that follow

Total runs scored by India and Ausralia in Match 4 together is approximately , what percentage of the total runs scored by England in all thefive matches together ?
View SolutionWho has scored the highest run in in a test cricket innings?
View SolutionApart from Virender Sehwag, which of the following Indian cricketers has the distinction of scoring triple centuries in Test matches?
View SolutionWho is the first Indian female cricketer to score 2000 runs in T20 International Cricket?
View Solution
