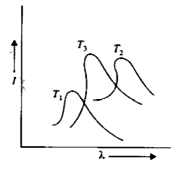
The plots of intensity versus wavelength fro three black bodies at temperatures T1,T2 and T3 respectively and shown in Fig. 15.11.1. Their temperatures are such that
T1>T2>T3
T1>T3>T2
T2>T3>T1
T3>T2>T1
The correct Answer is:B
According to Wien's law, λT= constant. From the graph
λ1<λ3<λ2
∴T1>T3>T2.
Topper's Solved these Questions
- ARCHIVES 1 VOLUME 6Book:CENGAGE PHYSICS ENGLISHChapter:ARCHIVES 1 VOLUME 6Exercise:Multi Correct
Explore 13 Videos
- ARCHIVES 1 VOLUME 6Book:CENGAGE PHYSICS ENGLISHChapter:ARCHIVES 1 VOLUME 6Exercise:Assertion-Reasoning
Explore 1 Video
- ARCHIVES 1 VOLUME 6Book:CENGAGE PHYSICS ENGLISHChapter:ARCHIVES 1 VOLUME 6Exercise:True/False
Explore 7 Videos
- ARCHIVES 2 VOLUME 6Book:CENGAGE PHYSICS ENGLISHChapter:ARCHIVES 2 VOLUME 6Exercise:Integer
Explore 4 Videos
Similar Questions
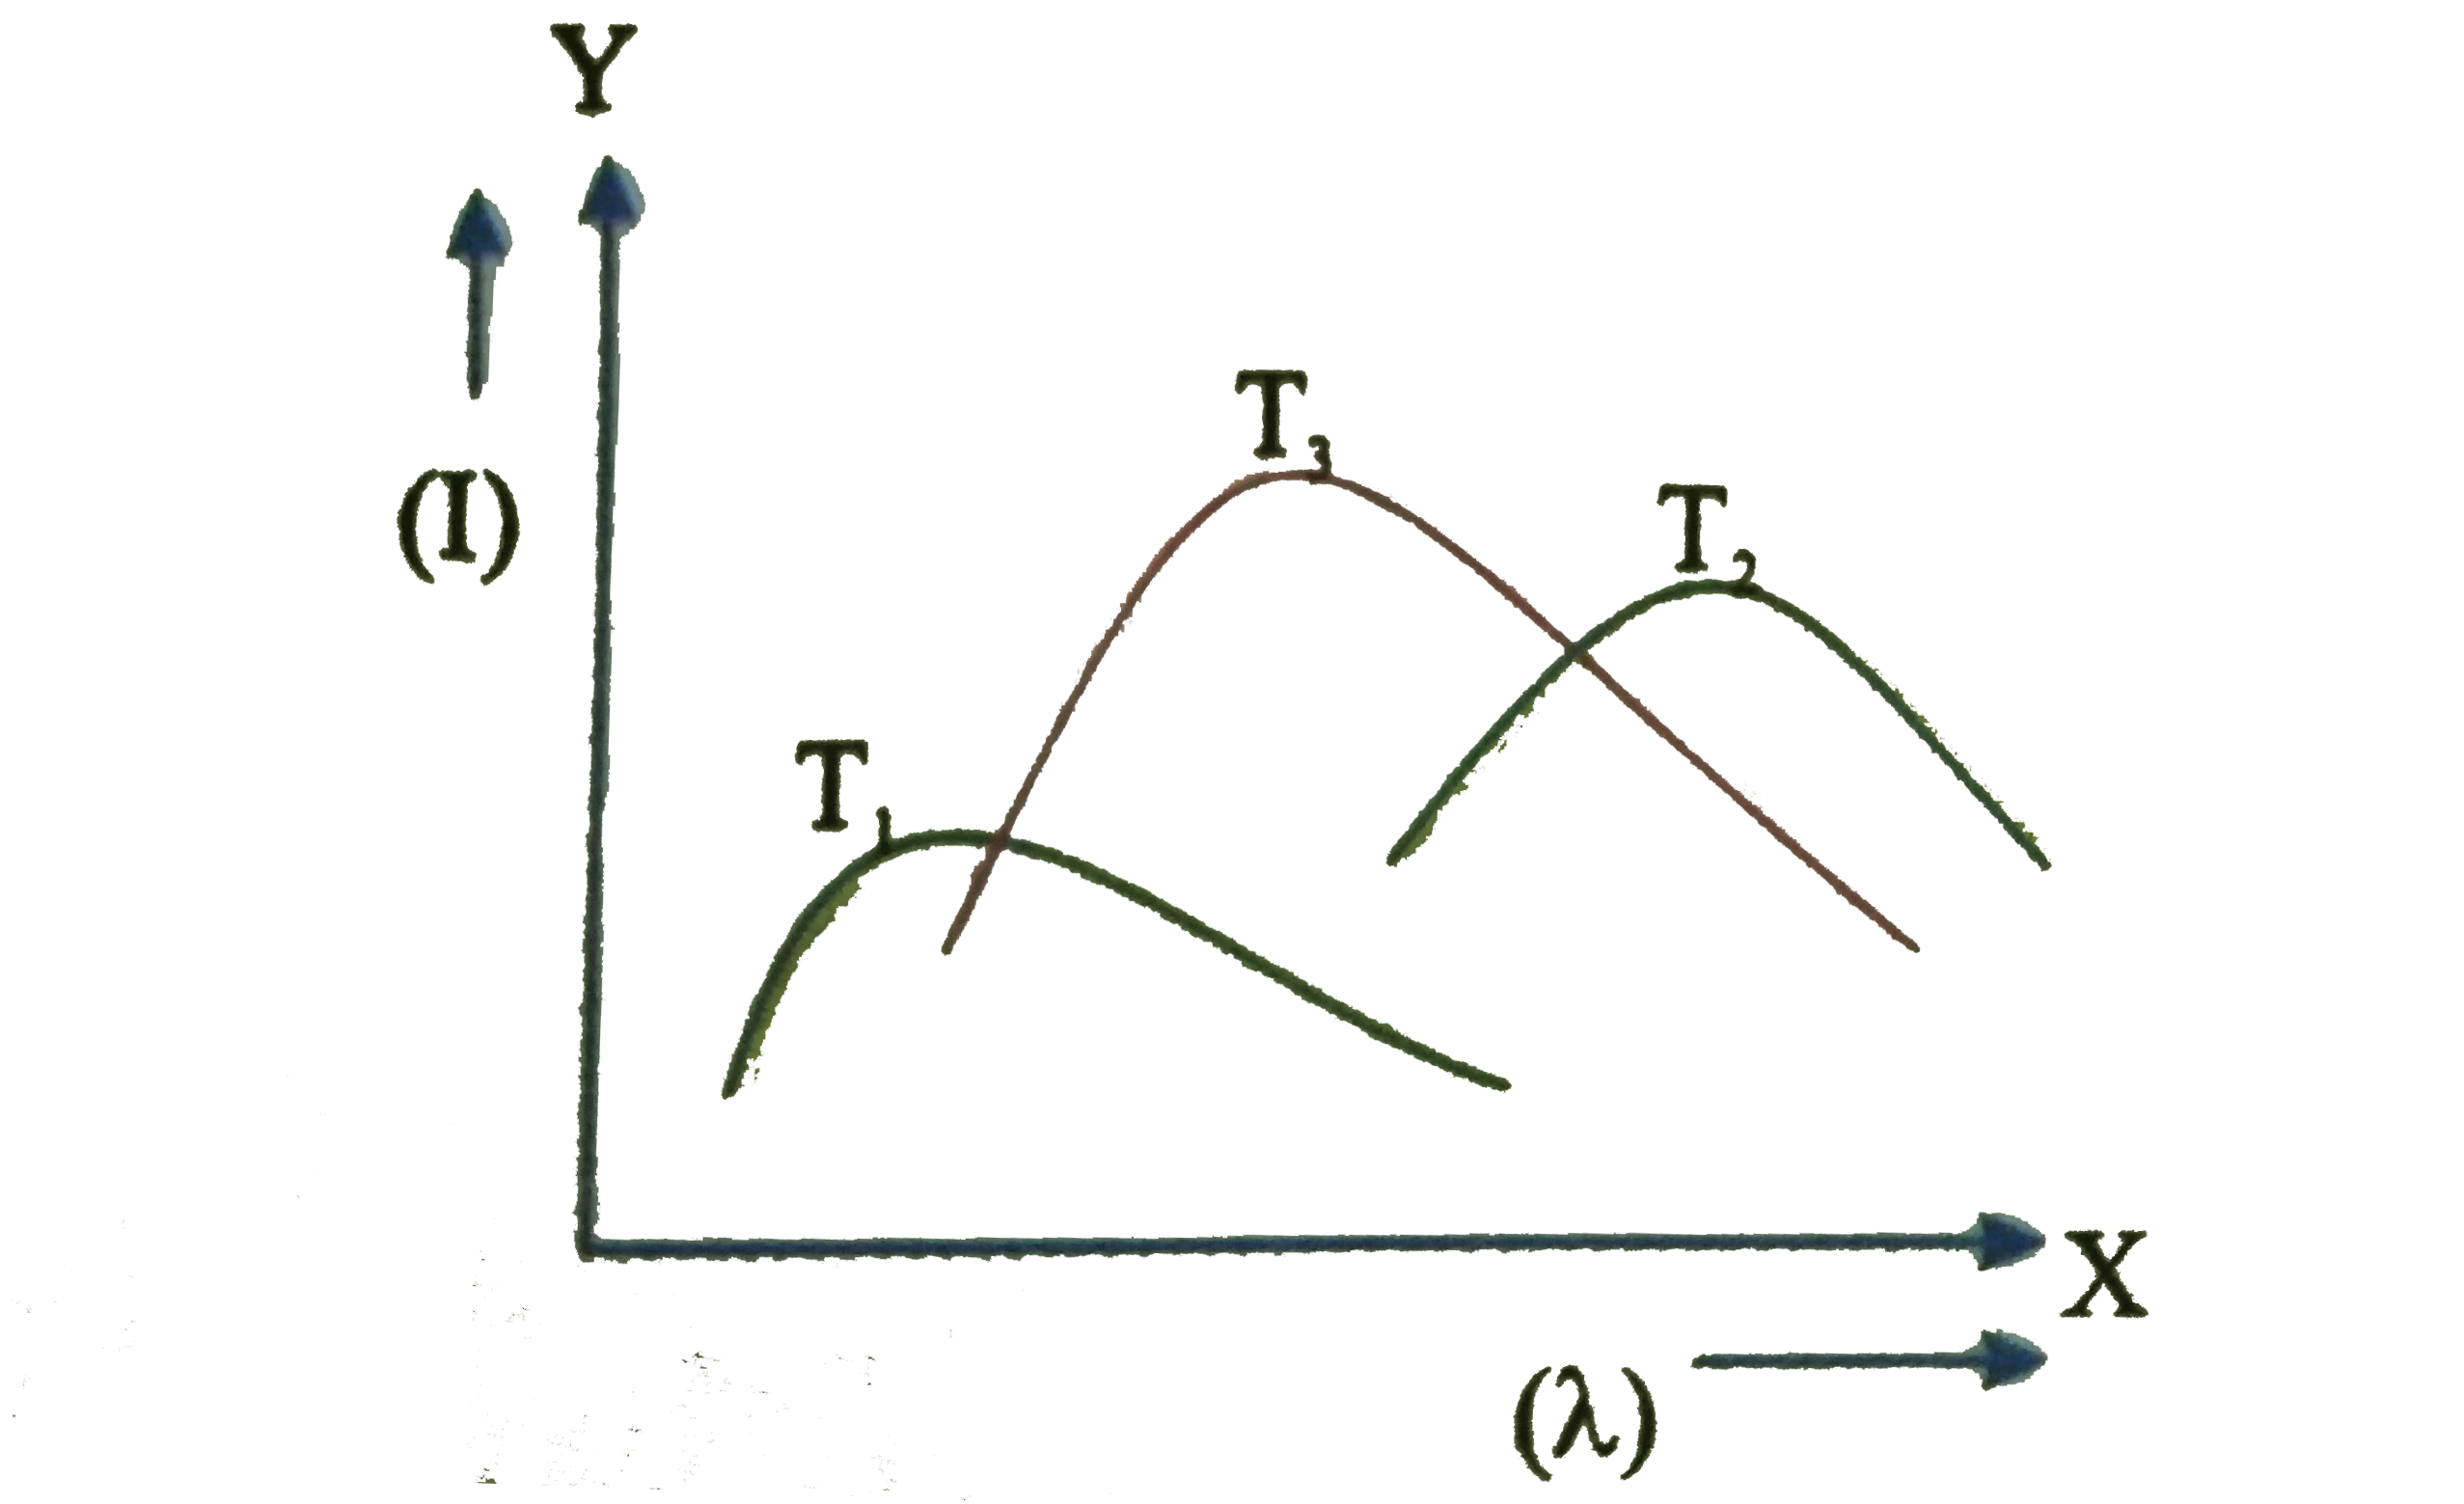
The plots of intensity versus wavelength for three black bodies at temperatures T1,T2 and T3 respectively are shown in Their temperatures are shown in How their temperatures are related ?
 .
.
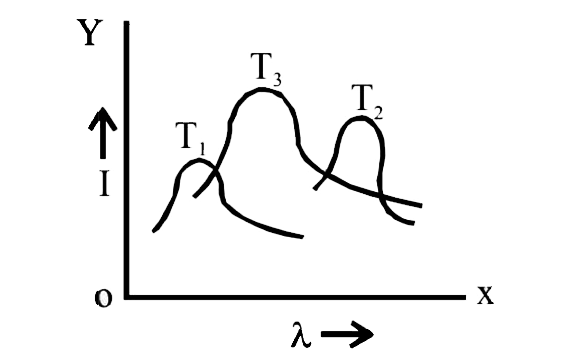
View SolutionThe plots of intensity versus wavelength for three black bodies at temperature T1,T2andT3 respectively are as shown. Their temperatures are such that
View Solution
Knowledge Check
The isothermal diagram of a gas at three different temperatures T1,T2andT3, is show in the given figure .Then
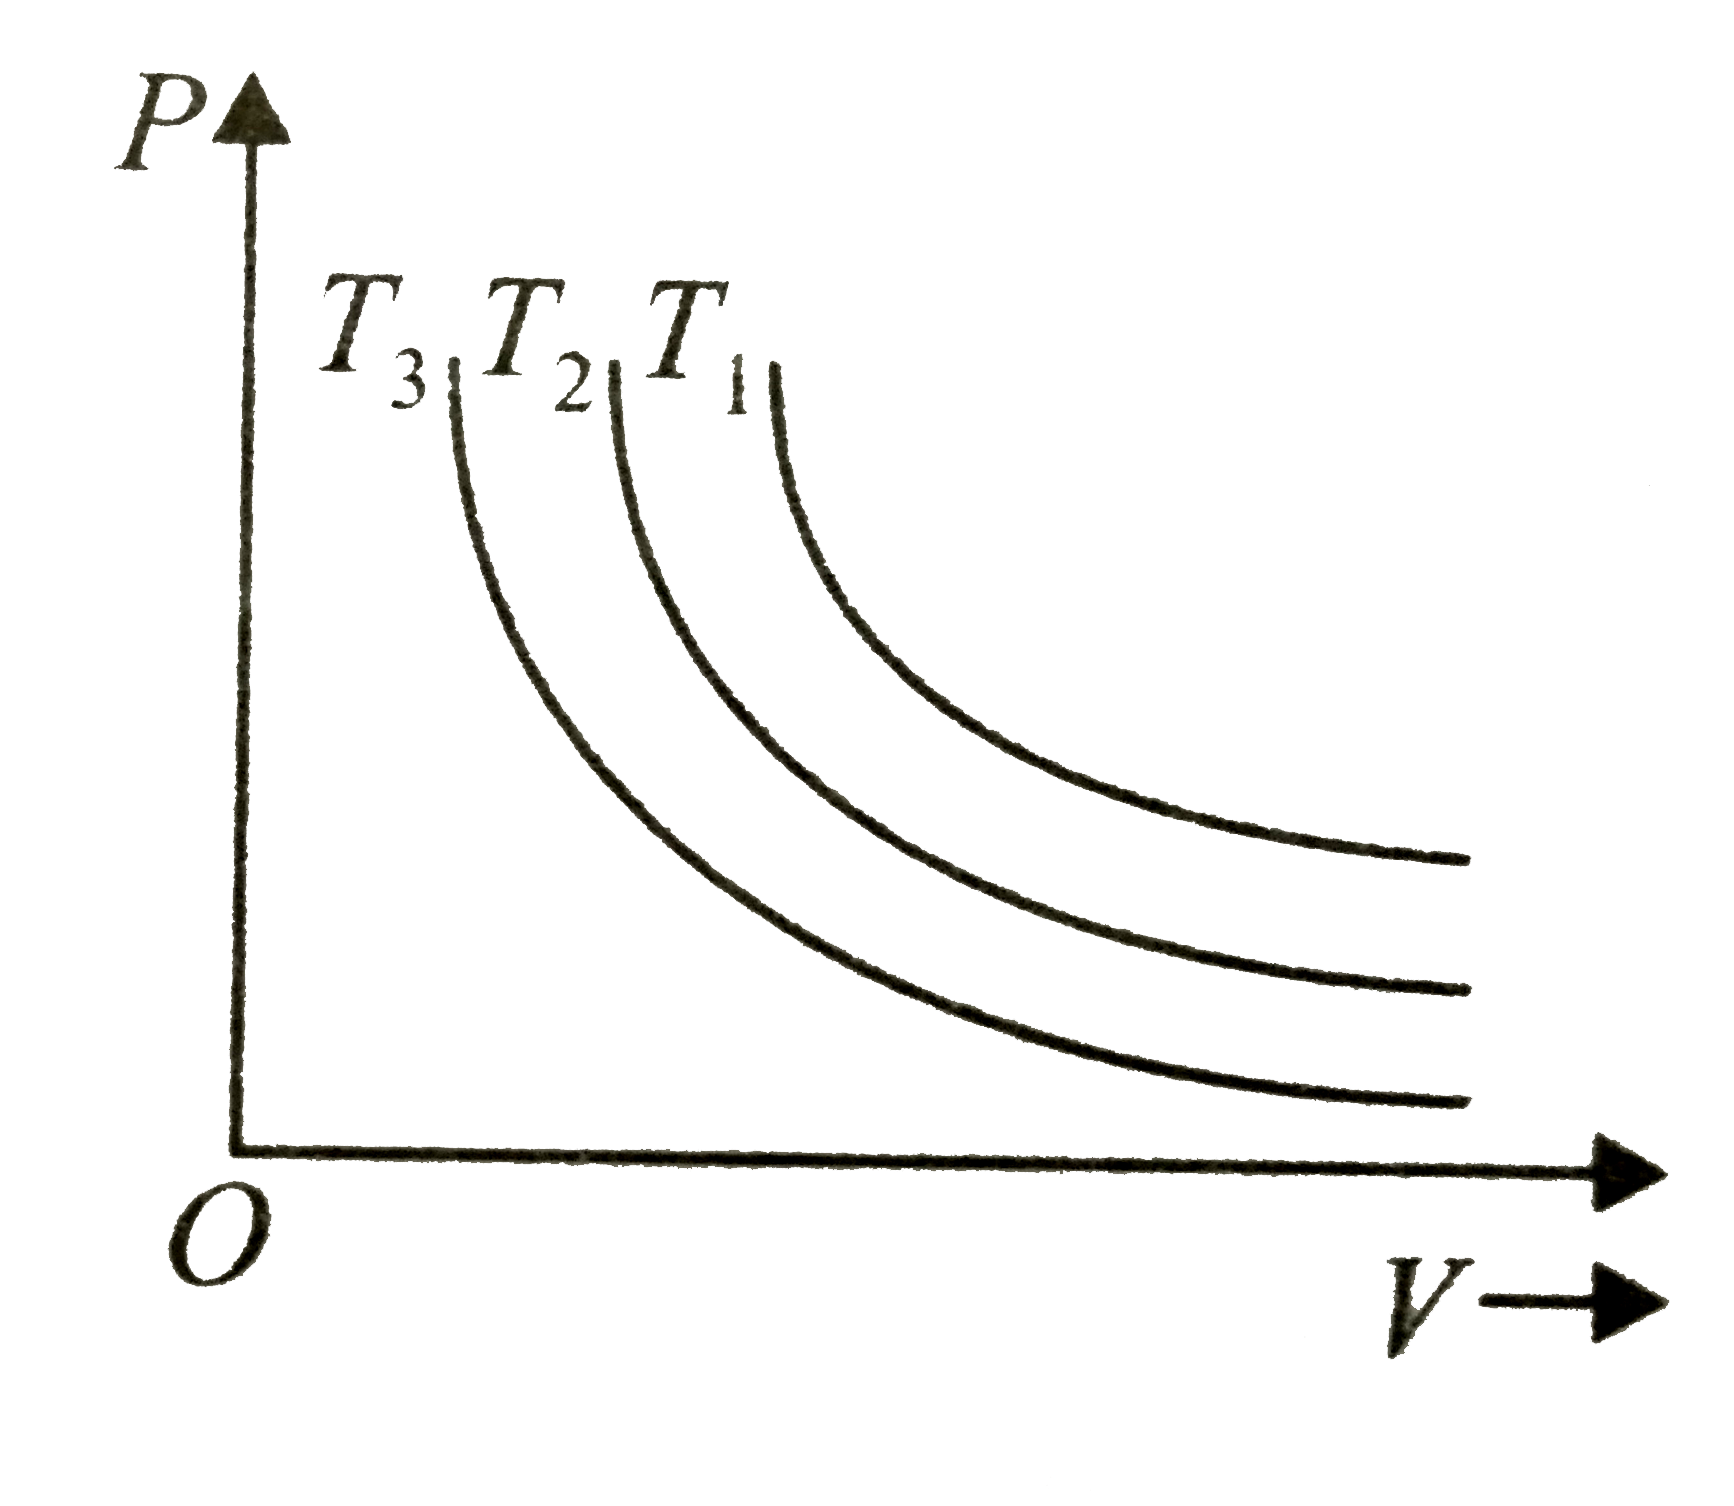 Aa.T1<T2<TBb. T1<T2>T3Cc.T1>T2>T3Dd.T1>T2<T3
Assertion : Current versus potential difference (i-V) graph for a conductor at two different temperatures T1 and T2 is shown in figure. Hence T1>T2.
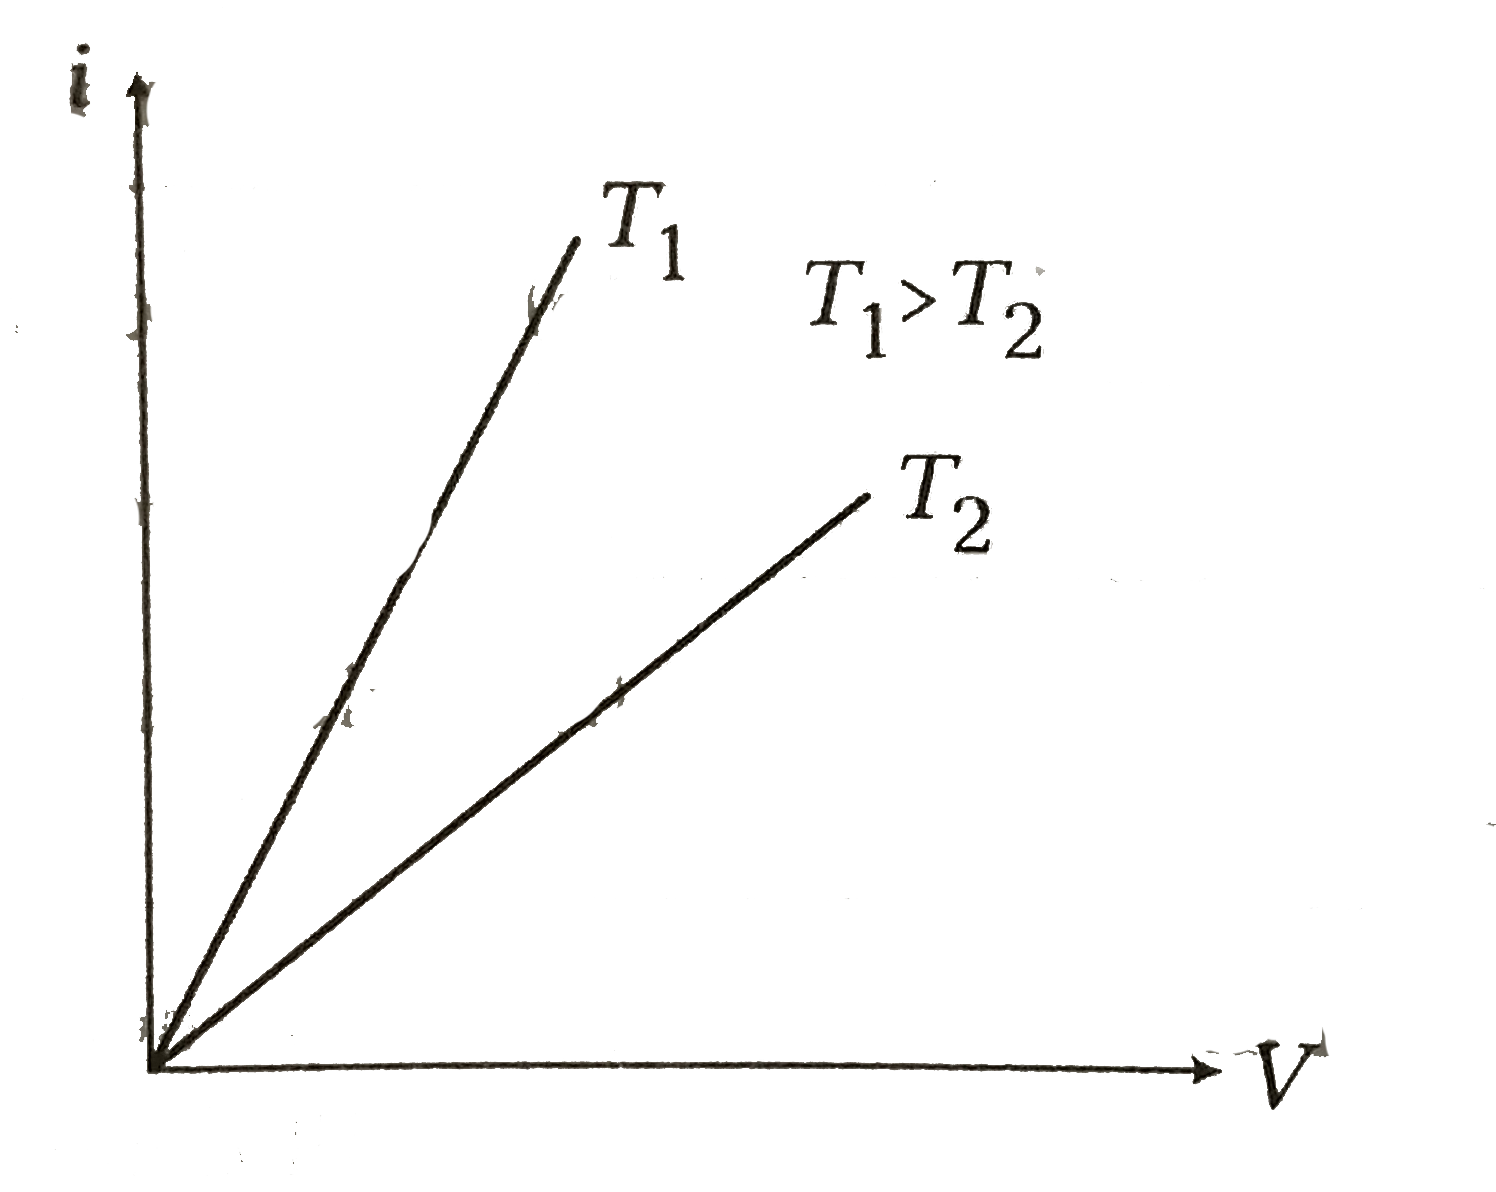
Reason : Resistance of a conductor increases with rise in temperature.Acos2θBsin2θCcot2θDtan2θ
Three isothermal plots (P versus V) A, B and C are plotted at three temperature T1,T2andT3 respectively
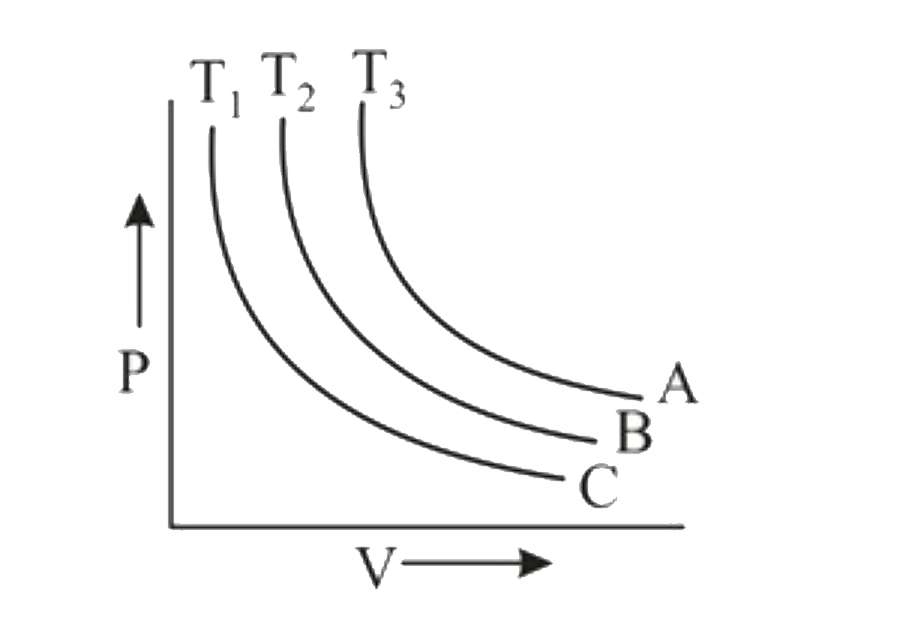
The correct order of the temperature will be
View SolutionFigure shows graphs of pressure versus density for an ideal gas at two temperatures T1 and T2 Which is correct ?
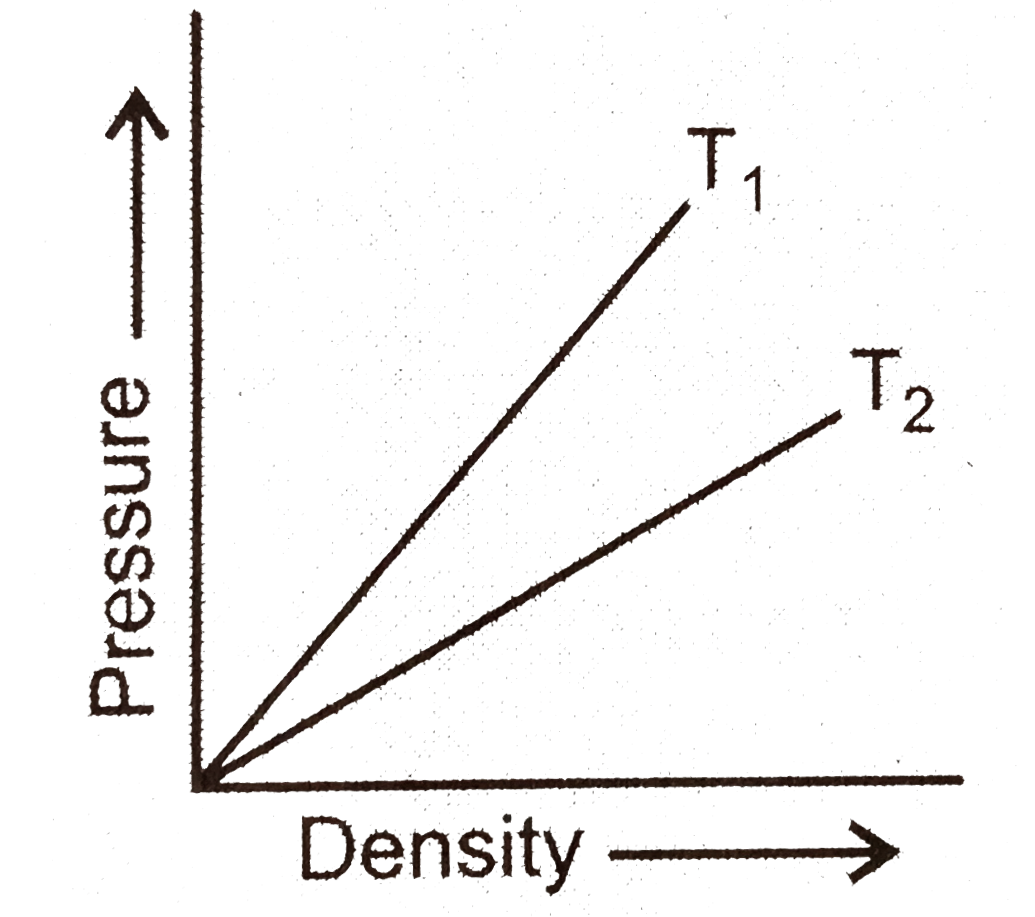 .
.
View SolutionThe plot of In k versus 1T is liner with slope of
View Solutionx1andx2 are susceptibility of a Paramagnetic material at temperatures T1,KandT2K respectively, then
View SolutionFour thin identical rods AB,AC,BD and EF made of the same material are joined as shown. The free-ends C,D and F are maintained at temperature T1,T2 and T3 respectively. Assuming that there is no loss of heat of the surroundings, the temperature at joint E when the steady state is attained is 1K(2T1+2T2+3T3). Find K(E is mid point of AB)

View SolutionFour identical rods AB, CD, CF and DE are joined as shown in figure. The length, cross-sectional area and thermal conductivity of each rod are l, A and K respectively. The ends A, E and F are maintained at temperature T1 , T2 and T3 respectively. Assuming no loss of heat to the atmosphere, find the temperature at B.

View Solution
