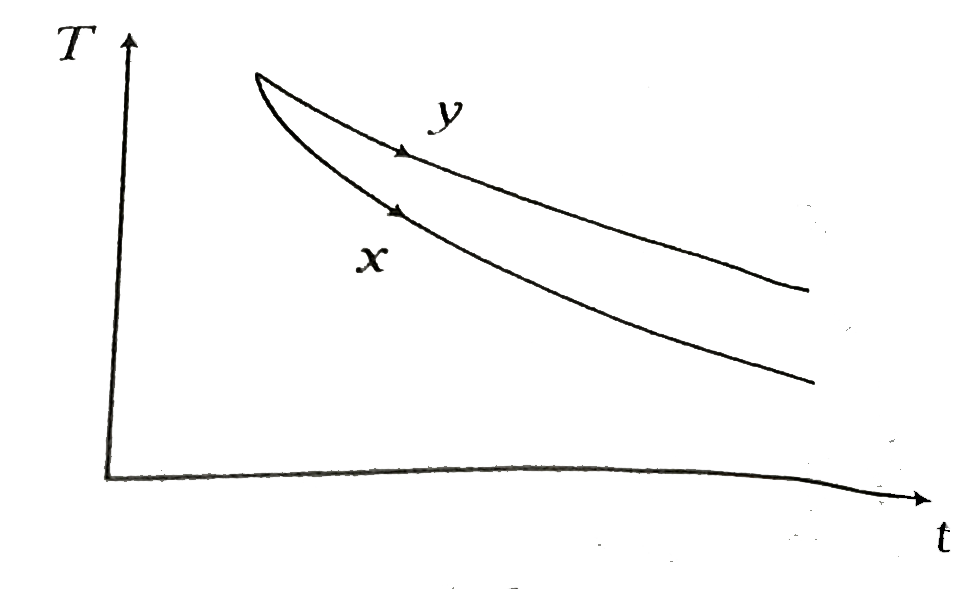
The graph, shown in the adjacement diagram, represents the variation of temperature (T) of two bodies, x and y having same surface area, with time (t) due to the emissions of radiation. Find the correct relation b etween the emissivity (e) and absorpitivity (a) of two bodies
Ex>Ey and ax<ay
Ex<Ey and ax>ay
Ex>Ey and ax>ay
Ex<Ey and ax<ay
The correct Answer is:C
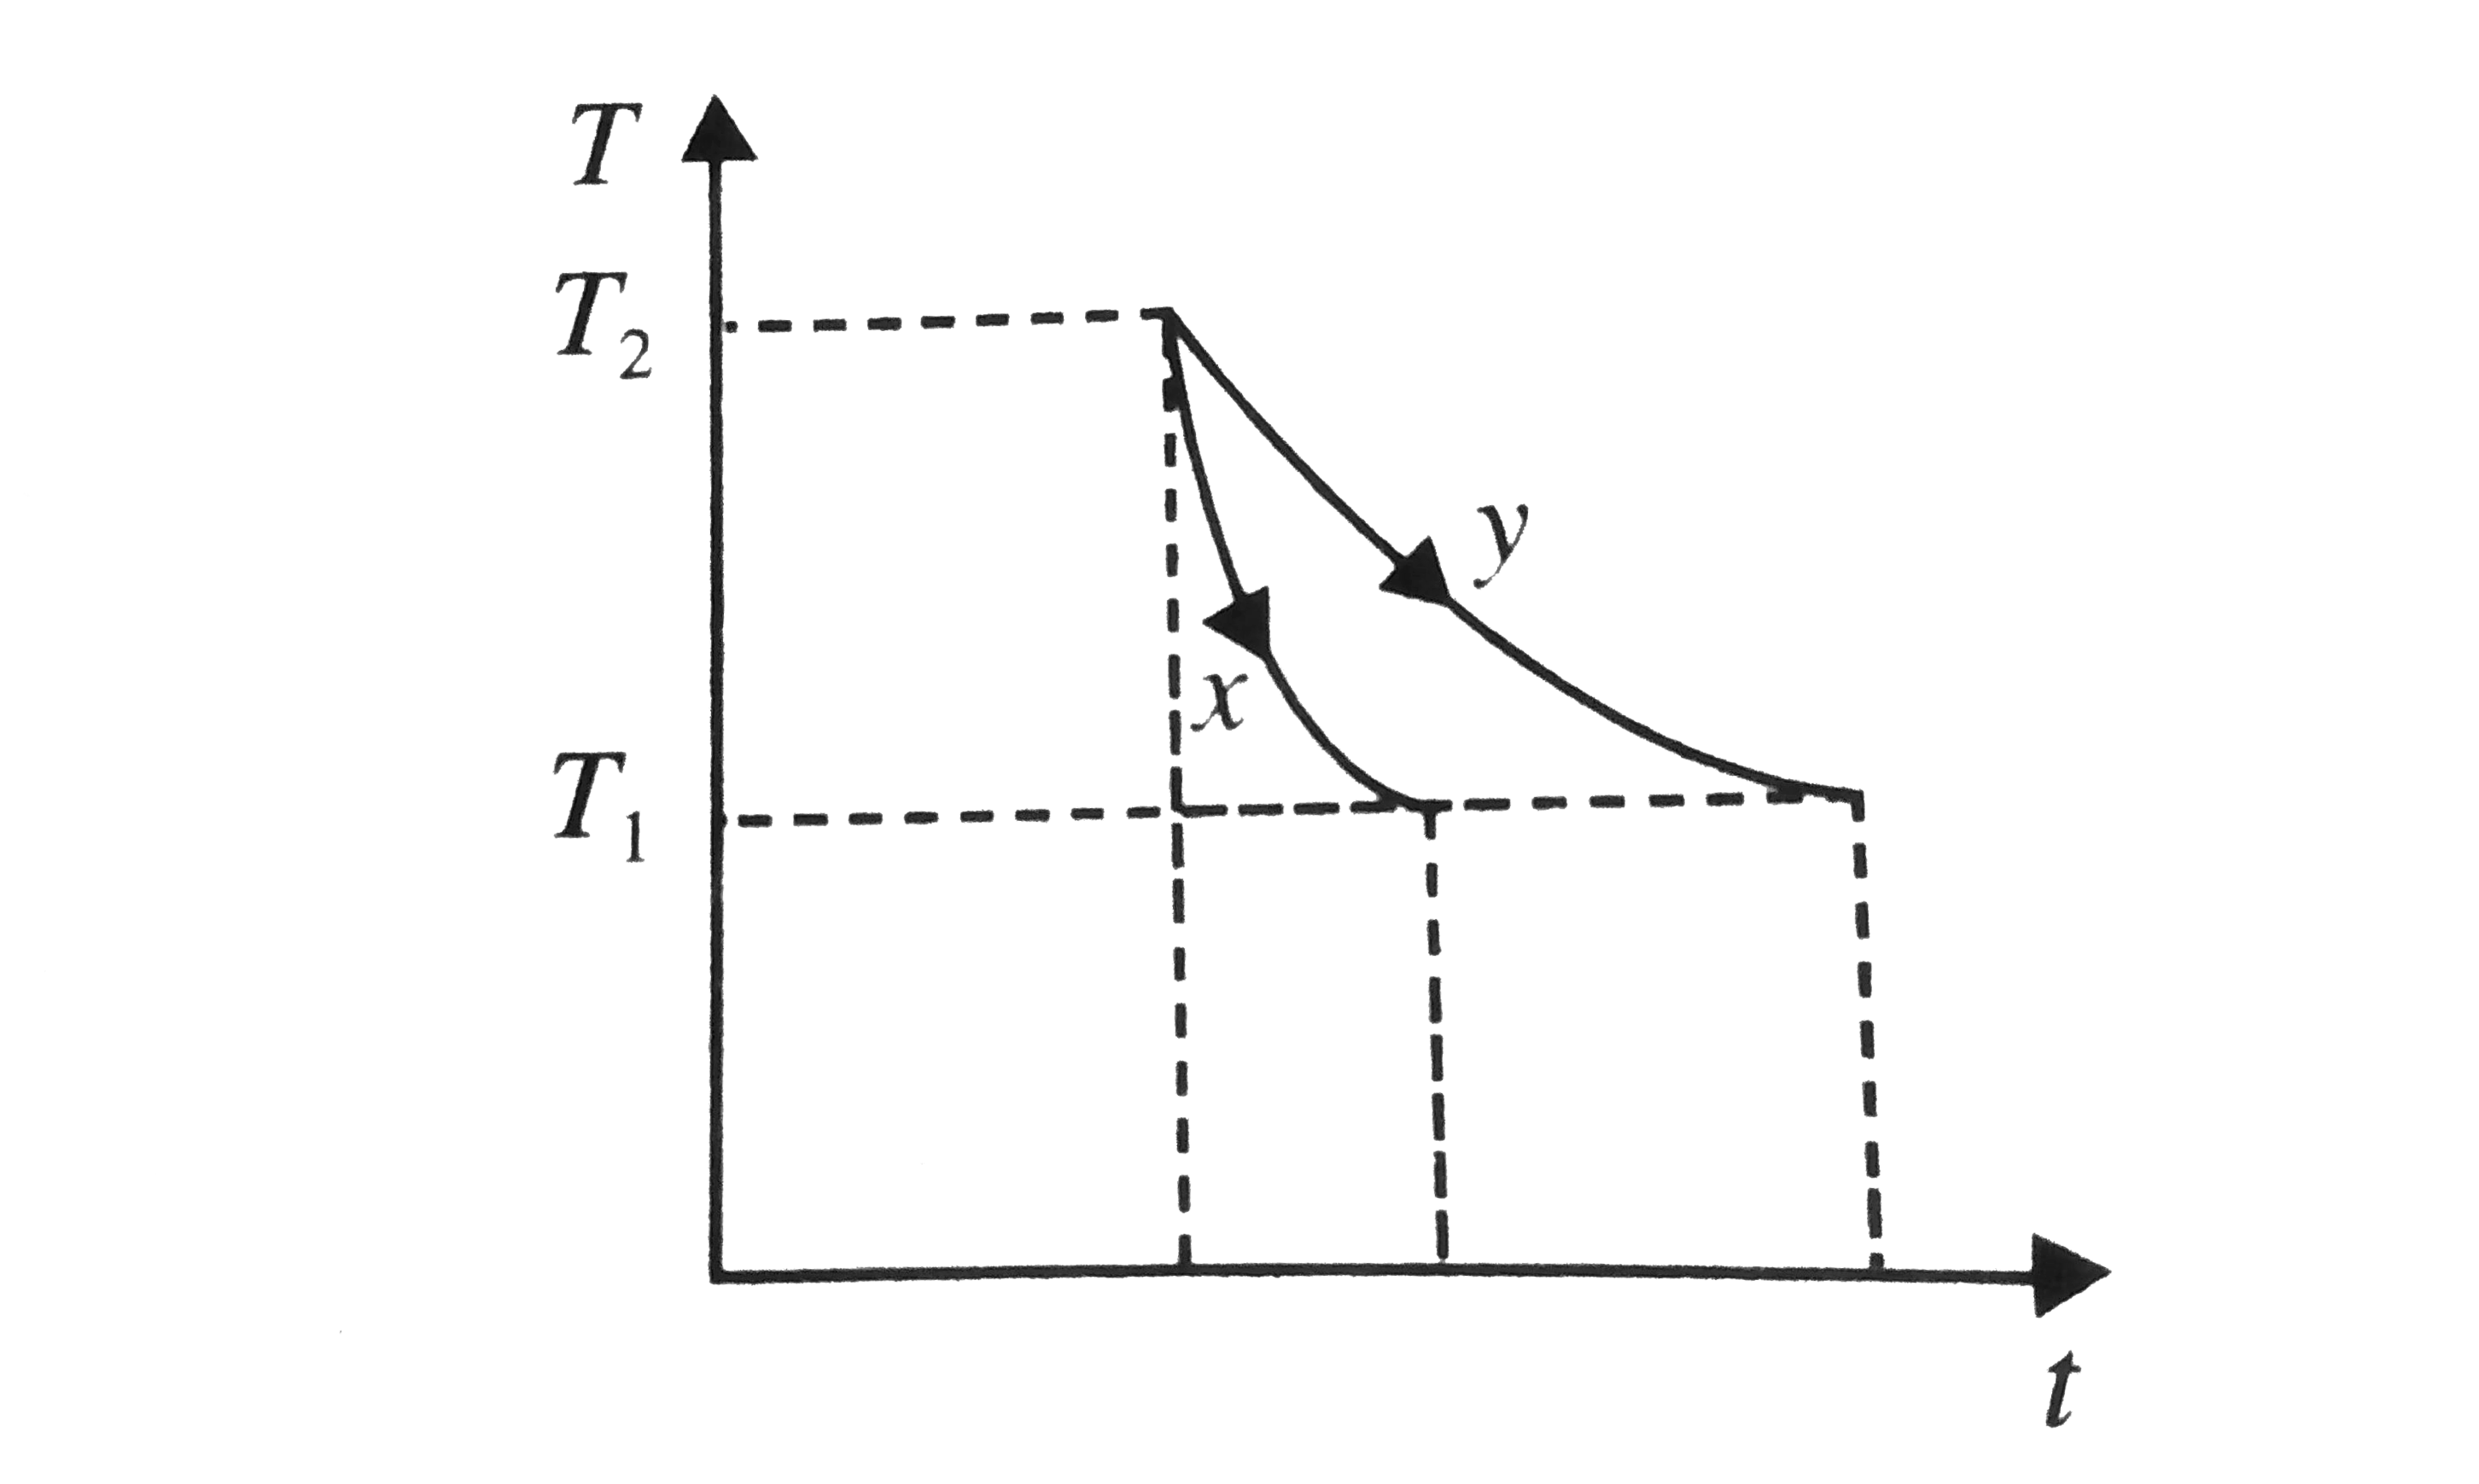
The graph shows that for the same temperature difference (T2−T1) , less time is taken for x . This means the emissivity is more for x . According to Kirchhoff's law, a good emitter is a good absorber as well.
Topper's Solved these Questions
- ARCHIVES 1 VOLUME 6BOOK - CENGAGE PHYSICS ENGLISHCHAPTER - ARCHIVES 1 VOLUME 6EXERCISE - Multi Correct
13 Videos
- ARCHIVES 1 VOLUME 6BOOK - CENGAGE PHYSICS ENGLISHCHAPTER - ARCHIVES 1 VOLUME 6EXERCISE - Assertion-Reasoning
1 Video
- ARCHIVES 1 VOLUME 6BOOK - CENGAGE PHYSICS ENGLISHCHAPTER - ARCHIVES 1 VOLUME 6EXERCISE - True/False
7 Videos
- ARCHIVES 2 VOLUME 6BOOK - CENGAGE PHYSICS ENGLISHCHAPTER - ARCHIVES 2 VOLUME 6EXERCISE - Integer
4 Videos
Similar Questions
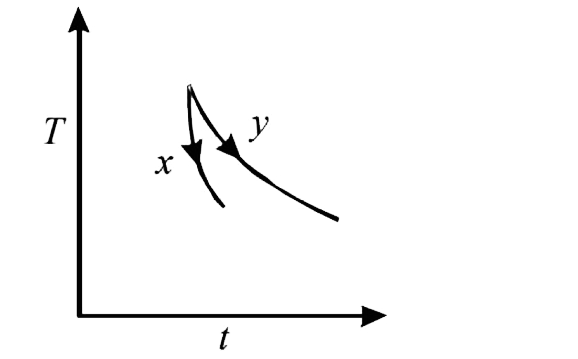
The graph, shown in the adjacent diagram, represents the variation of temperature (T) of two bodies, x and y having same surface area, with time (t) due to the emission of radiation. Find the correct relation between the emissivity and absorptivity power of the two bodies
View SolutionTwo bodies A and B having equal surface areas are maintained at temperatures 10∘C . And 20∘C . The thermal radiation emitted in a given time by A and B are in the ratio
View SolutionHeat energy at constant rate is given to two substances P and Q. If variation of temperature (T) of substances with time (t) is as shown in figure, then select the correct statement
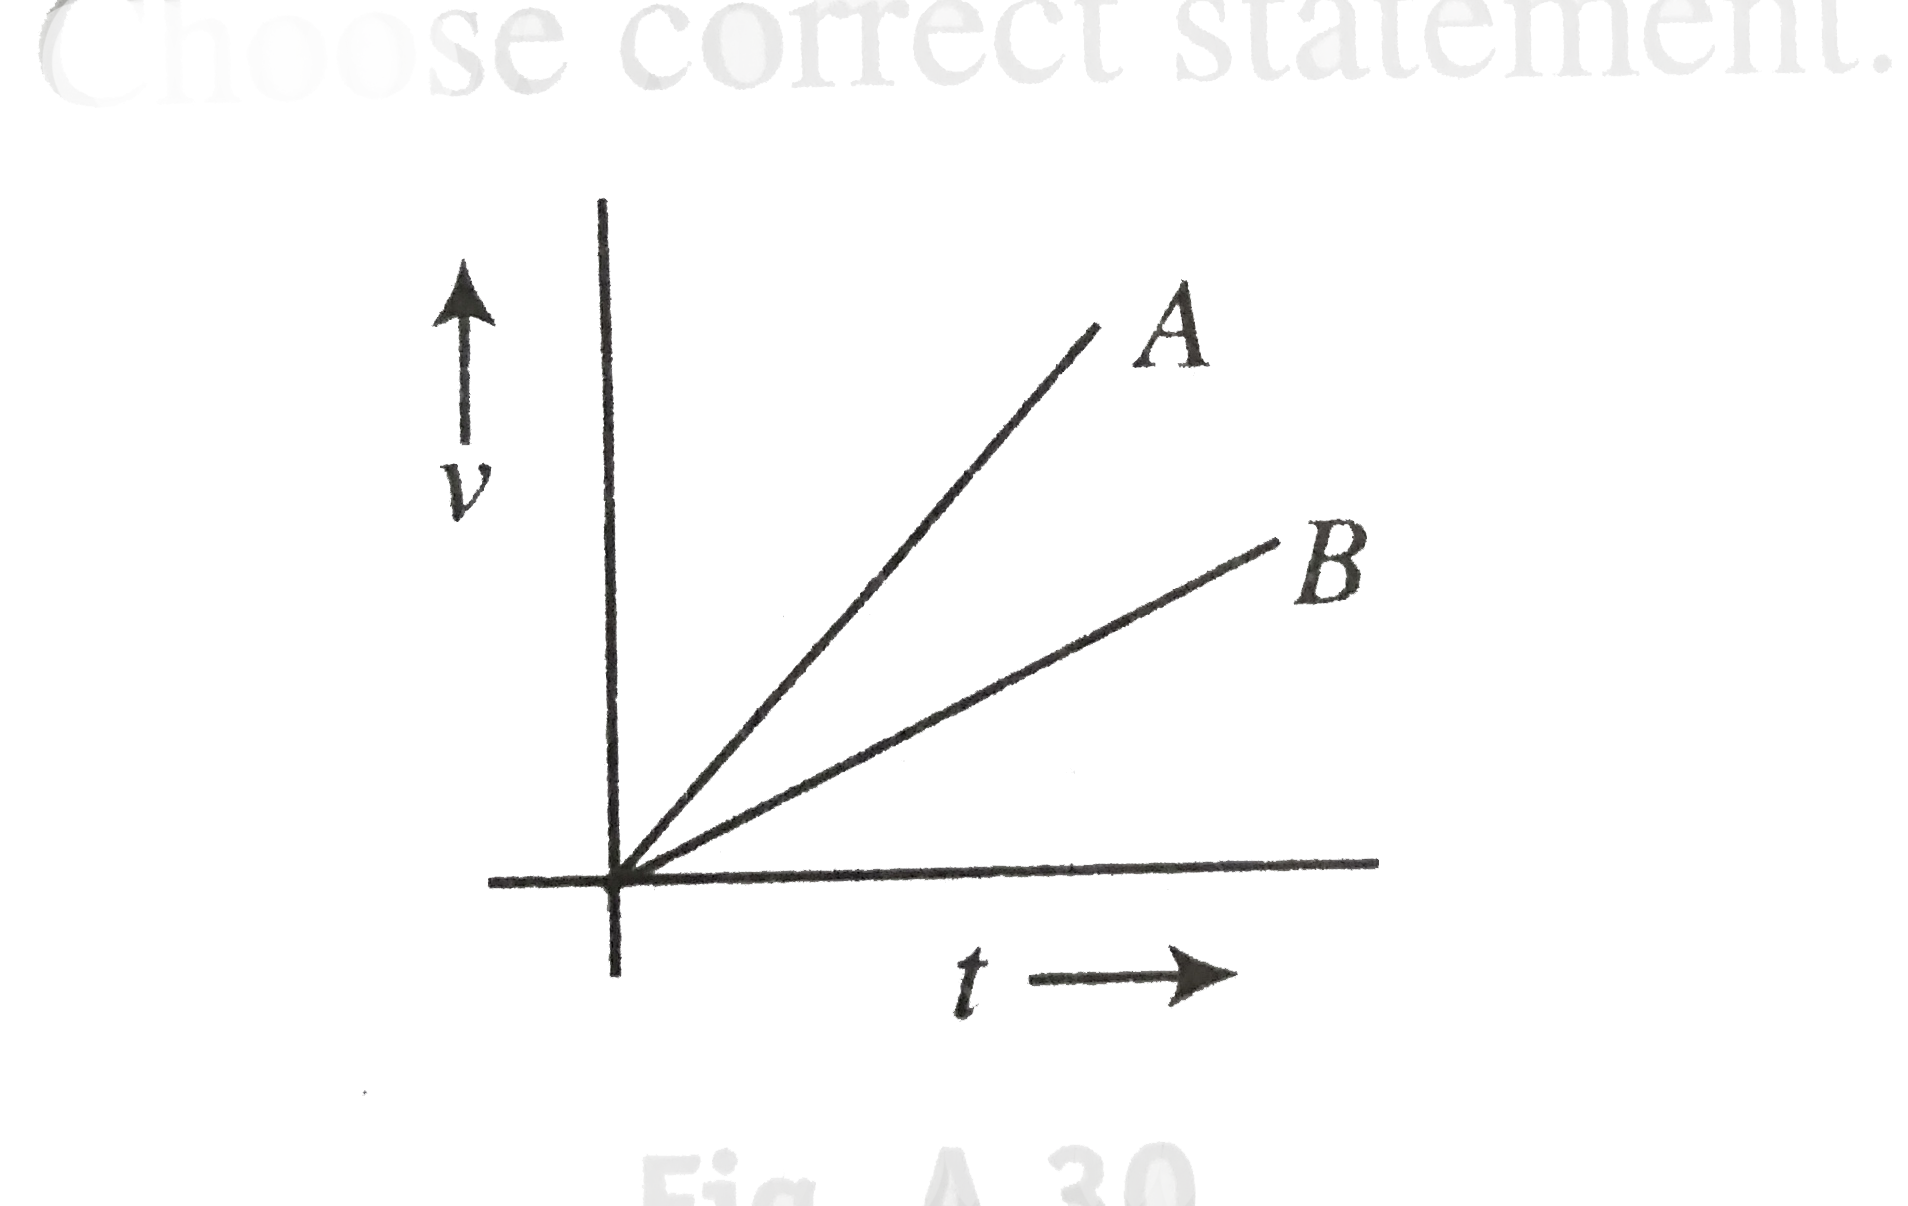
View SolutionThe velocity - time graph of two bodies A and B is shown in figure. Choose correct statement.
View SolutionWhich of the following x-t graphs represents the distance-time variation of a body released from the top of a buiding?
View SolutionThe magnetic flux through a coil varies with timet as shown in the diagram. Which graph best represents the variation of the e.m.f. E induced in the coil with time t?
View SolutionTwo bodies A and B having same angular momentum and IA>IB, then the relation between (K.E.)Aand(K.E.)B will be :
View SolutionA body at a temperature of 727∘C and having surface area 5cm2, radiations 300J of energy each minute. The emissivity is(Given Boltzmann constant =5.67×10⁻⁸Wm−2K−4
View SolutionA heated body maitained at T K emits thermal radiation of total energy E with a maximum intensity at frequency v. The emissivity of the material is 0.5. If the temperature of the body be increased and maintained at temperature 3T K, then :-
(i) The maximum intensity of the emitted radiation will occur at frequency v/3
(ii) The maximum intensity of the emitted radiation will occur at frequency 3v.
(iii) The total energy of emitted radiation will become 81 E
(iv) The total energy of emitted radiation will become 27 E
View Solution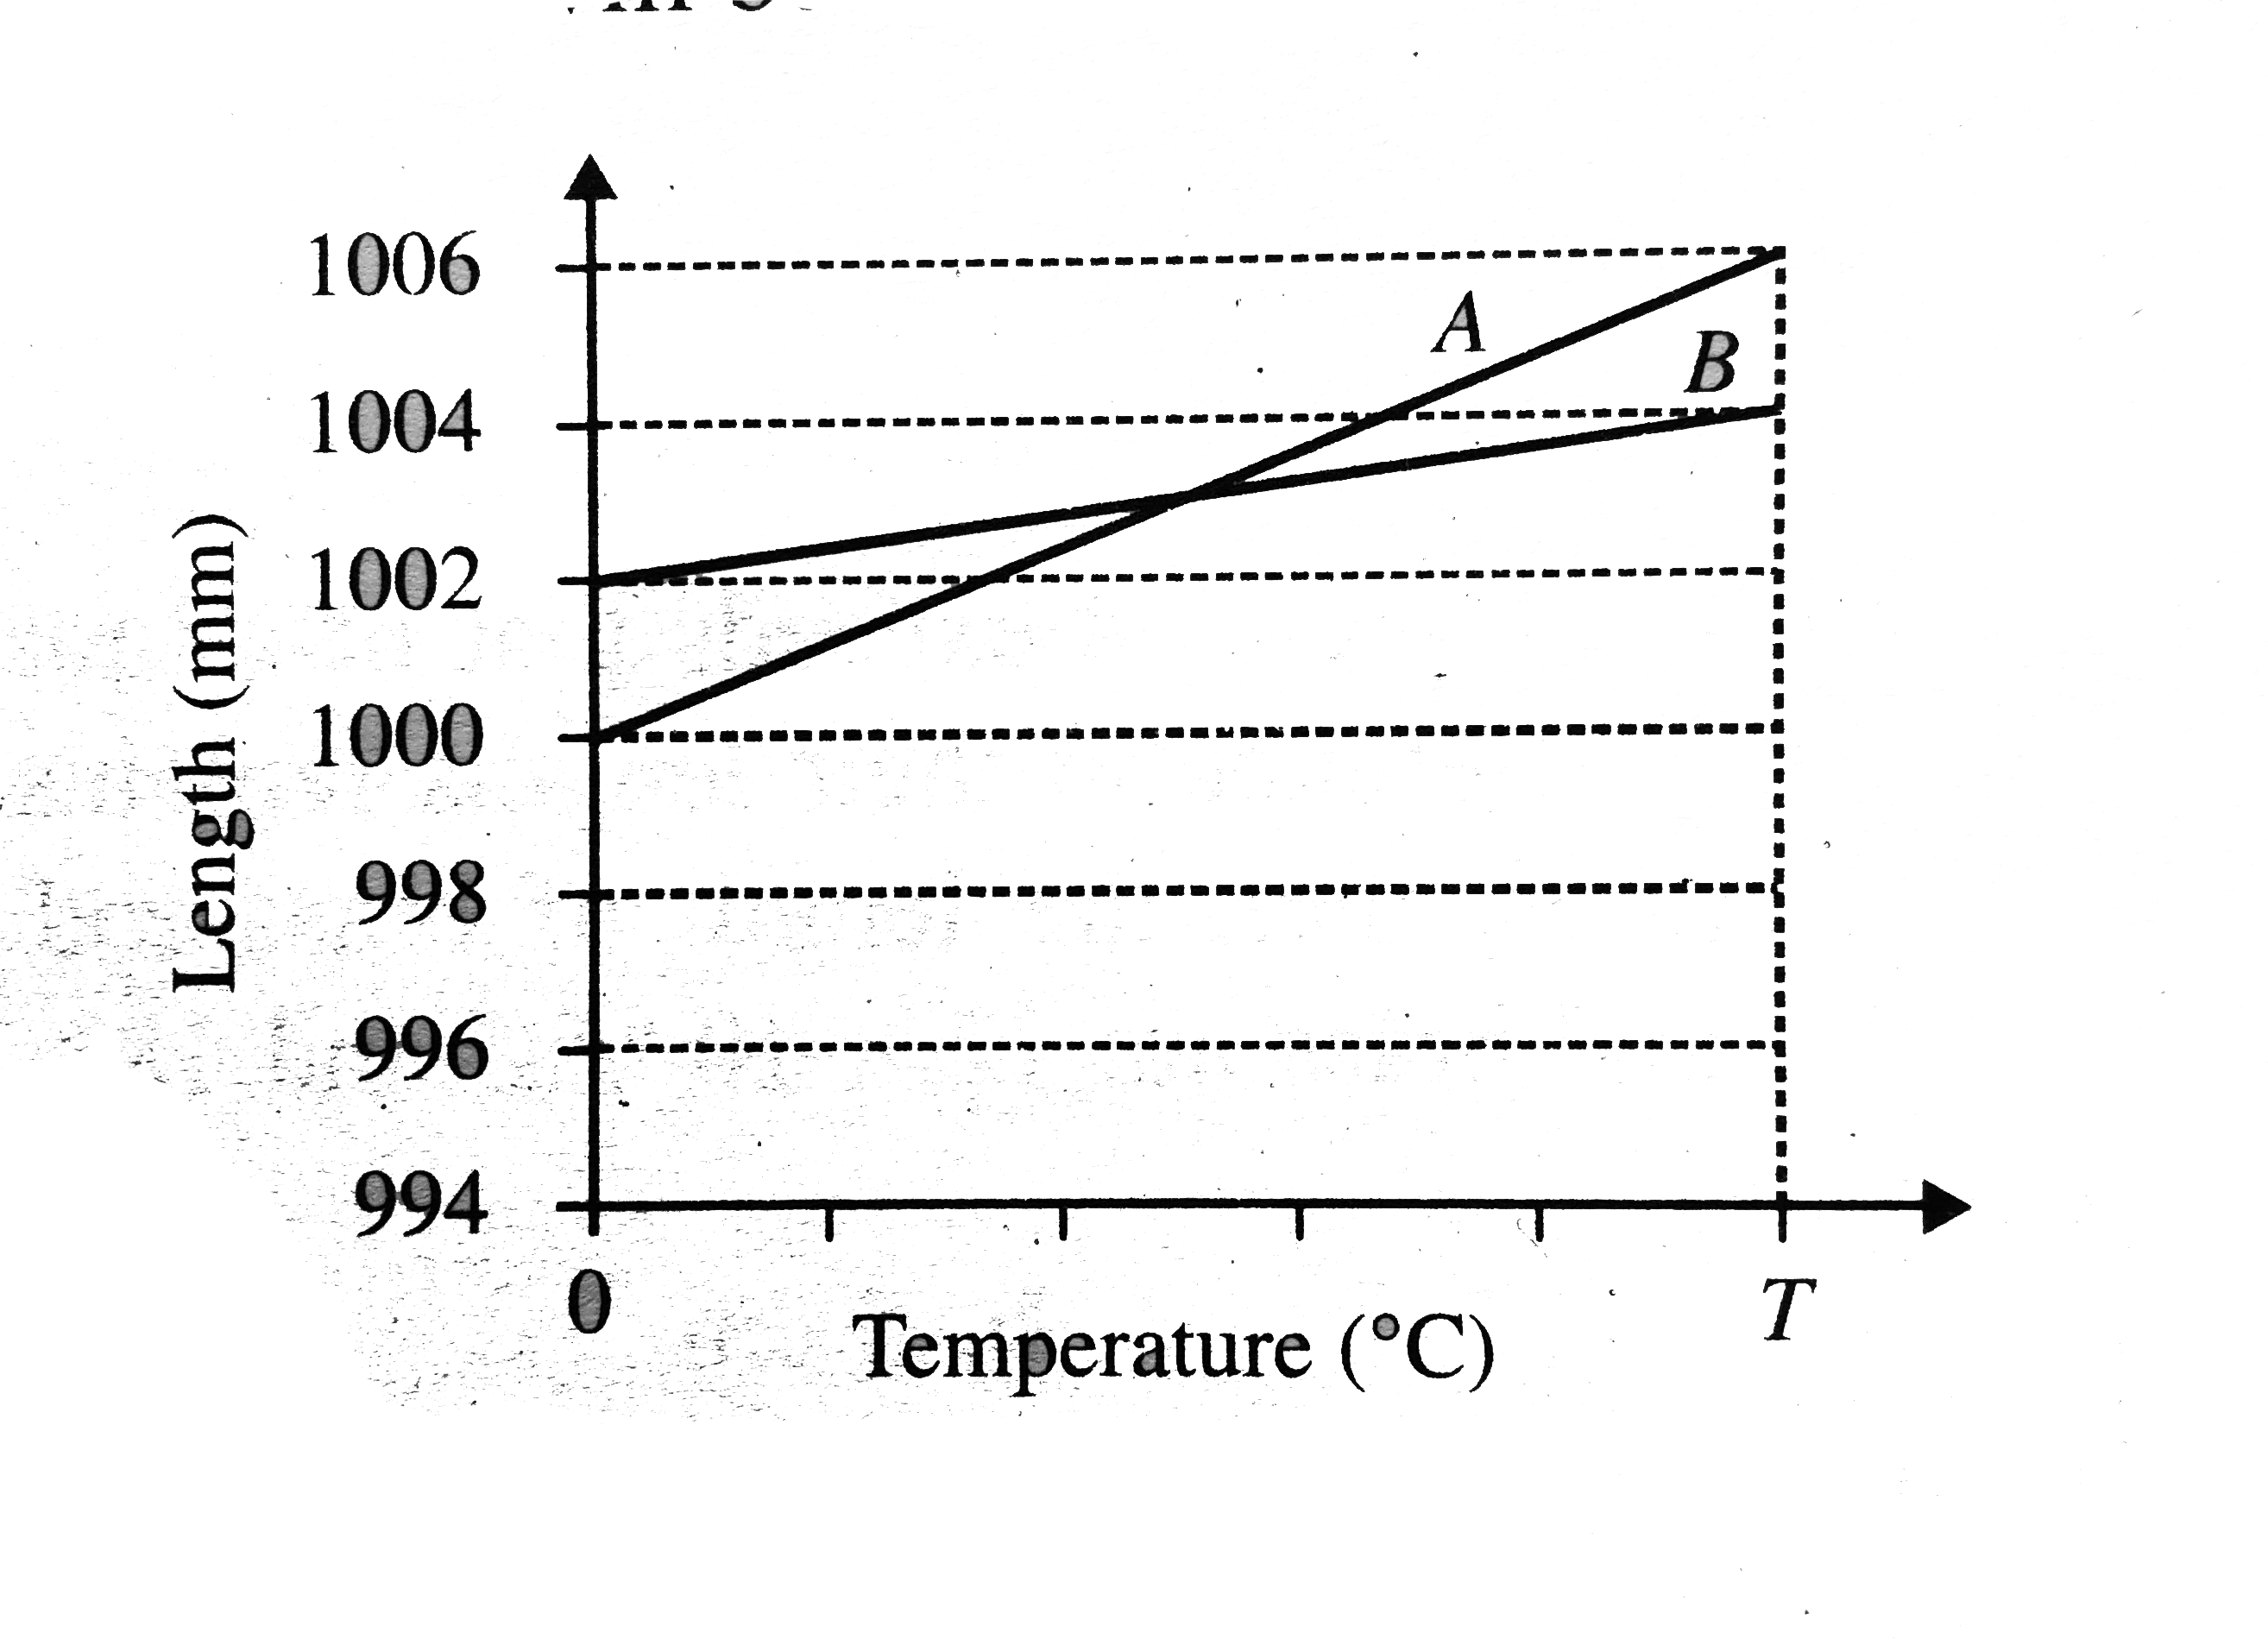
The variation of length of two metal rods A and B with change in temperature is shown in Fig. the coefficient of linear expansion αA for the metal A and the temperature T will be? ( alpha_(A)=3x10^(-6)/ C )
View Solution
