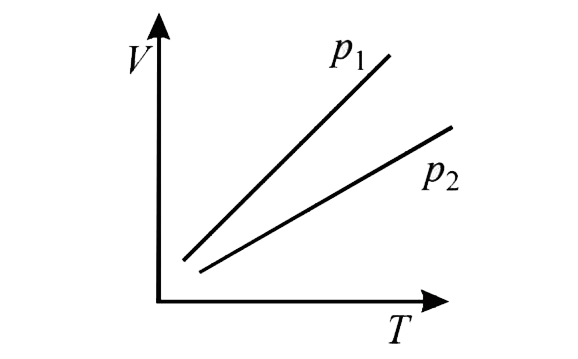
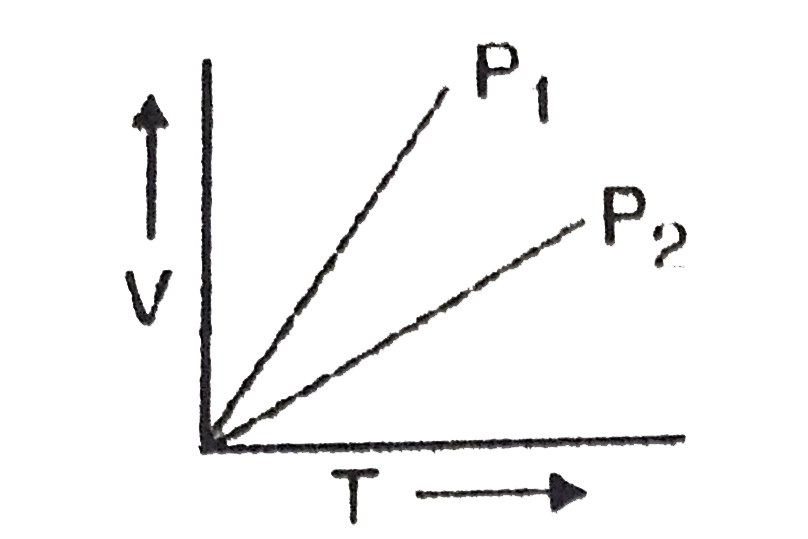
The volume V versus temperature T graphs for a certain amount of a perfect gas at two pressure are as shown in Fig. Show that is less than
constant
For a particular temperature
We have
Since,
.
Topper's Solved these Questions
- ARCHIVES 1 VOLUME 6BOOK - CENGAGE PHYSICS ENGLISHCHAPTER - ARCHIVES 1 VOLUME 6EXERCISE - Single Correct
54 Videos
- ARCHIVES 1 VOLUME 6BOOK - CENGAGE PHYSICS ENGLISHCHAPTER - ARCHIVES 1 VOLUME 6EXERCISE - Multi Correct
13 Videos
- ARCHIVES 1 VOLUME 6BOOK - CENGAGE PHYSICS ENGLISHCHAPTER - ARCHIVES 1 VOLUME 6EXERCISE - Integer
4 Videos
- ARCHIVES 2 VOLUME 6BOOK - CENGAGE PHYSICS ENGLISHCHAPTER - ARCHIVES 2 VOLUME 6EXERCISE - Integer
4 Videos
Similar Questions
The volume V versus temperature T graphs for a certain amount of a perfect gas at two pressure p1andp2 are as shown in Fig. It follows from the graphs that p1 is greater than p2.

View SolutionFigure shows volume - temperature (V-T) graph for same mass of an ideal gas at two different pressures P1and P2. Hence
View Solution
Knowledge Check
Volume versus temperature graphs for a given mass of an ideal gas are shown in figure. At two different values of constant pressure. What can be inferred about relation between P1 and P2 ?
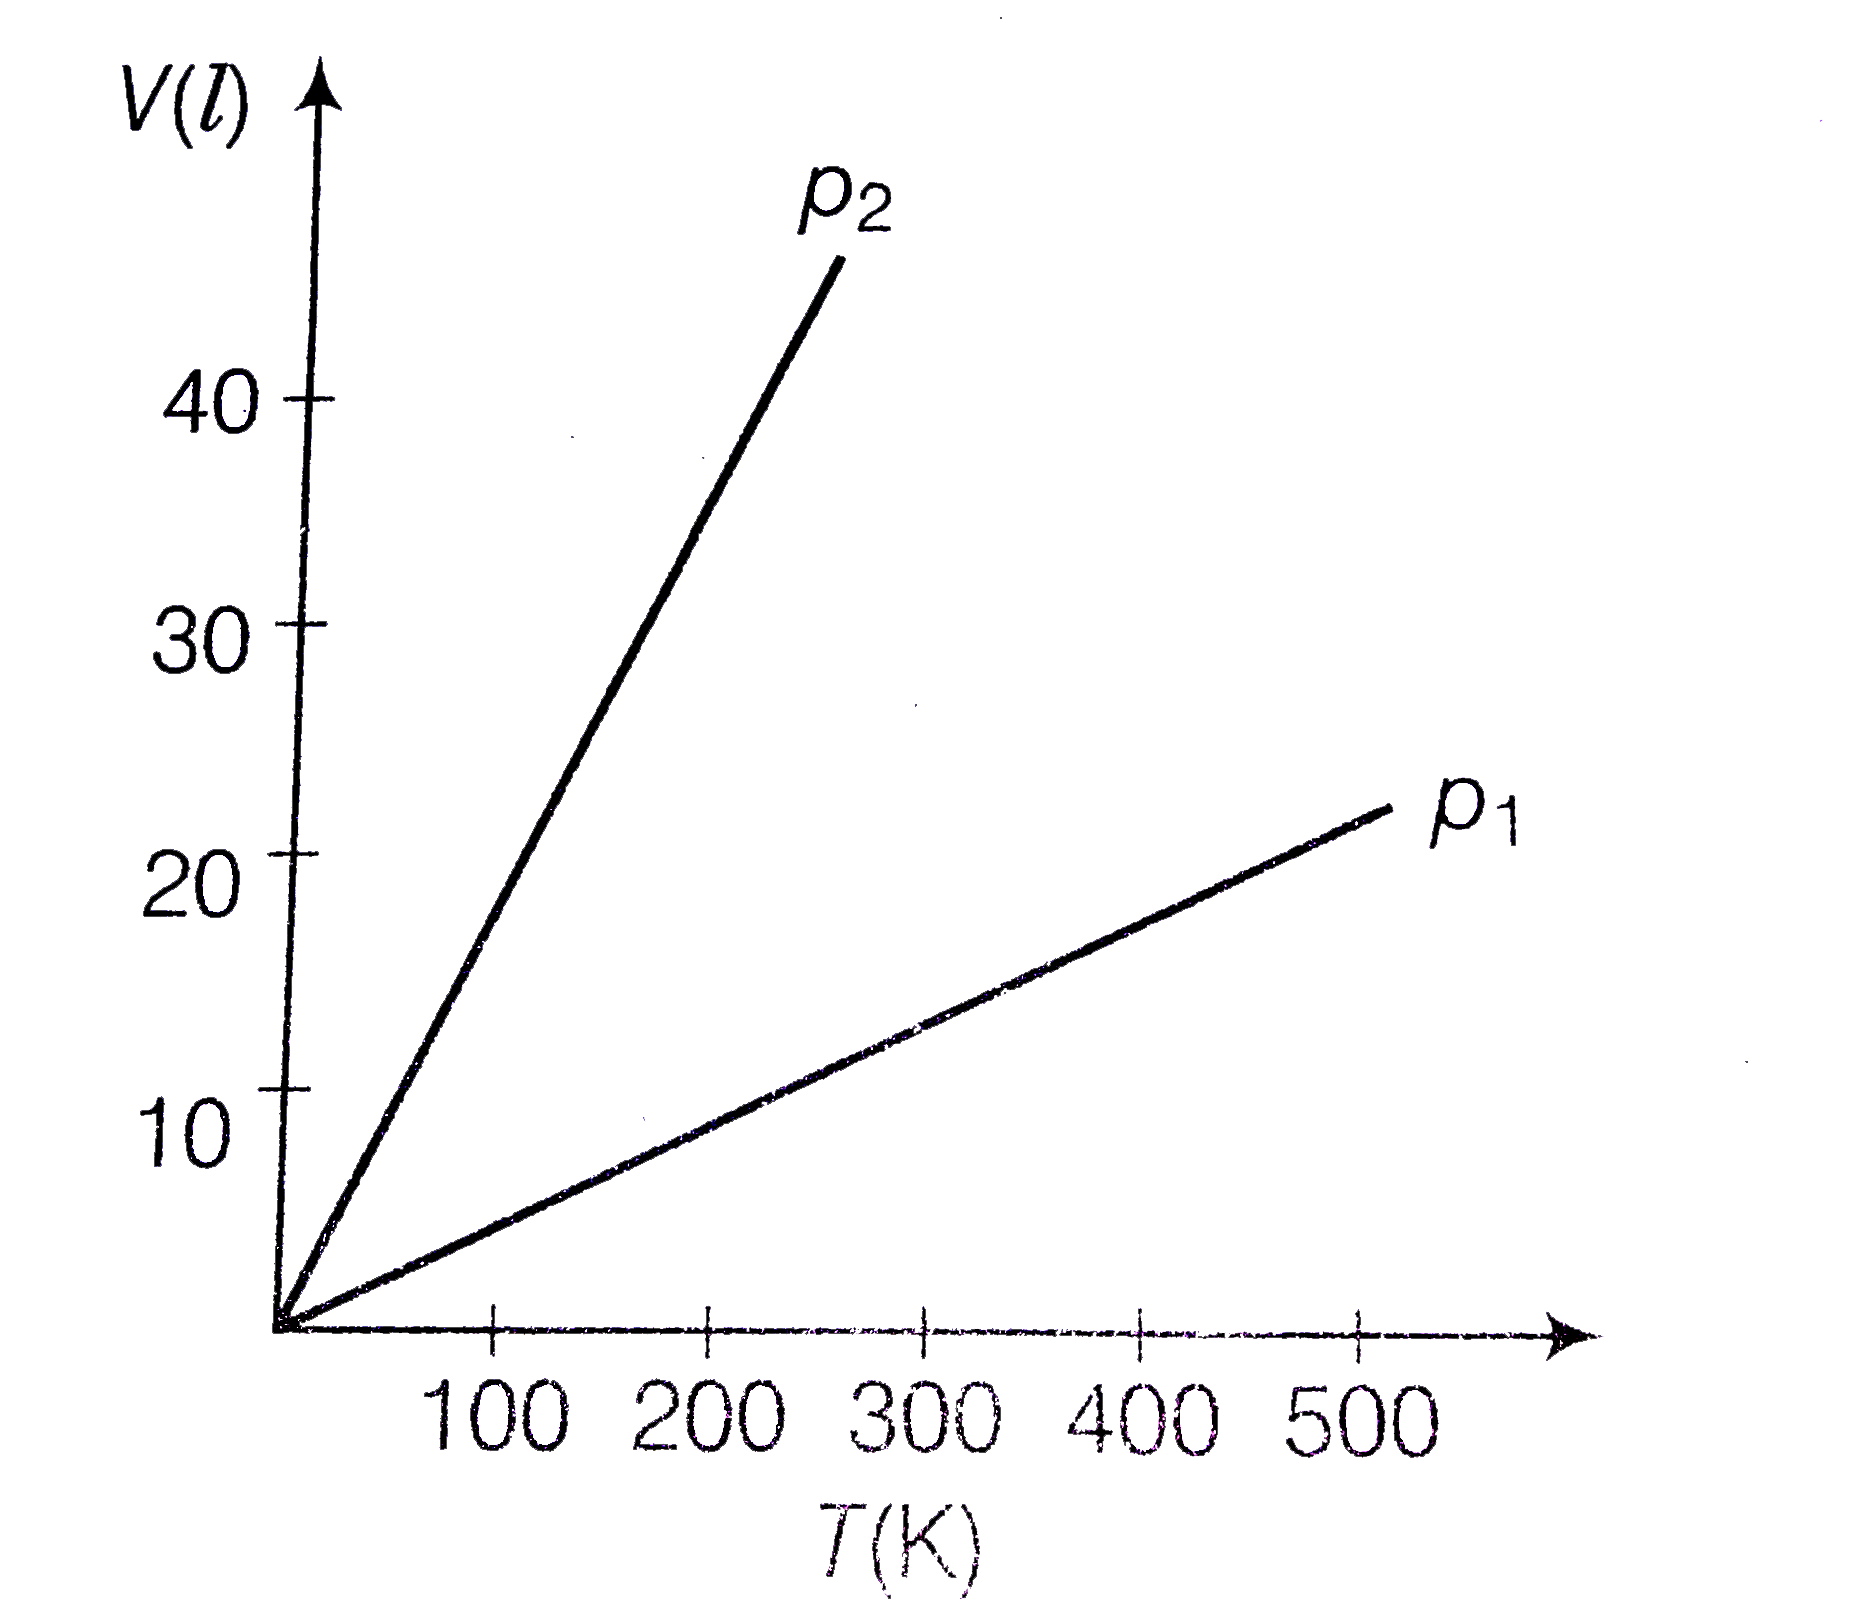 AP1>P2BP1=P2CP1<P2Ddata is insufficient
For V versus T curves at constant pressure P1andP2 for and ideal gas shown in figure-
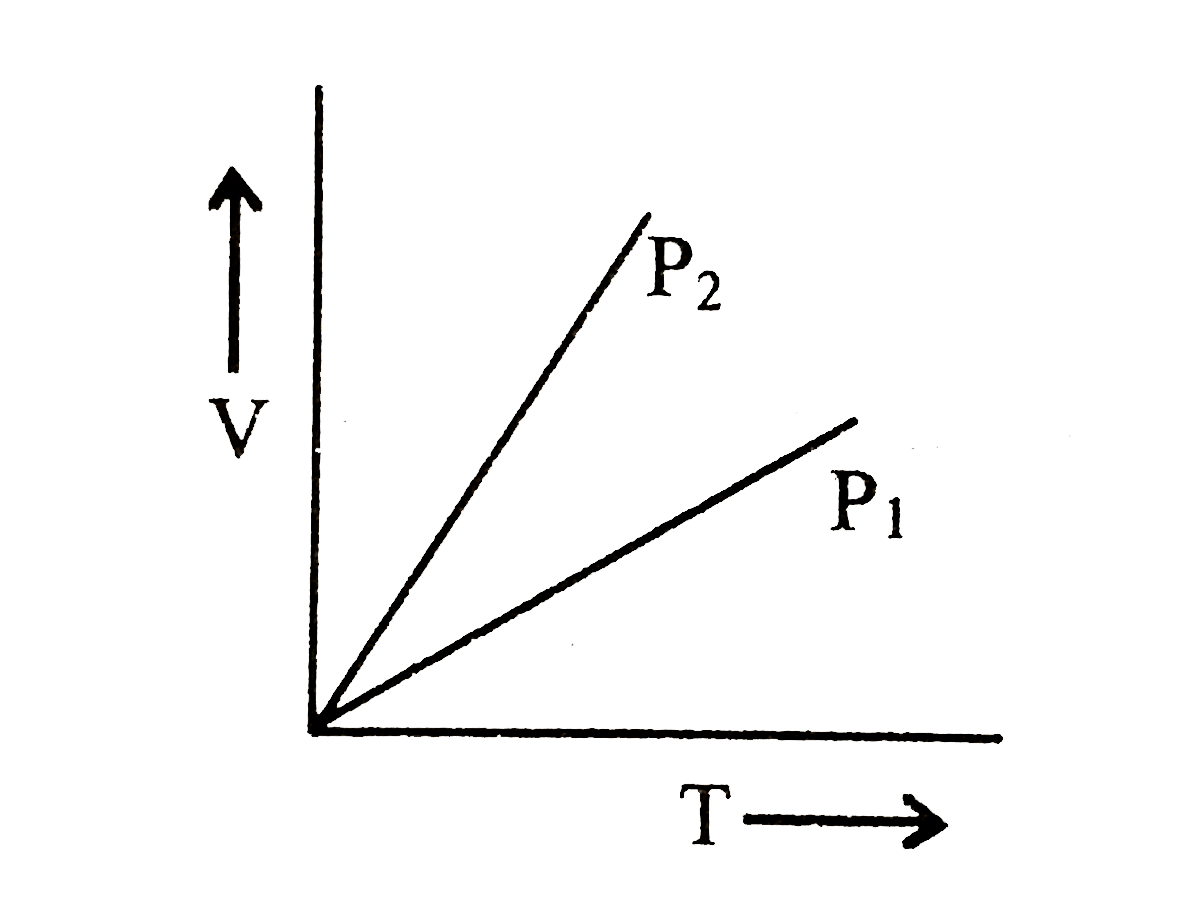
View SolutionFor an ideal gas V−T curves at constant pressure P1 & P2 are shown in figure, from the figure
_E01_061_Q01.png)
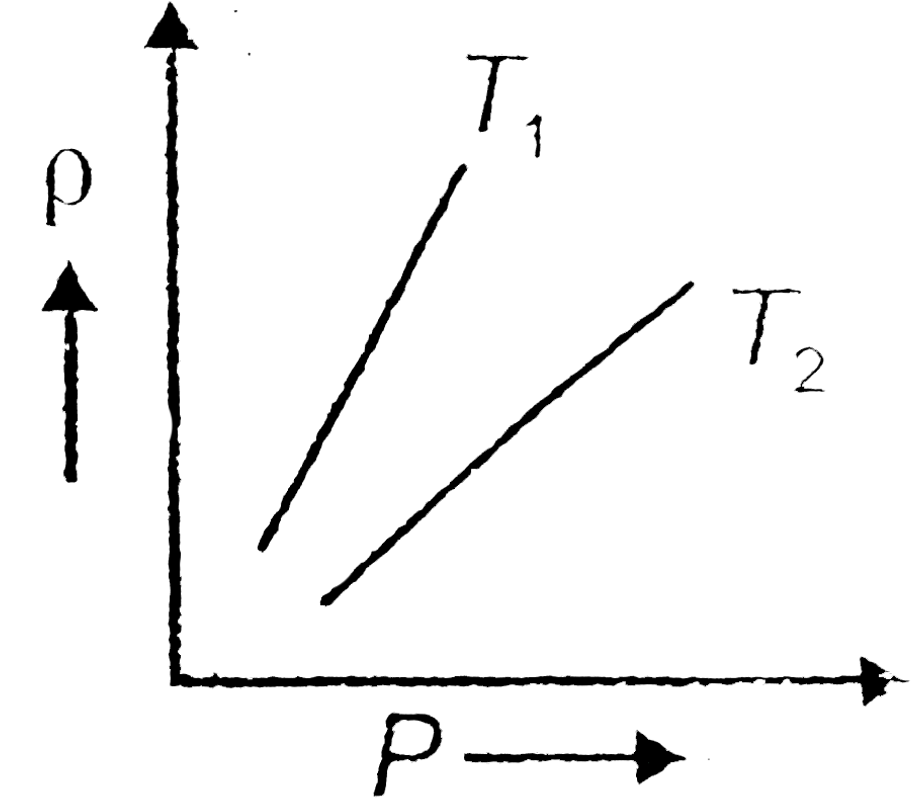
View SolutionThe density (ρ) versus pressure (P) graphs of a given mass of an ideal gas is shown at two temperatures T1andT2. Then relation between T1andT2 may be
View SolutionVolume versus temperature graphs for a given mass of an ideal gas are shown in figure. At two different values of constant pressure. What can be inferred about relation between P1 and P2 ?

View SolutionVolume versus temperature graphs for a given mass of an ideal gas are shown in figure. At two different values of constant pressure. What can be inferred about relation between P1 and P2 ?

View SolutionV vs T curves at constant pressure P1 and P2 for an ideal gas are shown in the figure. Which of the following is correct?

View SolutionV vs T curves at constant pressure P1 and P2 for an ideal gas are shown below
Which is correct ?
View Solution
