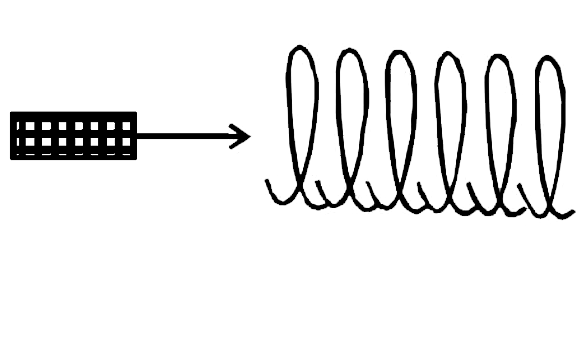
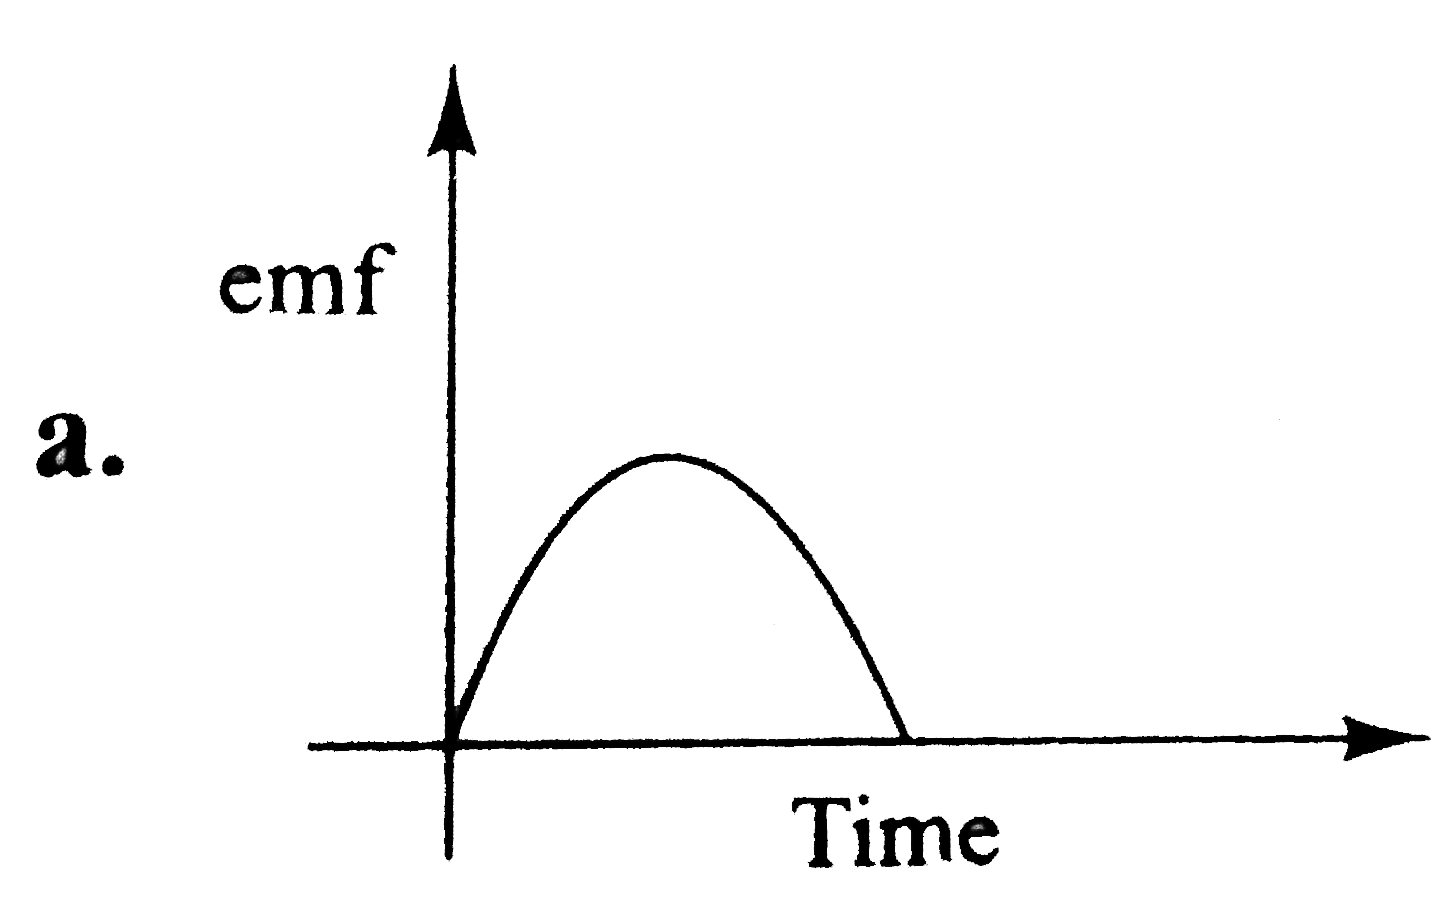
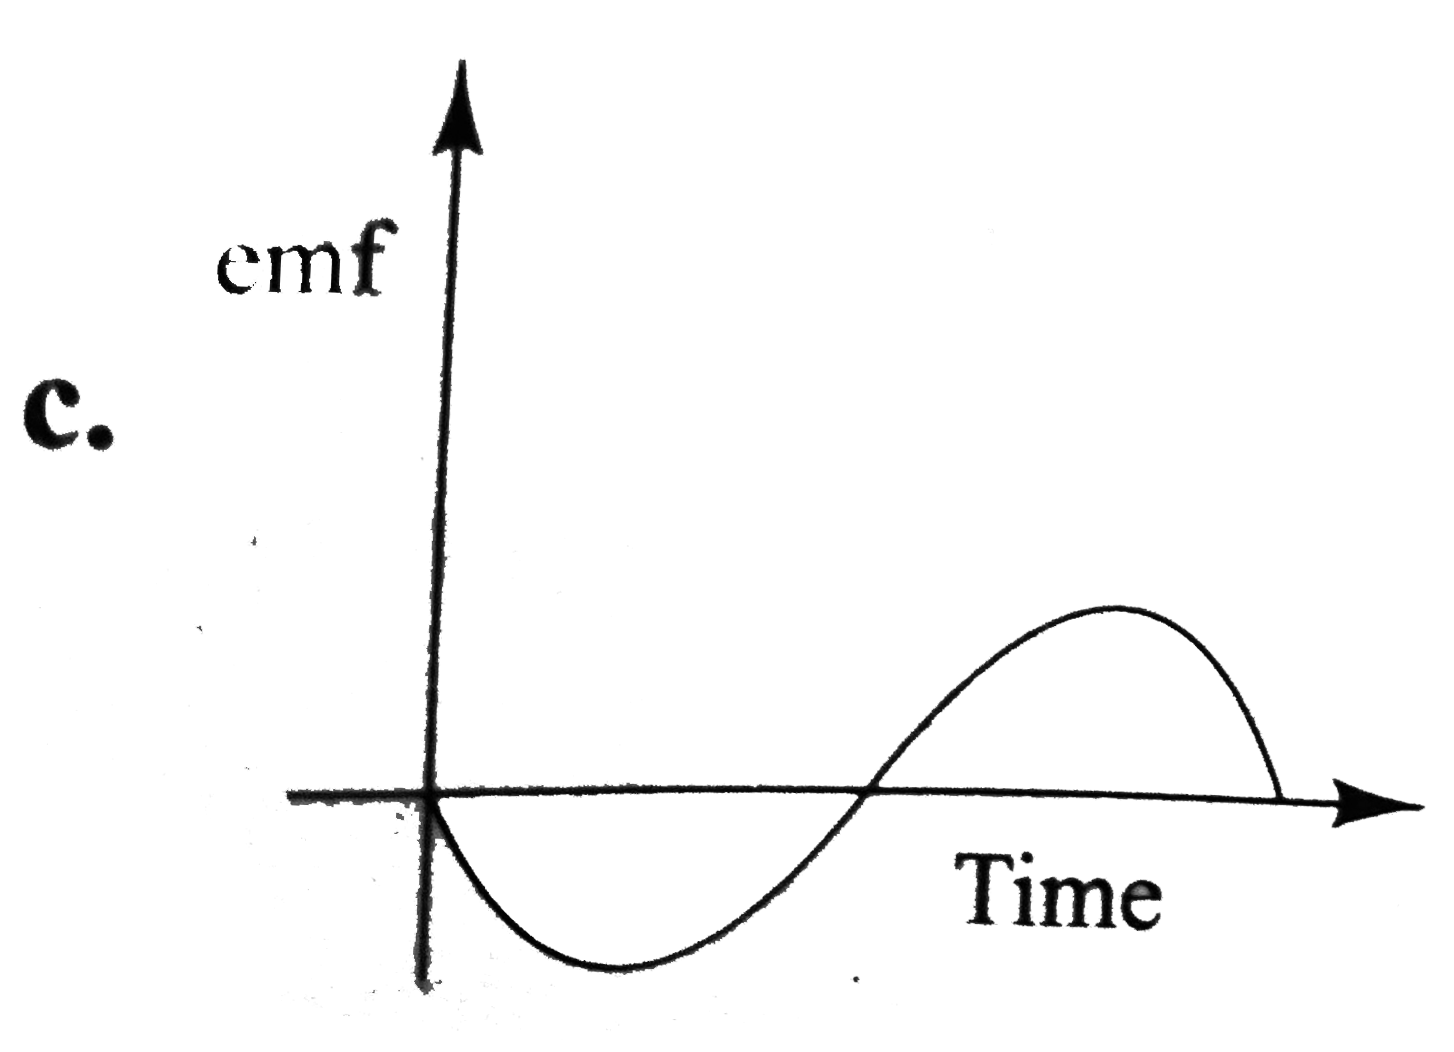
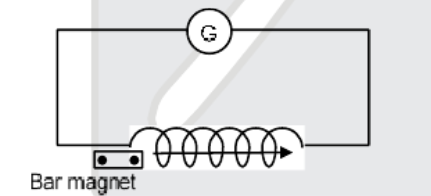
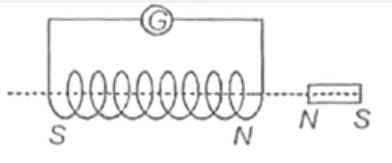
A small bar magnet is being slowly inserted with constant velocity inside a solenoid as shown in figure. Which graph best represents the relationship between emf induced with time


The correct Answer is:C
Initially ϕB increases as the magnet approaches the solenoid. Therefore, ε is negative and increases in magnitude when the magnet moves inside the solenoid. Increase in ϕB slows down and finally ϕB starts decreasing. Therefore e.m.f becomes positive and starts increasing. Only graph (c ) shows these characteristics. Also polarity of emf will charge when magnet starts coming out.
Topper's Solved these Questions
- INDUCTANCEBOOK - CENGAGE PHYSICS ENGLISHCHAPTER - INDUCTANCEEXERCISE - Archives (multiple Correct)
3 Videos
- INDUCTANCEBOOK - CENGAGE PHYSICS ENGLISHCHAPTER - INDUCTANCEEXERCISE - Archives (linked Compreshension)
8 Videos
- INDUCTANCEBOOK - CENGAGE PHYSICS ENGLISHCHAPTER - INDUCTANCEEXERCISE - Archives (fills In The Blanks)
3 Videos
- HEATING EFFECT OF CURRENTBOOK - CENGAGE PHYSICS ENGLISHCHAPTER - HEATING EFFECT OF CURRENTEXERCISE - Thermal Power in Resistance Connected in Circuit
27 Videos
- MAGNETIC FIELD AND MAGNETIC FORCESBOOK - CENGAGE PHYSICS ENGLISHCHAPTER - MAGNETIC FIELD AND MAGNETIC FORCESEXERCISE - Multiple Correct Answer type
2 Videos
Similar Questions
Knowledge Check
The velocity -displacement graph of a particle is as shown in the figure. Which of the following graphs correctly represents the variation of acceleration with displacement?
 A
A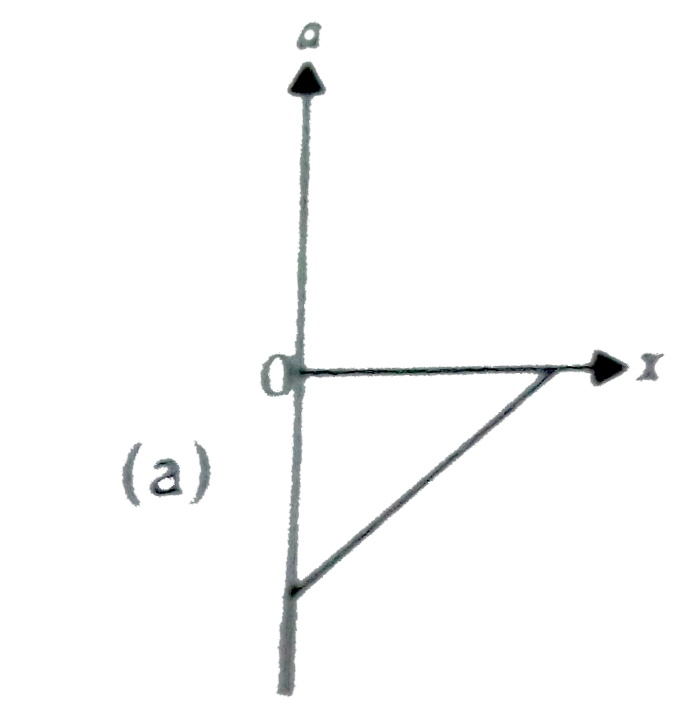 B
B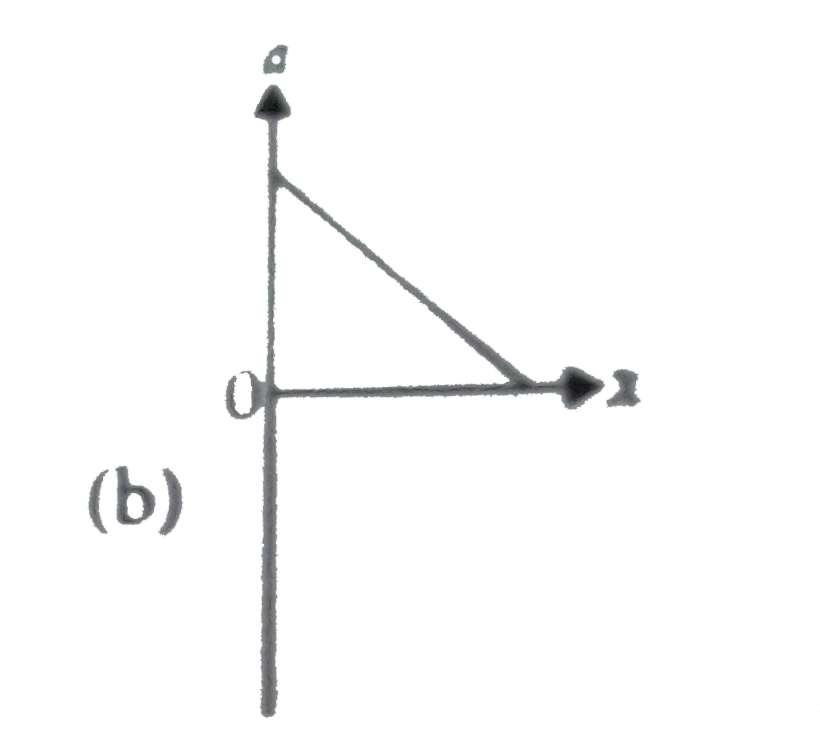 C
C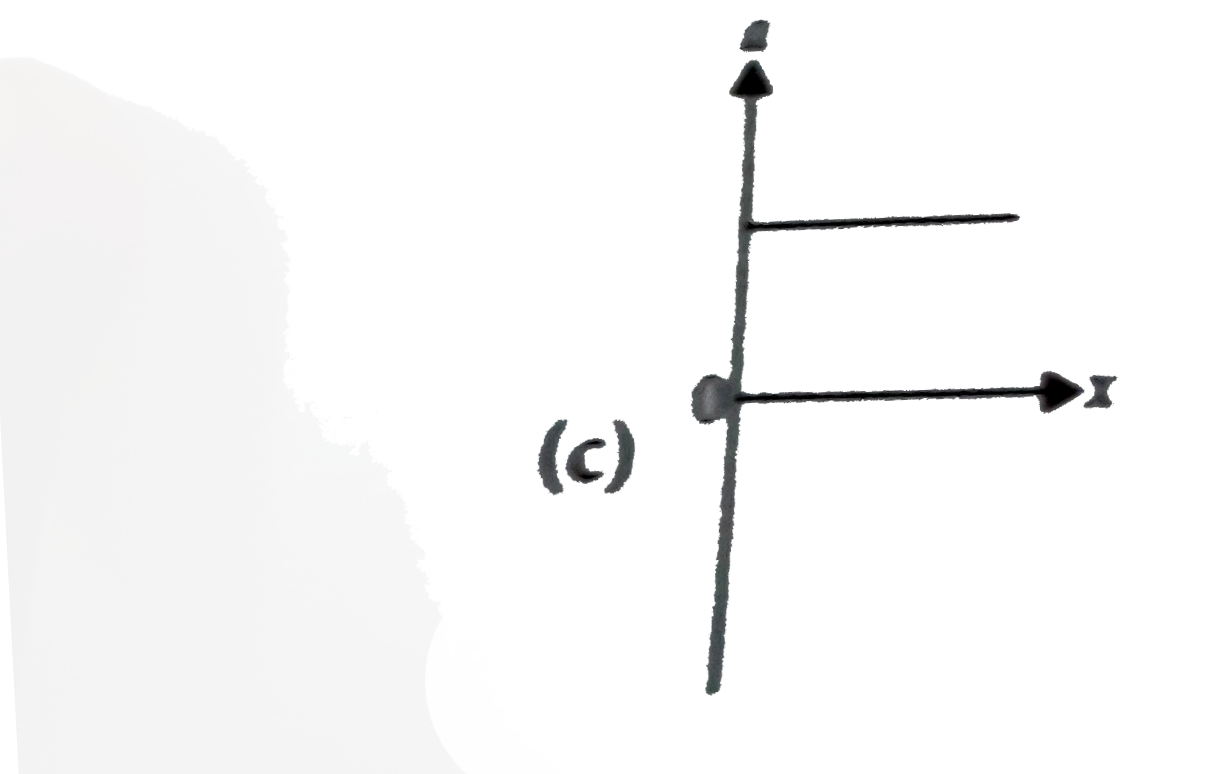 D
D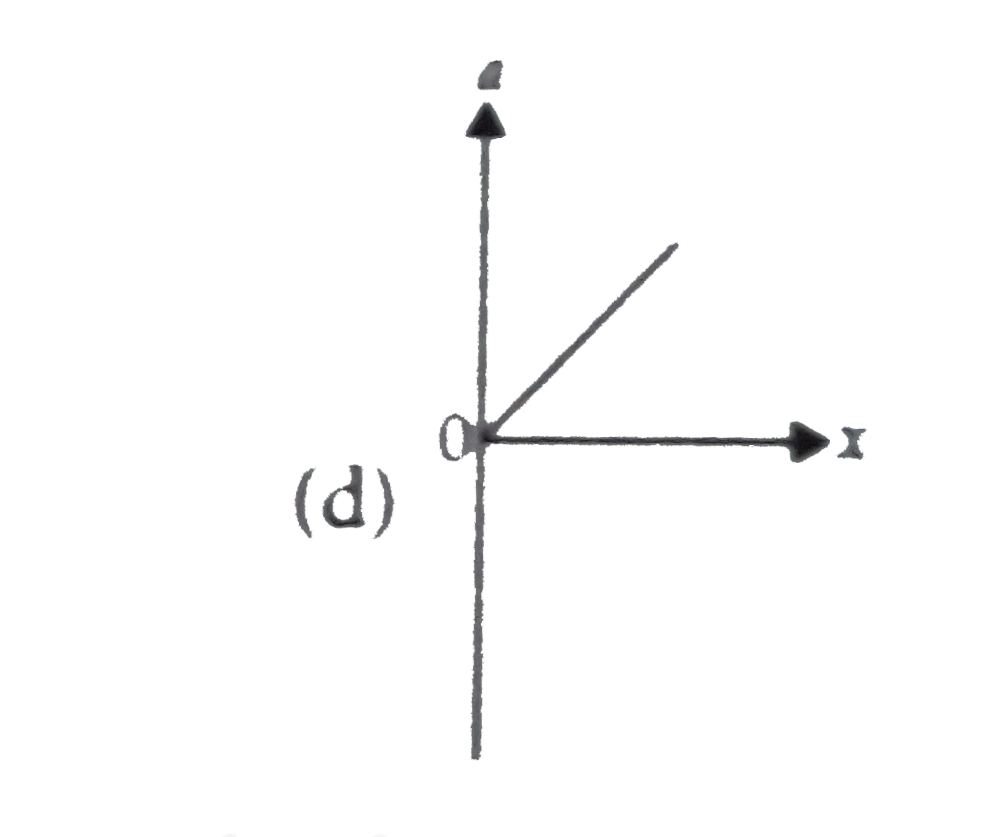
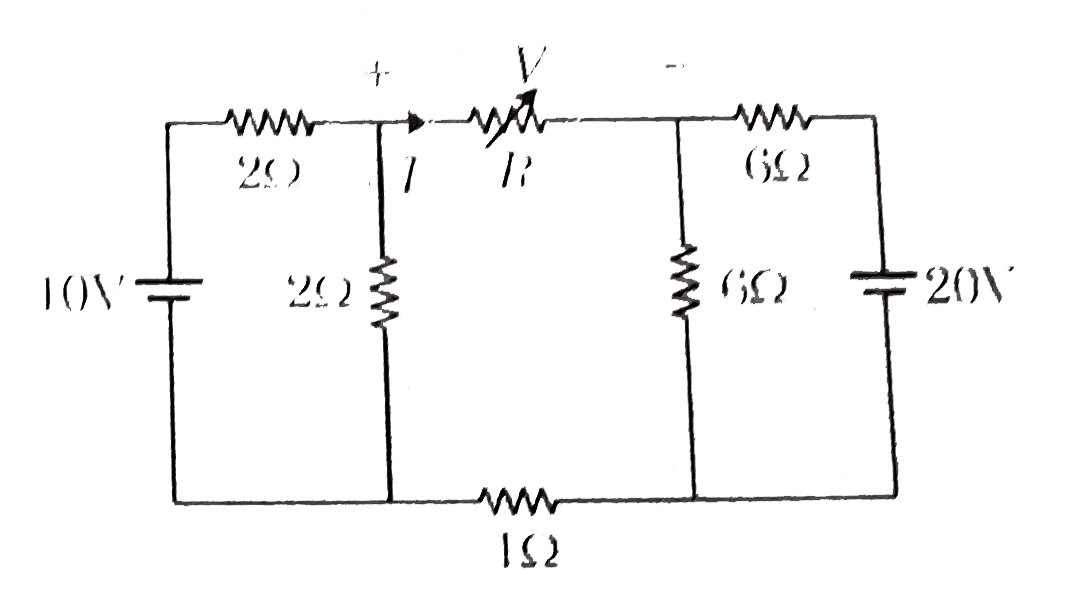
Consider circuit as shown . Which of the graph best represent V-l relationship across the variable resistance R.
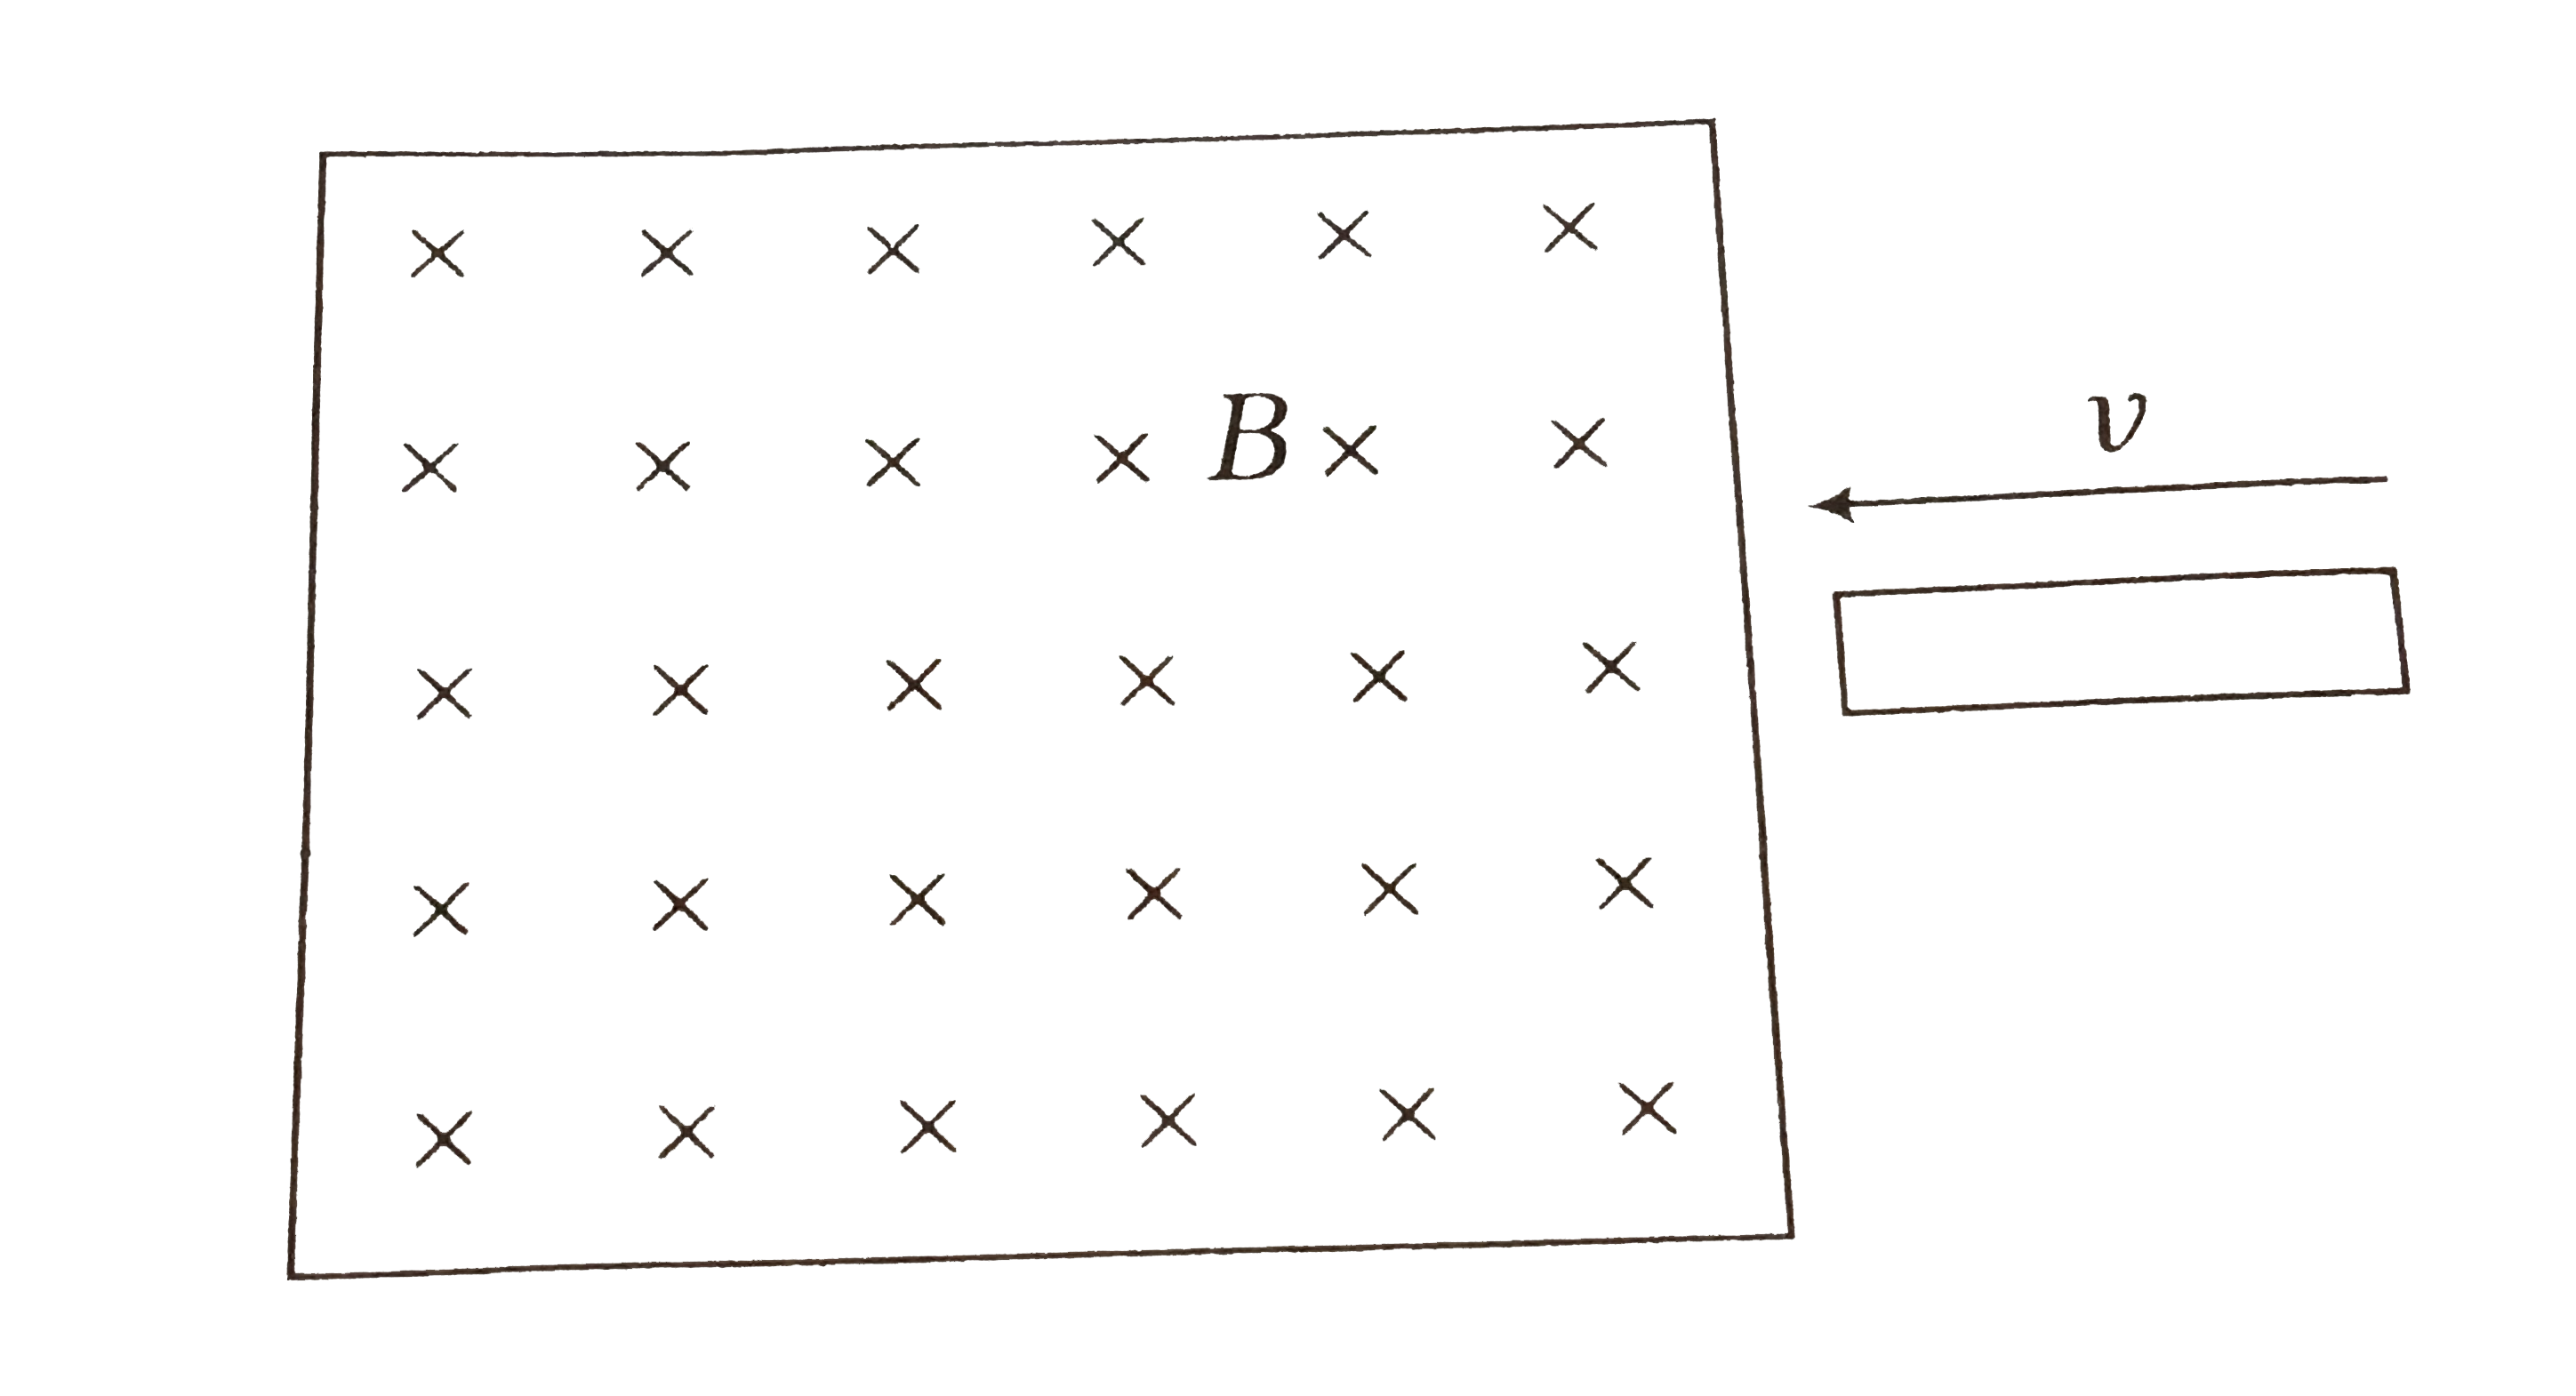
View SolutionThrough a uniform B field, A small rectangular loop is moving towards left with constant velocity as shown in the figure. Counting of time t begins at the moment, the loop starts entering the field.
Plot the variation of flux through the loop with respect to time. Also, plot the variation of induced emf w.r.t. time t.
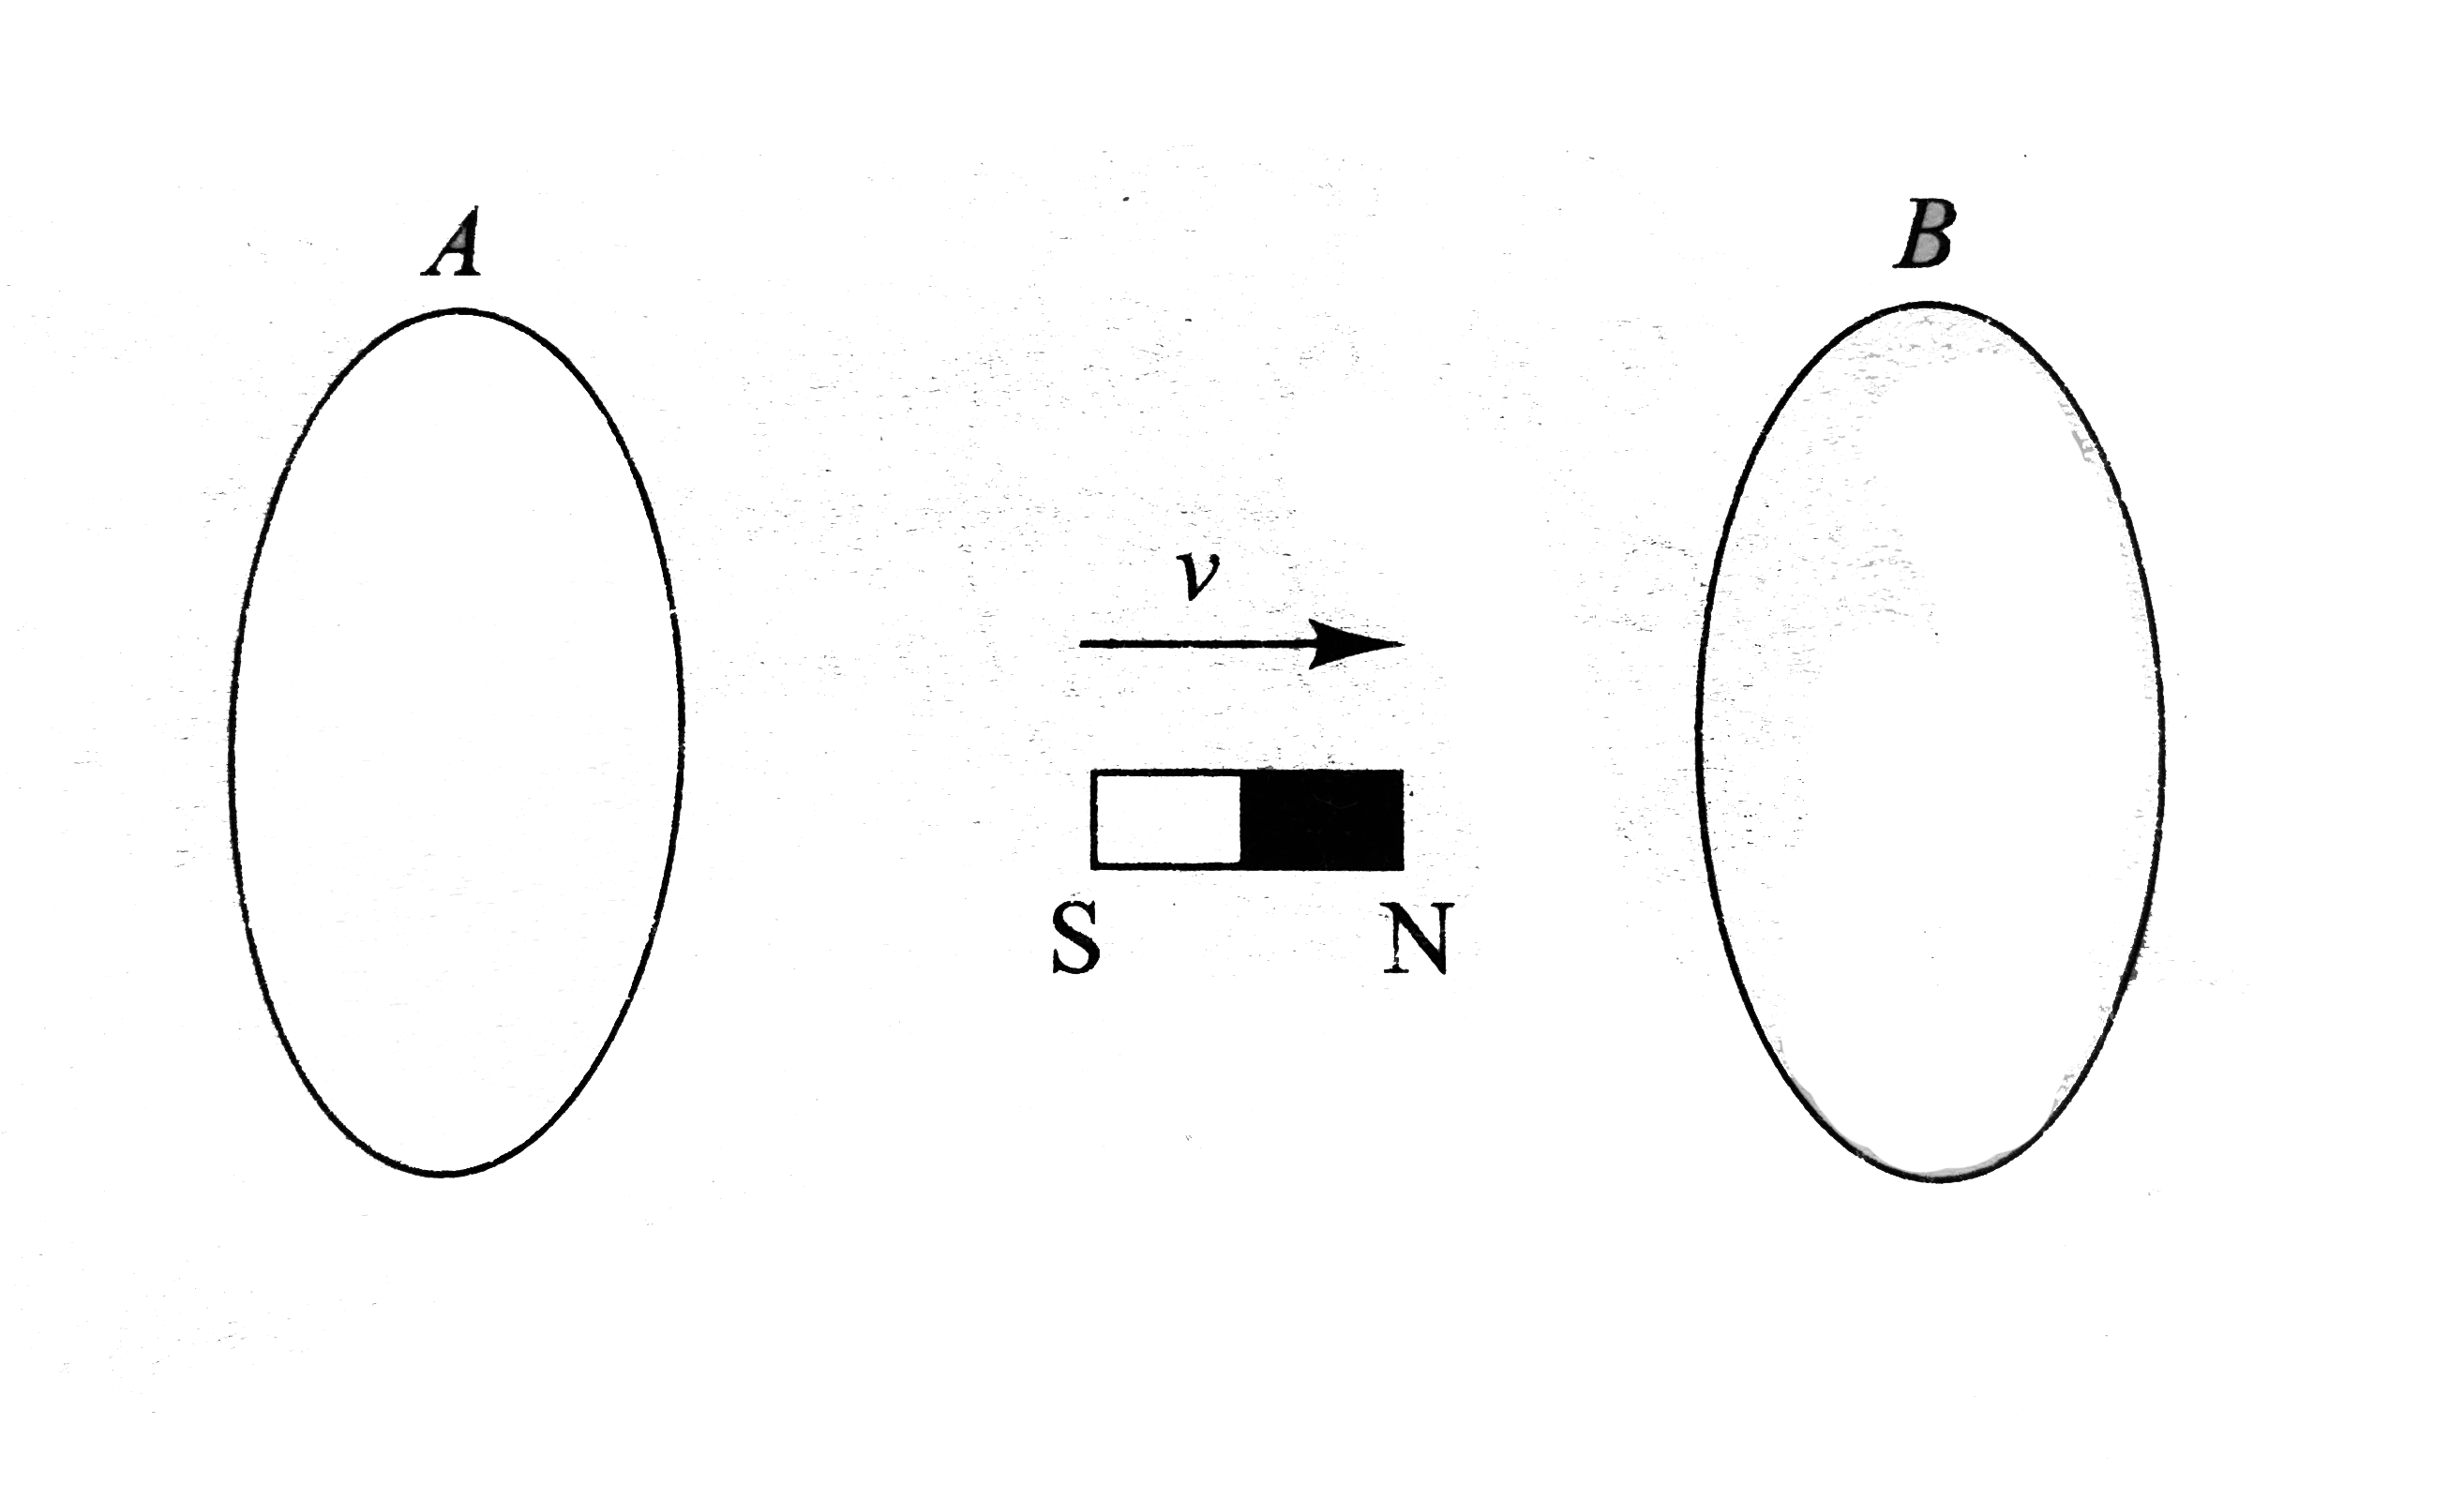
View SolutionA bar magnet is moved between two parallel circular loops AandB with a constant velocity v as shown in Fig. 3.180.
View SolutionA bar magnet moves with constant velocity as shown in figure through a coil. Which of the following option is correctly represent deflection of needle in galvanometer
View SolutionThe long straight wire in figure (a) carries a constant current i. A metal bar of length i is moving at constant velocity v as shown in figure. Point a is a distance d from the wire.
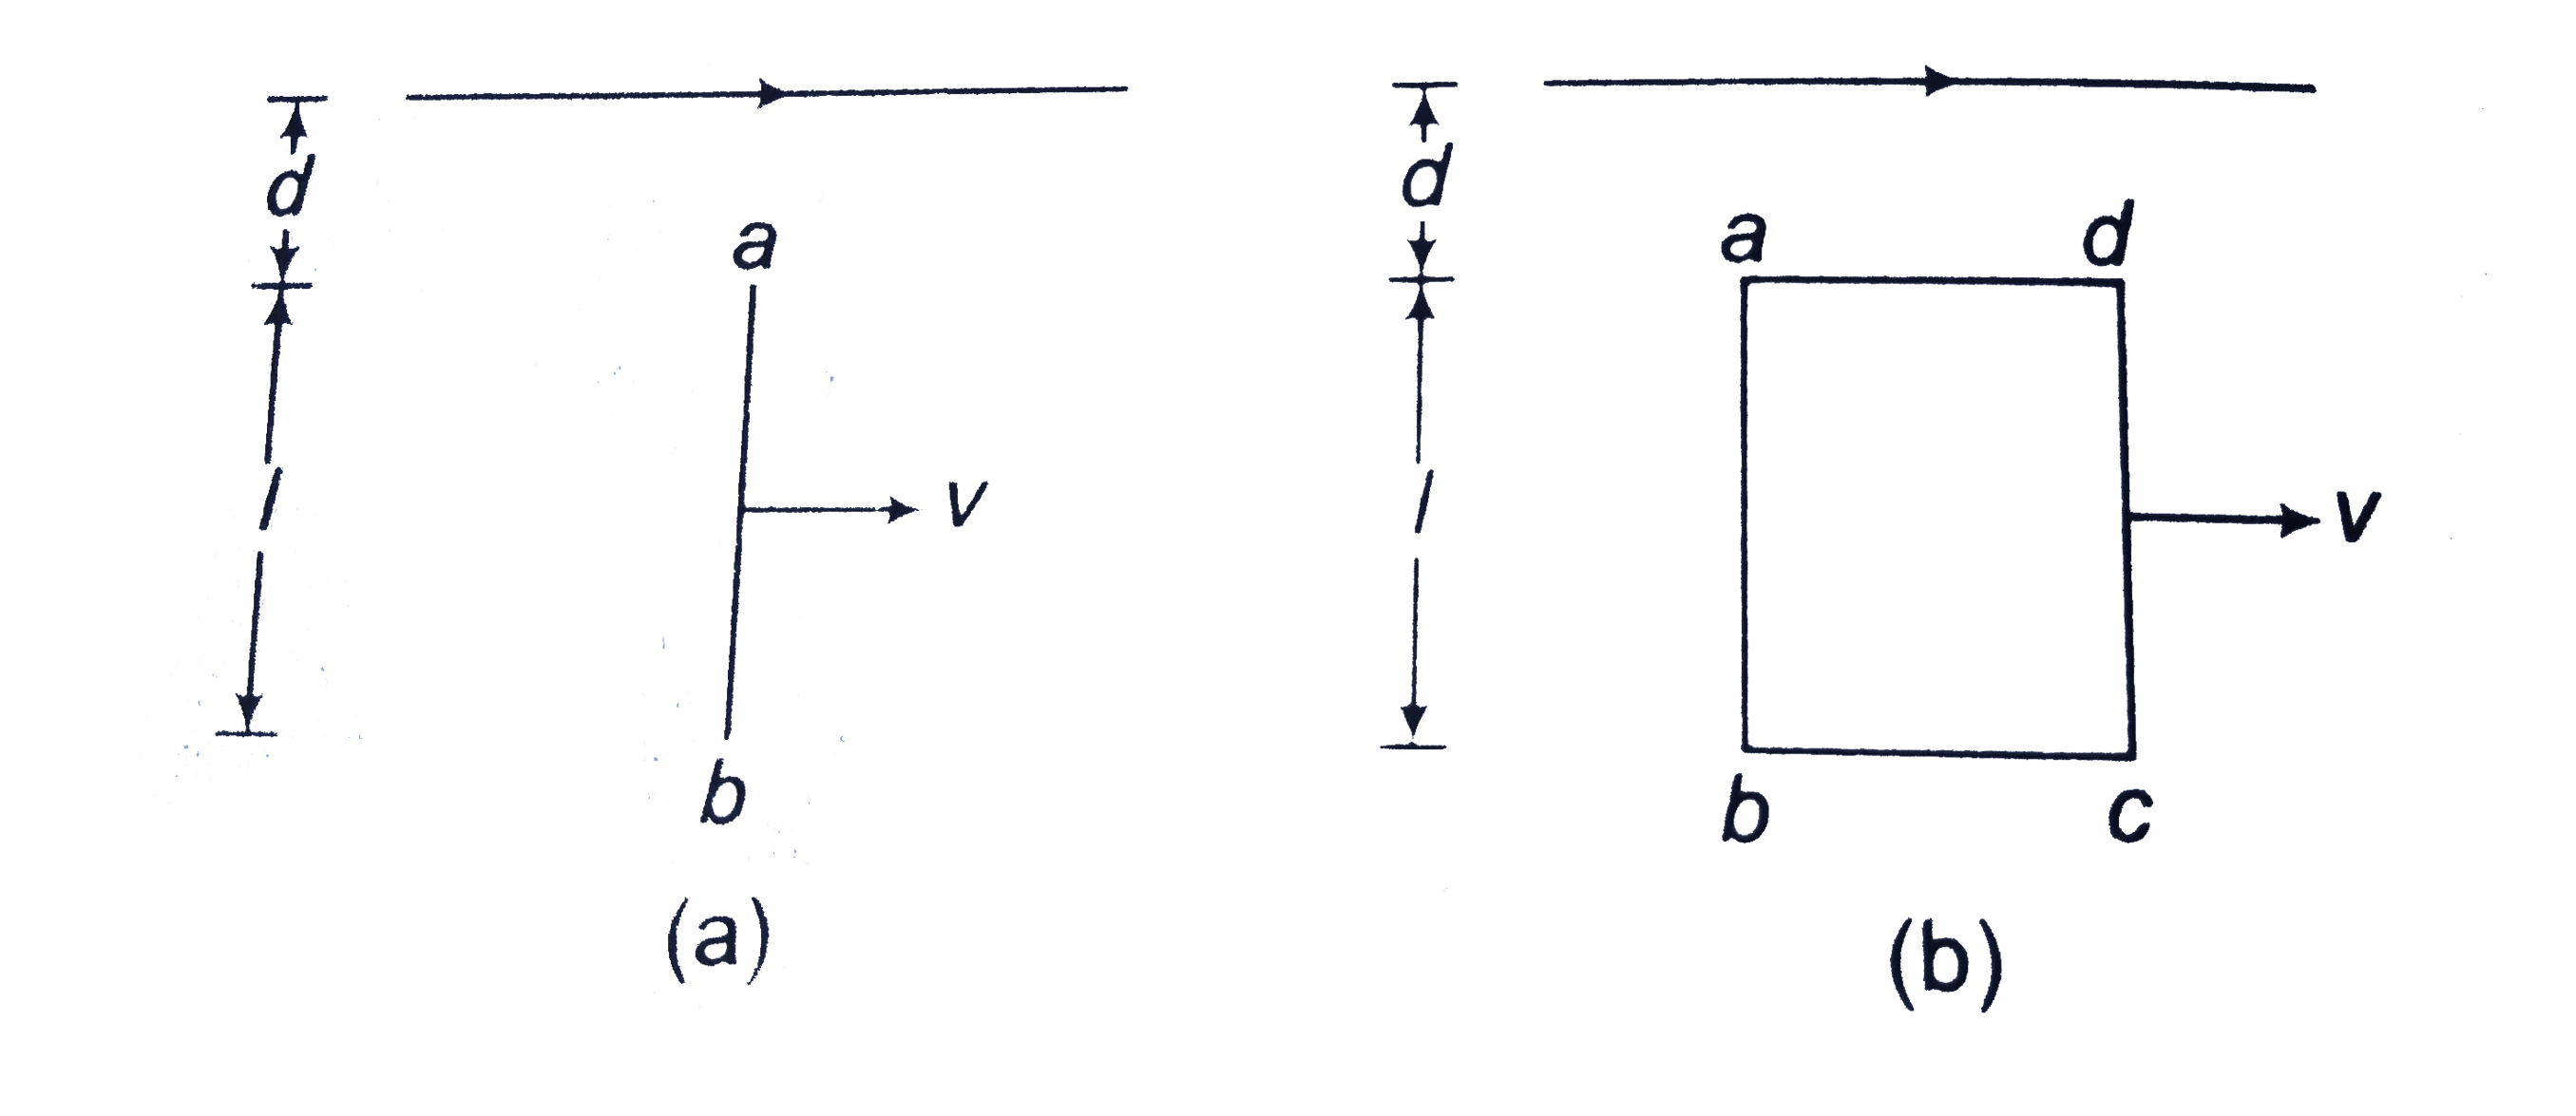
(a) Calculate the emf induced in the bar.
(b) Which point a or b is at higher potential?
(c) If the bar is replaced by a rectangular wire loop of resistance R, what is the magnitude of current induced in the loop?
View SolutionThe current through the coil in figure (i) varies as shown in figure (ii). Which graph best shows the ammeter A reading as a function of time?

View SolutionA short bar magnet passes at a steady speed right through a'long solenoid. A galvanometer is connected across the solencid. Which graph best represents the variation of the galvanometer deflection with time t?
View Solution
