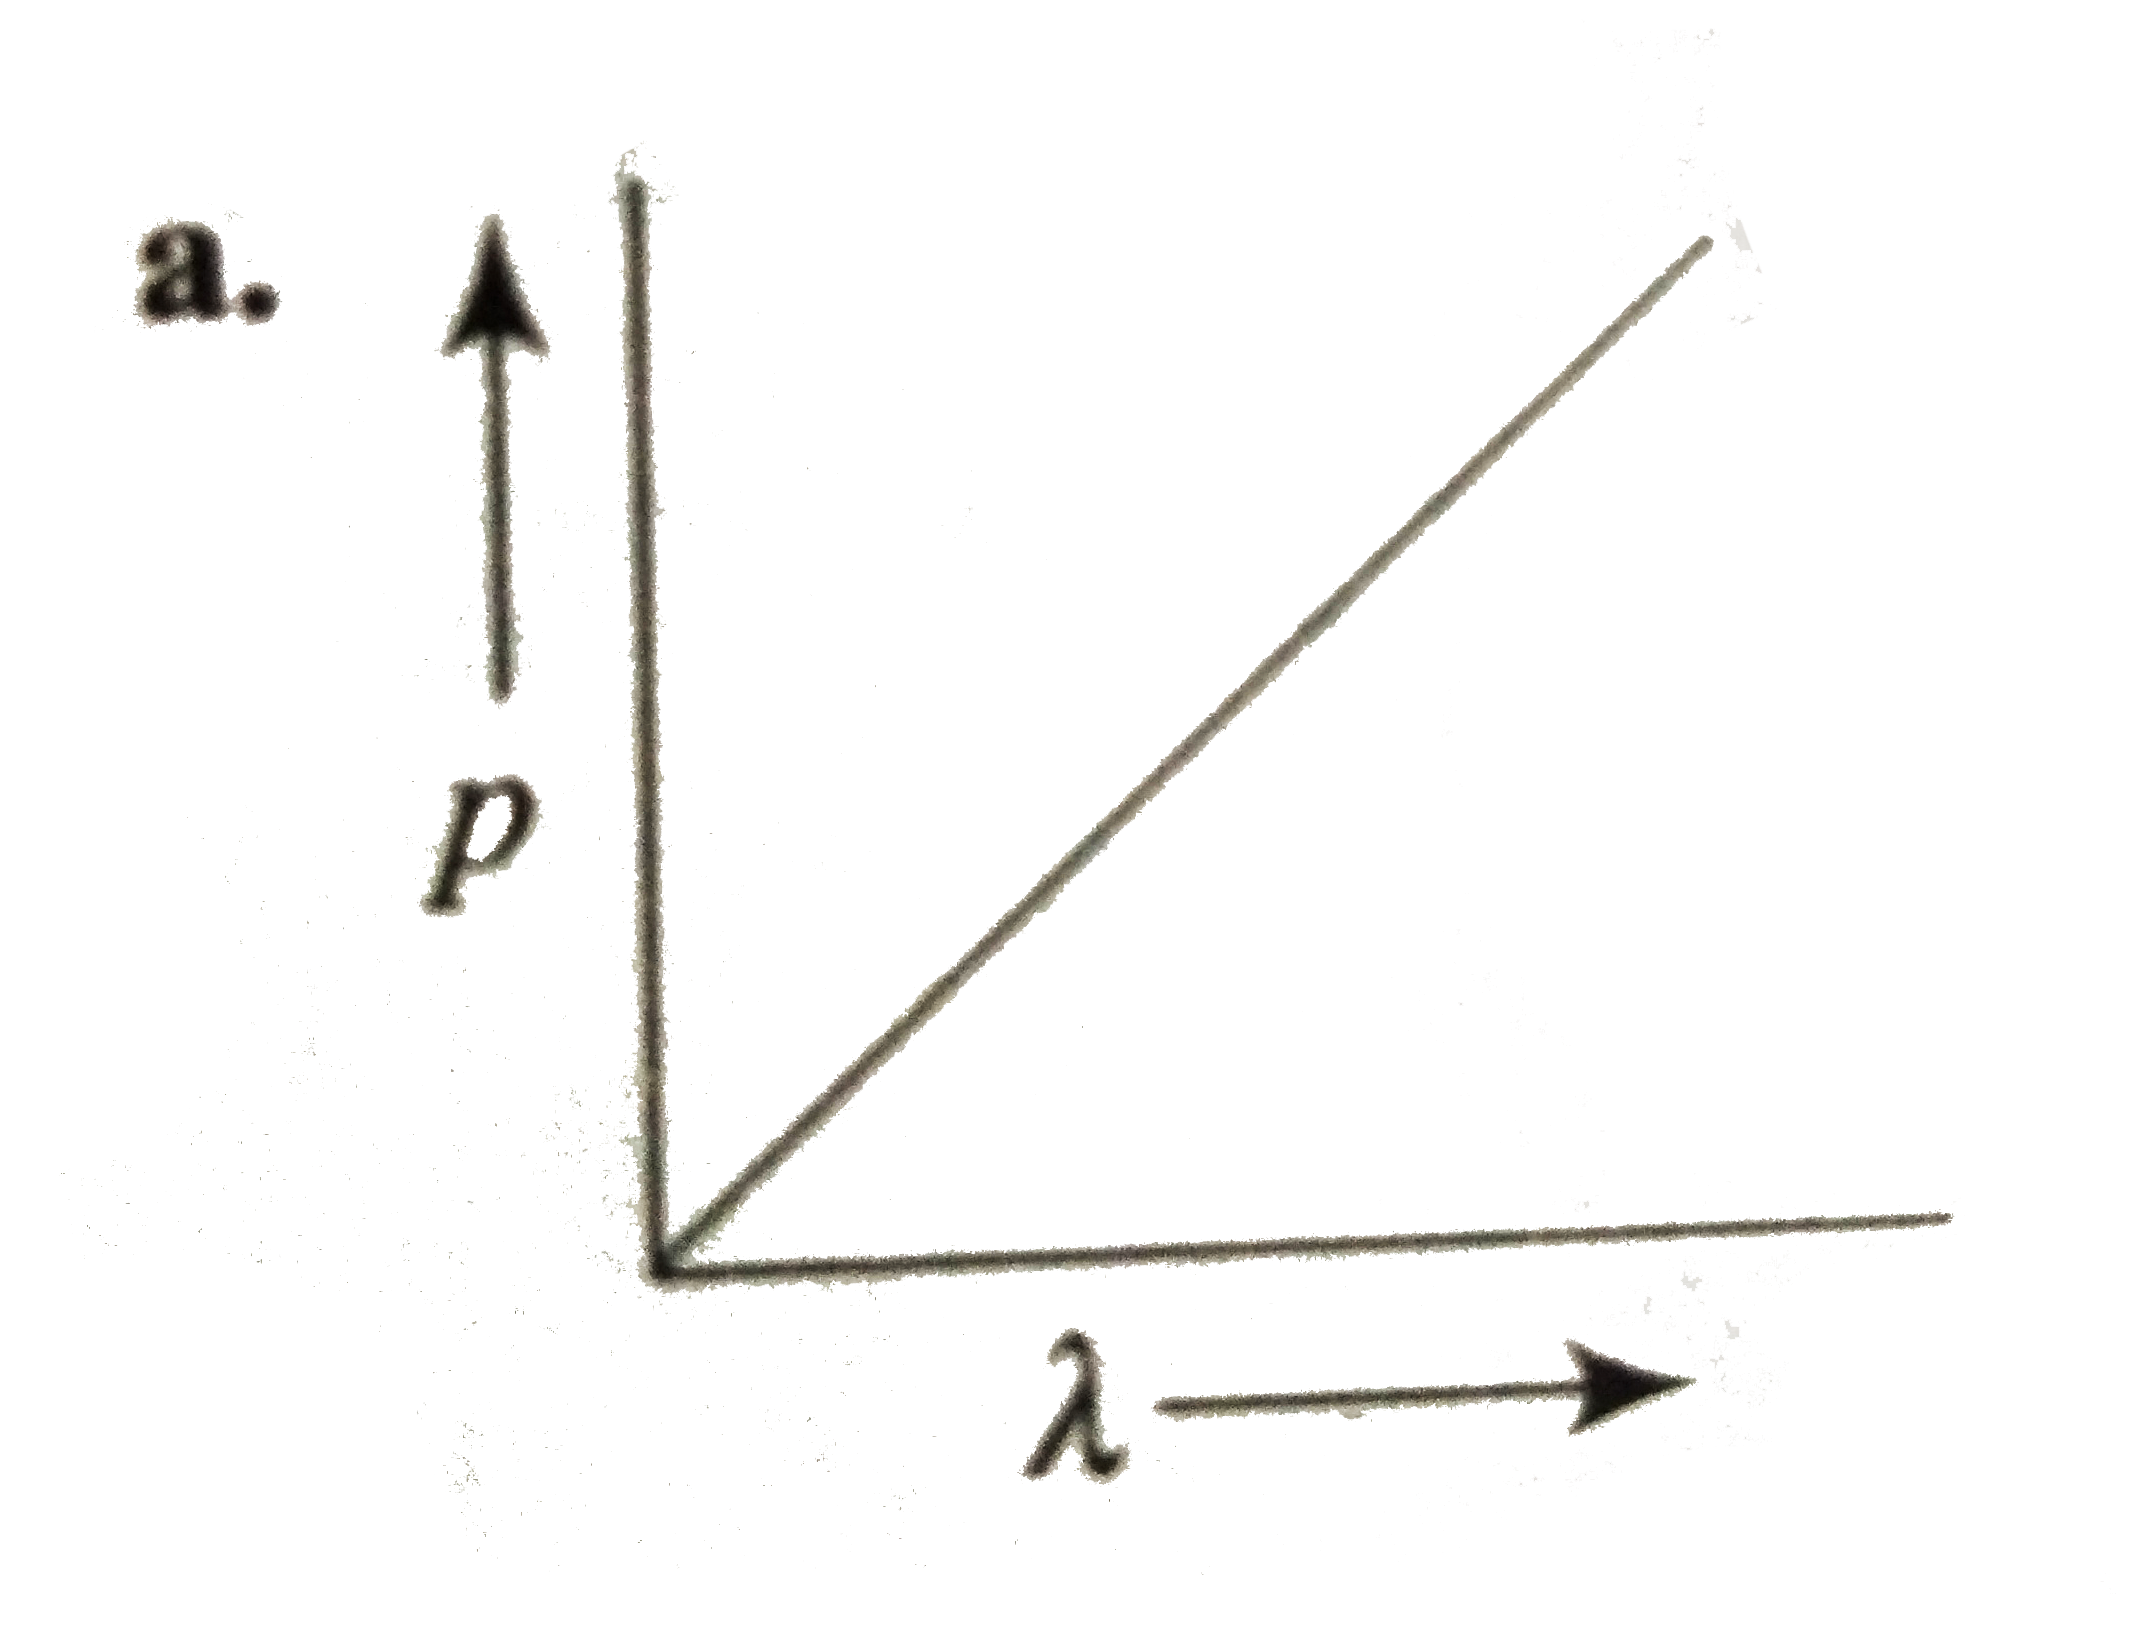
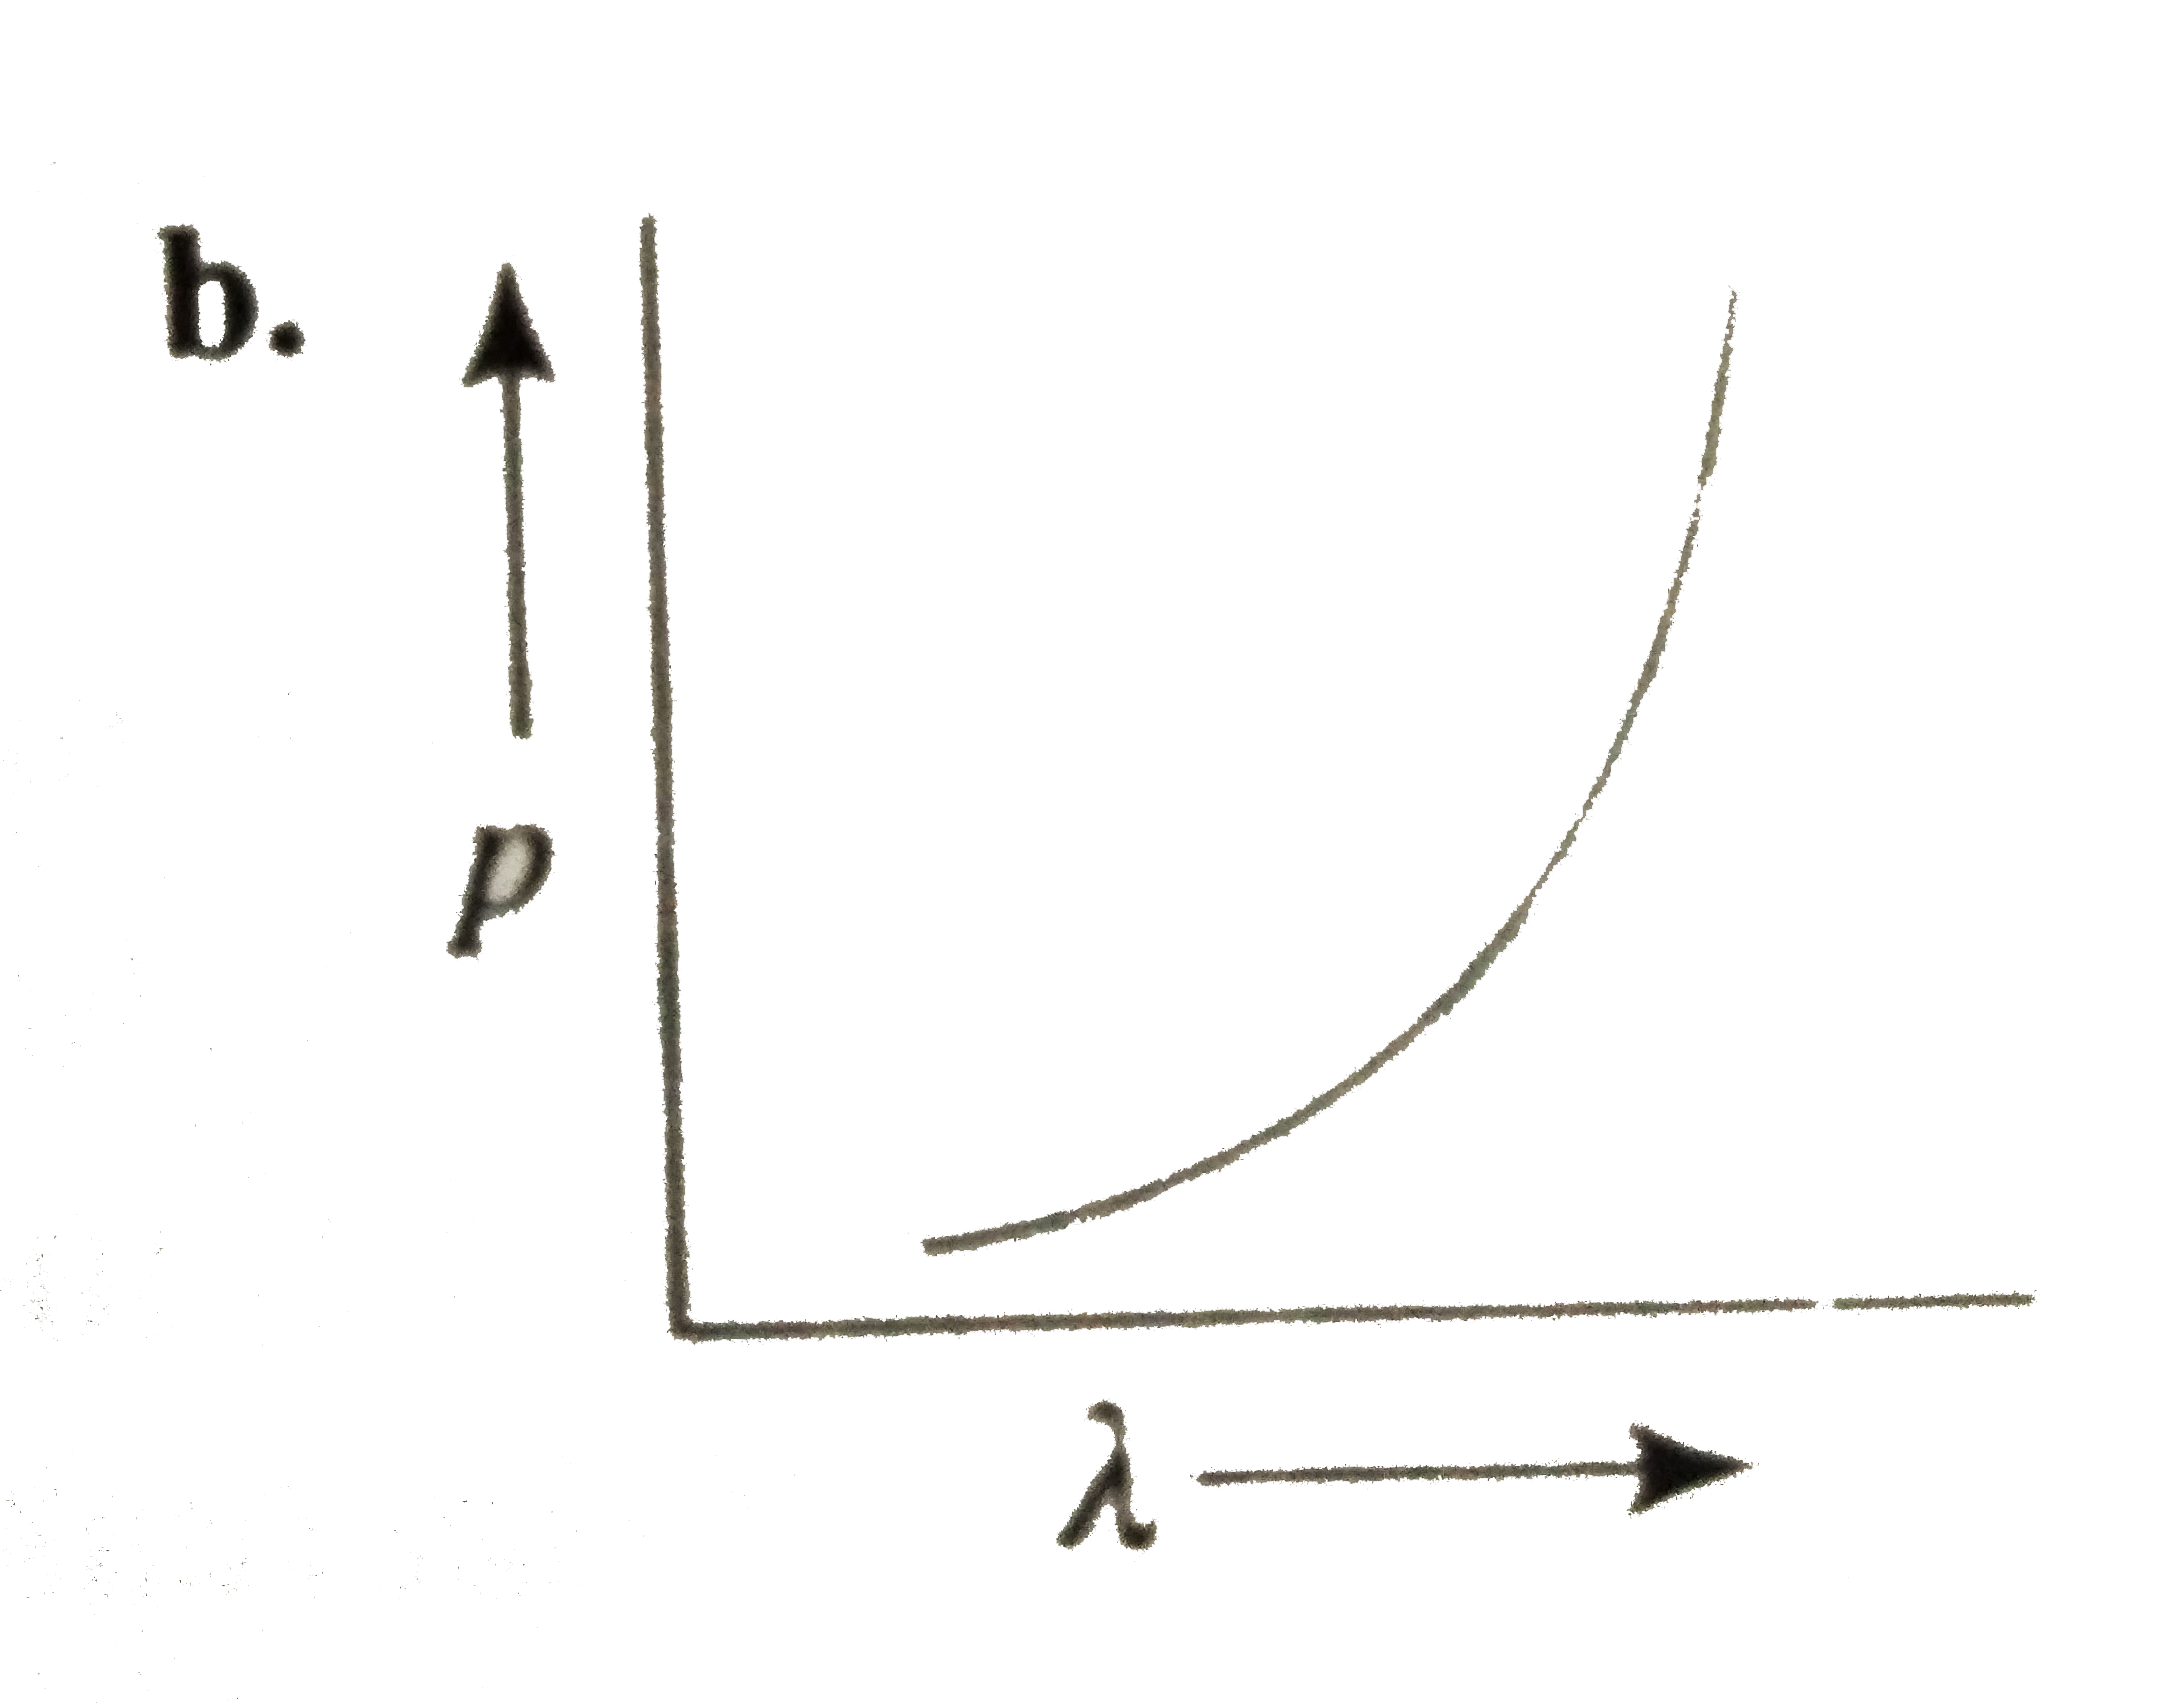
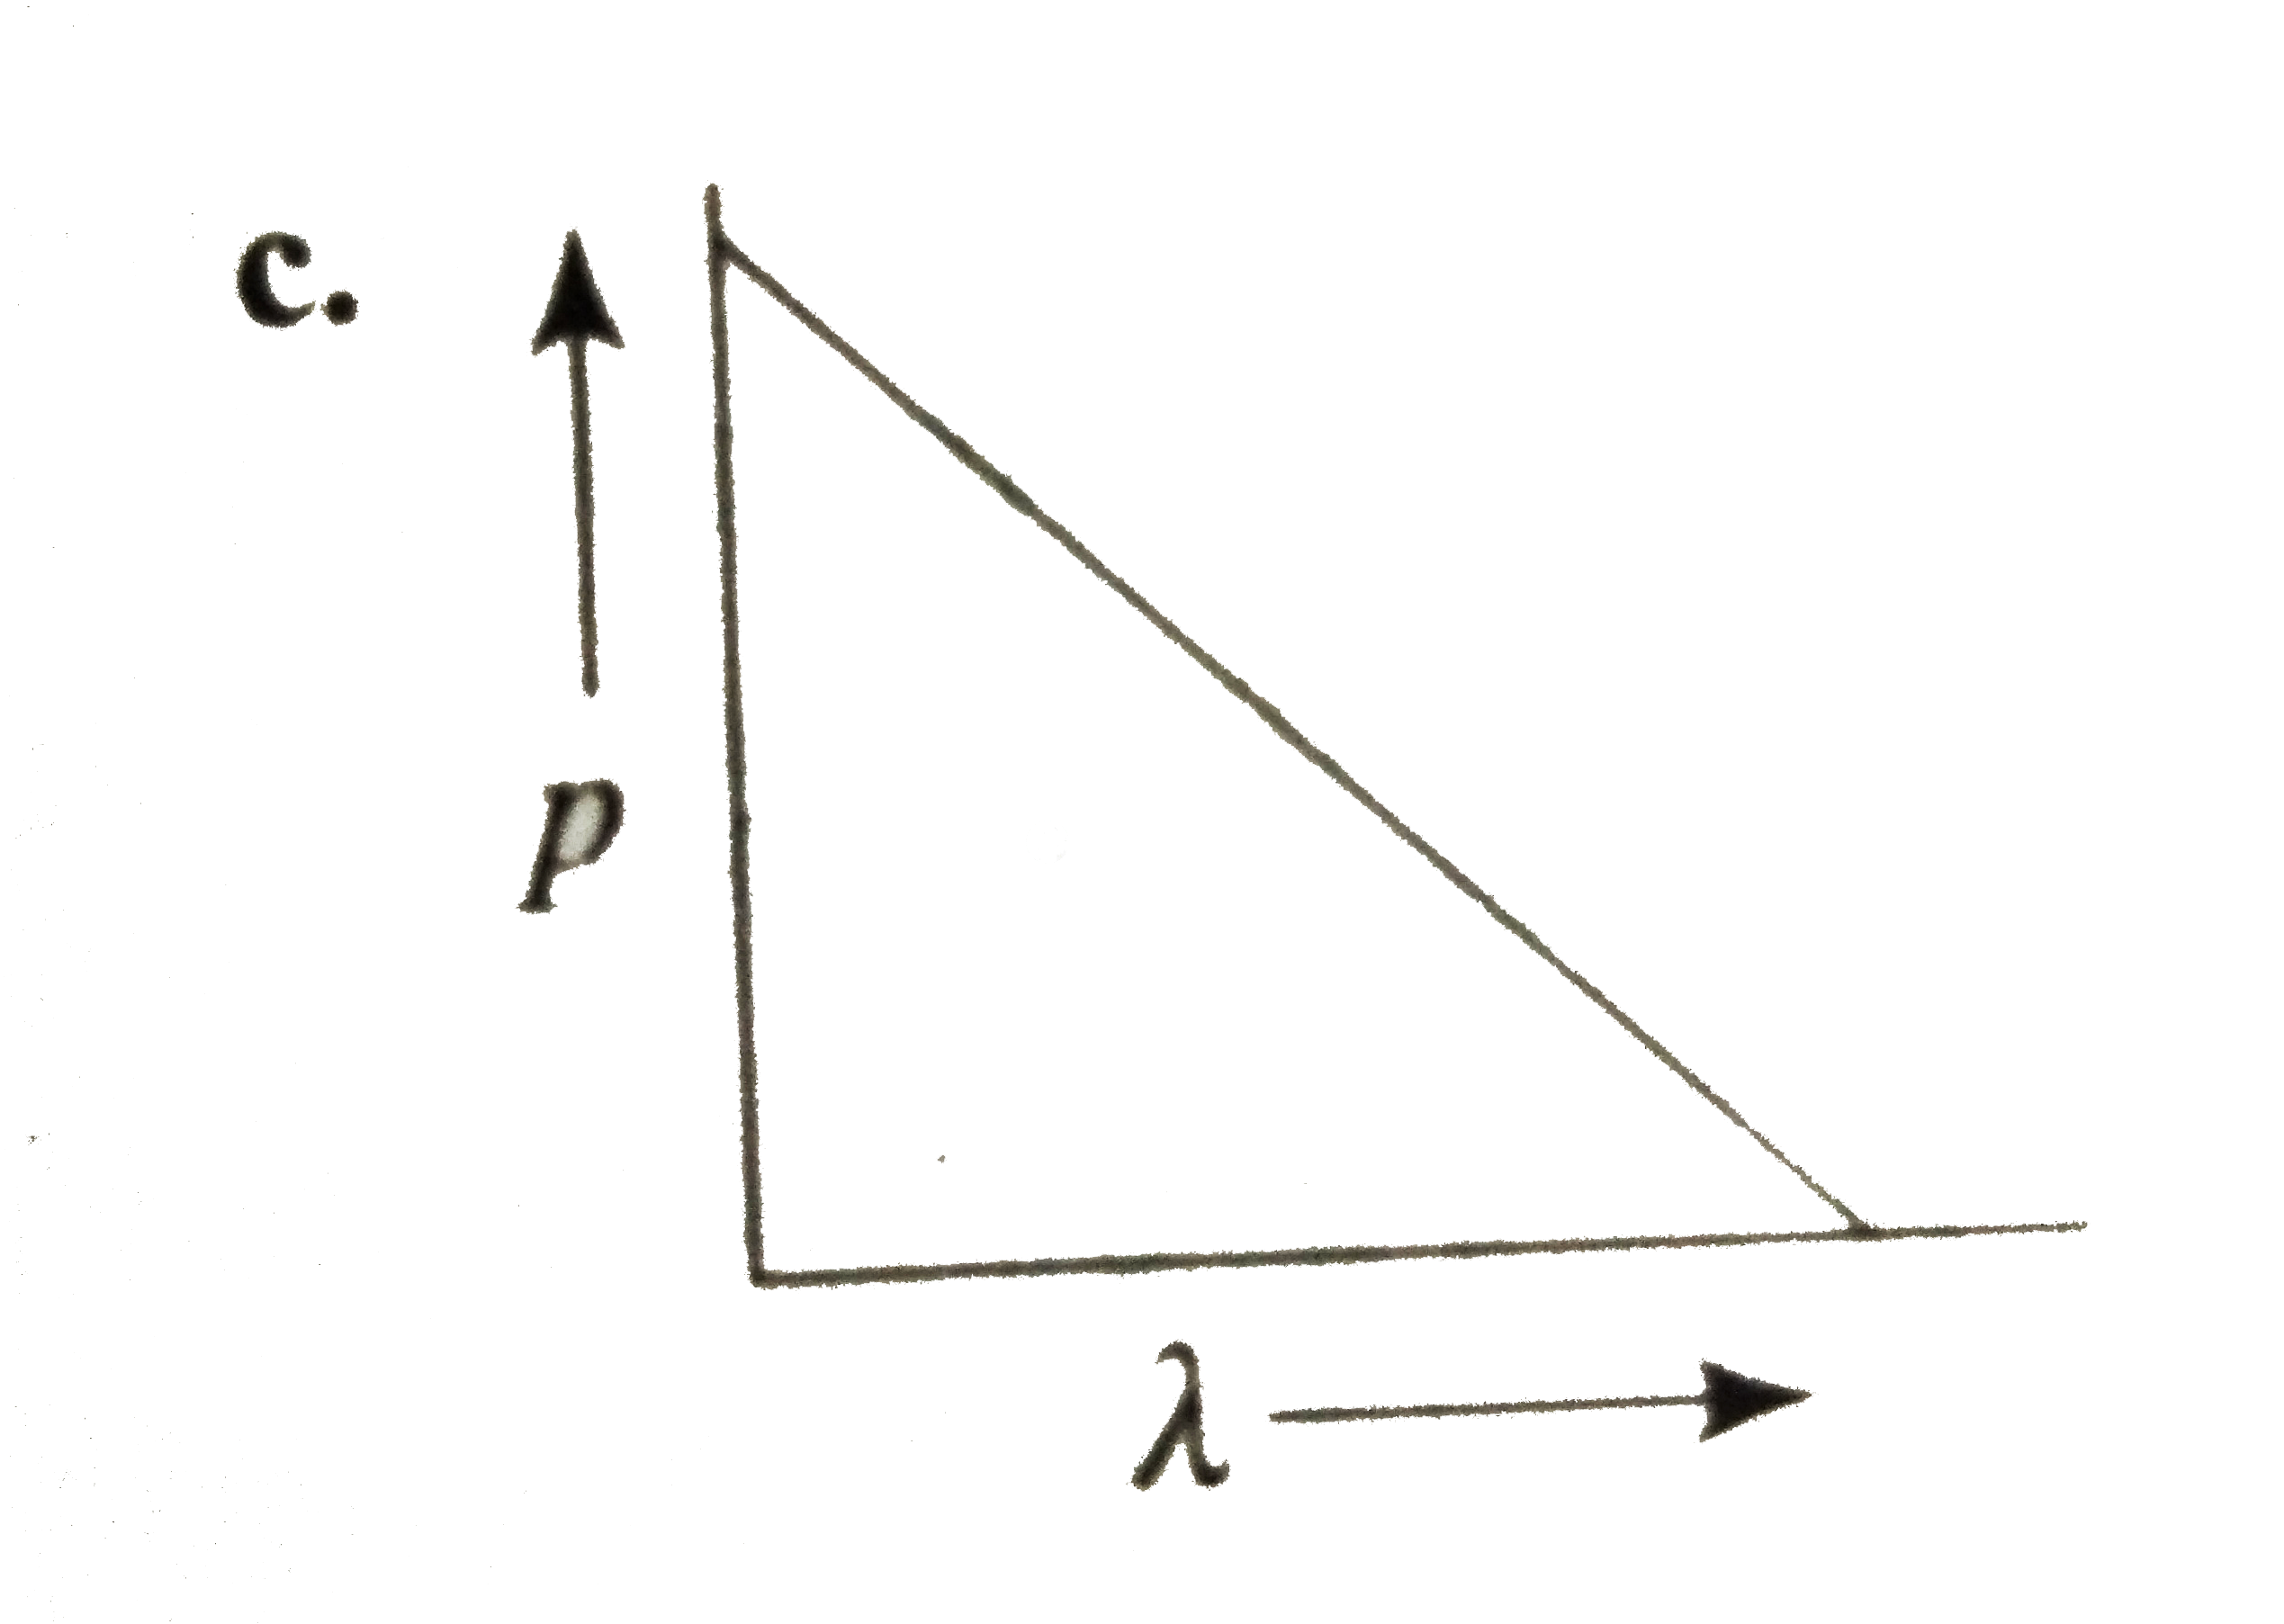
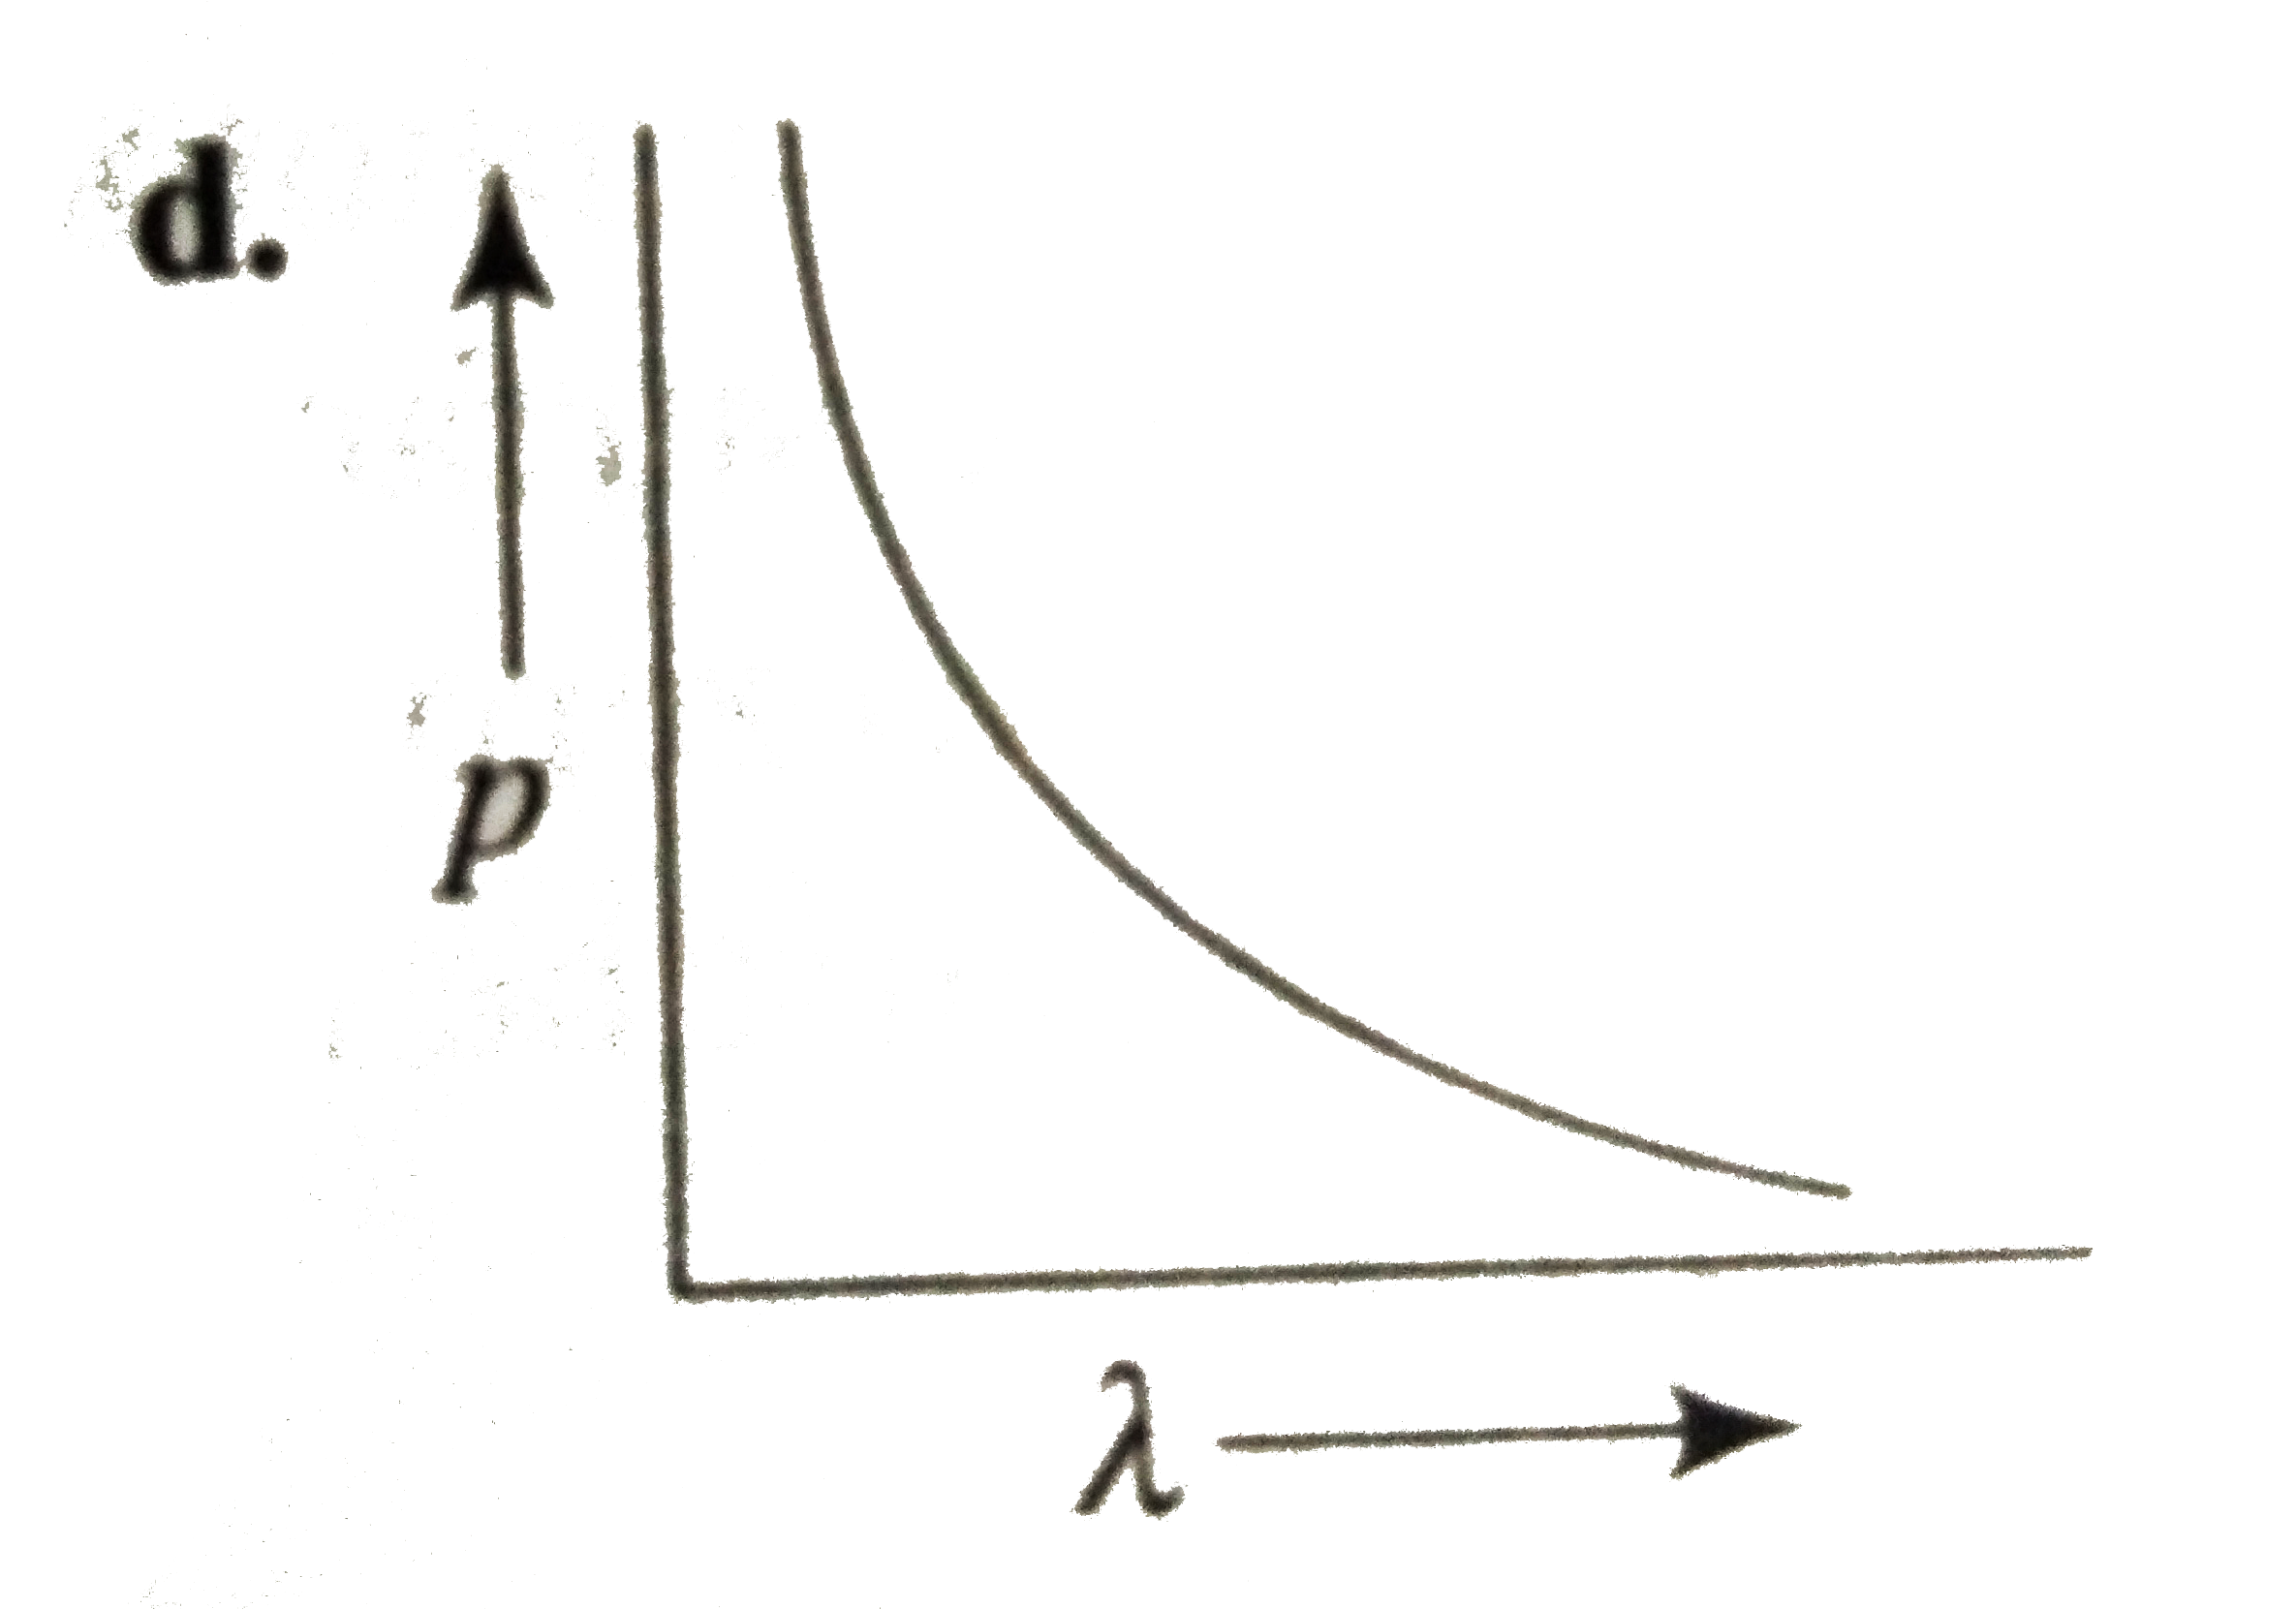
Which of following graphs correctly represents the variation of particle momentum with de-Broglie wavelength?
A
B
C
D
Video Solution
Text Solution
The correct Answer is:D
λ=hp⇒λ∝1p
So, graph between λ and p is a rectangular hyperbola.
|
Topper's Solved these Questions
- PHOTOELECTRIC EFFECTBook:CENGAGE PHYSICS ENGLISHChapter:PHOTOELECTRIC EFFECTExercise:Multiple Correct
Explore 10 Videos
- PHOTOELECTRIC EFFECTBook:CENGAGE PHYSICS ENGLISHChapter:PHOTOELECTRIC EFFECTExercise:Linked Comprehension
Explore 44 Videos
- PHOTOELECTRIC EFFECTBook:CENGAGE PHYSICS ENGLISHChapter:PHOTOELECTRIC EFFECTExercise:Subjective
Explore 16 Videos
- NUCLEAR PHYSICSBook:CENGAGE PHYSICS ENGLISHChapter:NUCLEAR PHYSICSExercise:ddp.5.5
Explore 14 Videos
- RAY OPTICSBook:CENGAGE PHYSICS ENGLISHChapter:RAY OPTICSExercise:DPP 1.6
Explore 12 Videos
Similar Questions
Knowledge Check
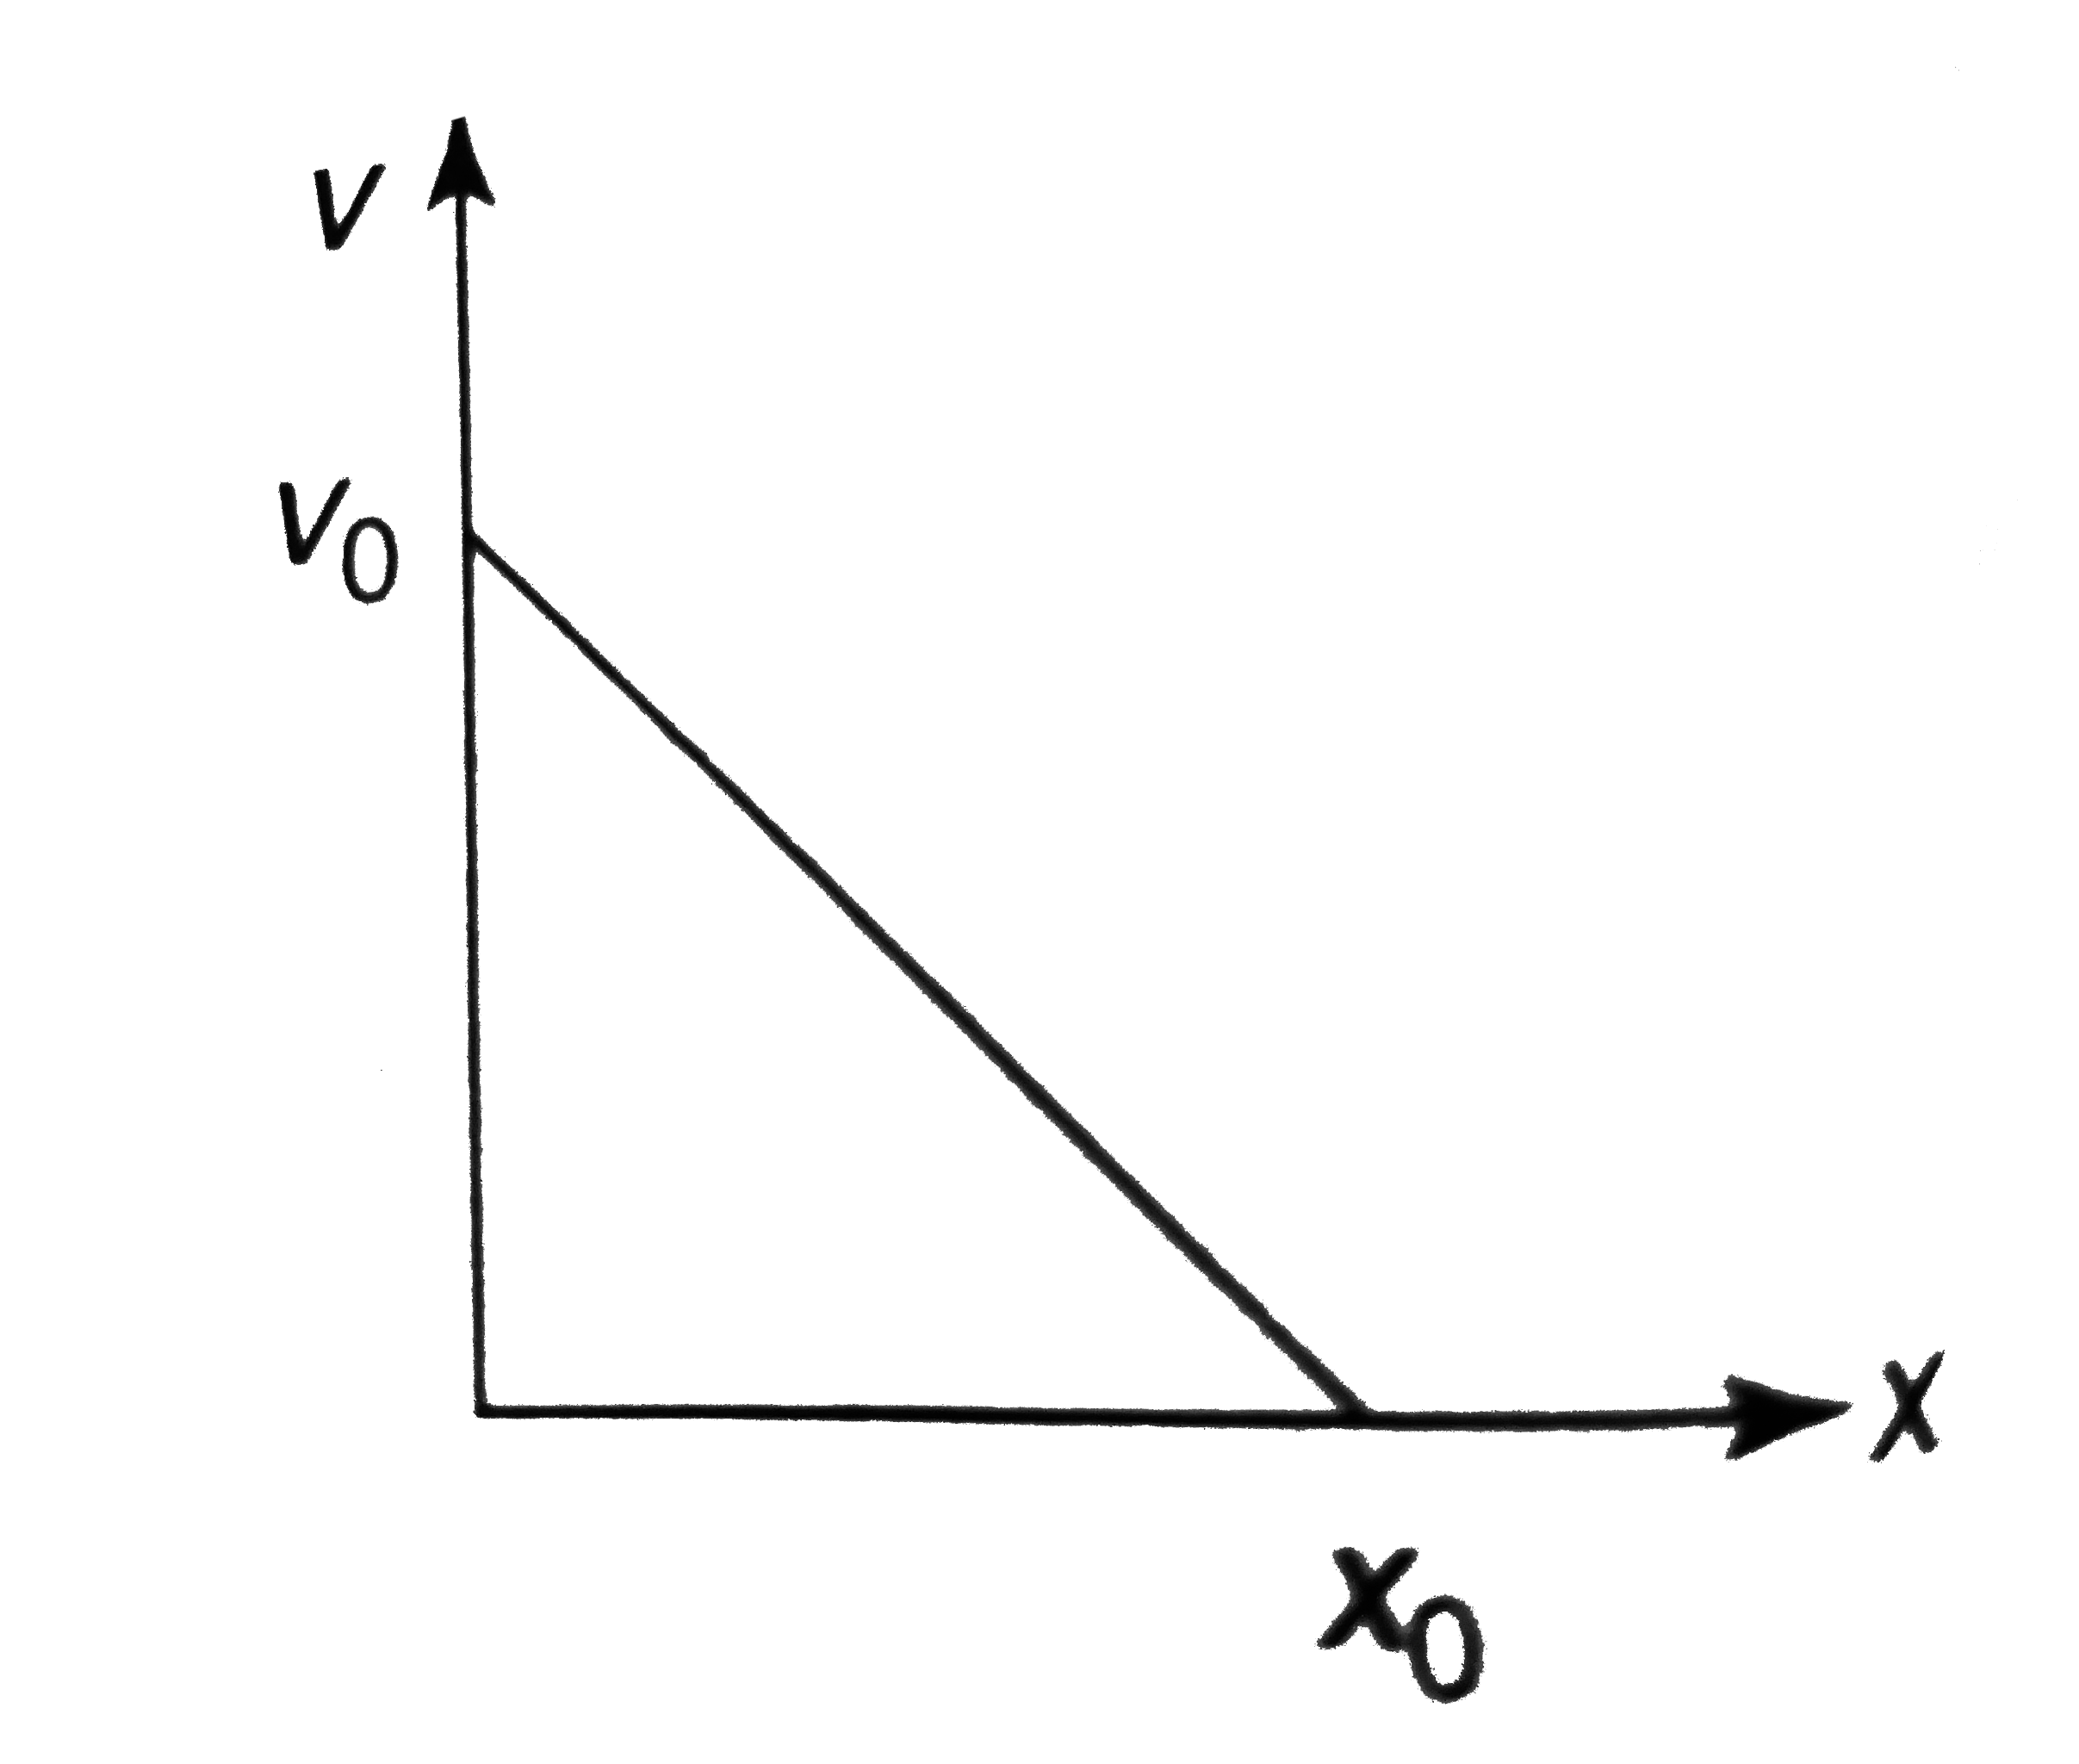
The velocity -displacement graph of a particle is as shown in the figure. Which of the following graphs correctly represents the variation of acceleration with displacement?
 A
A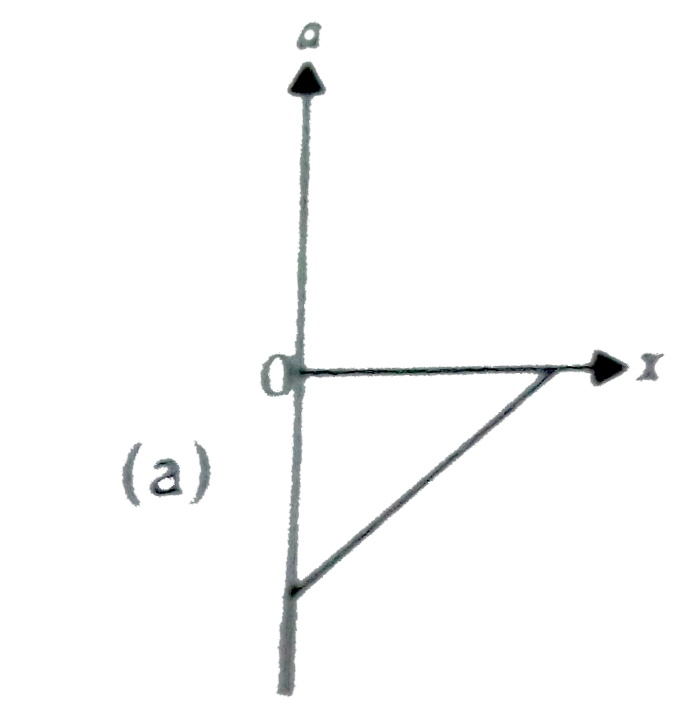 B
B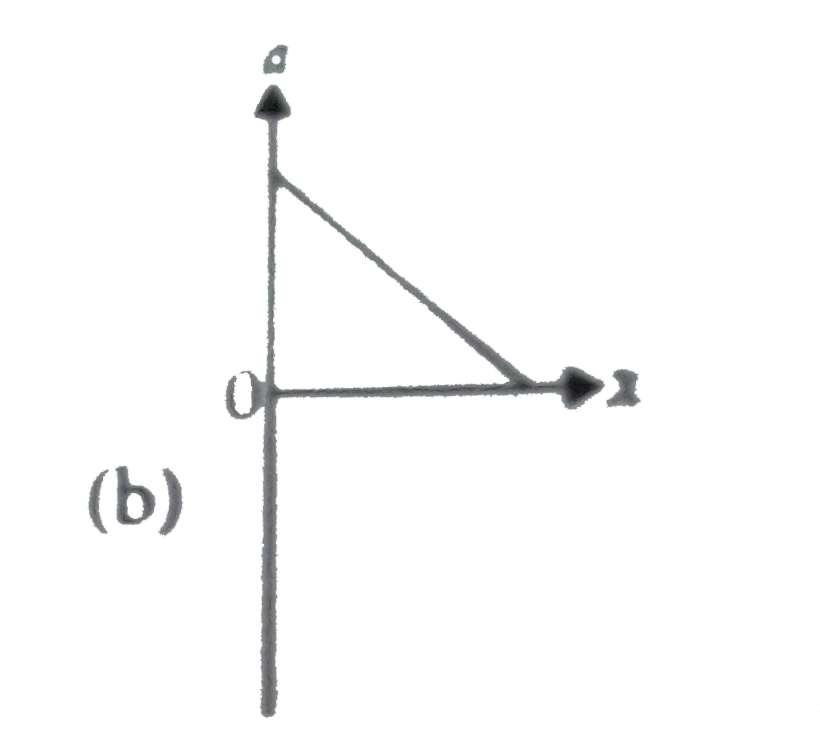 C
C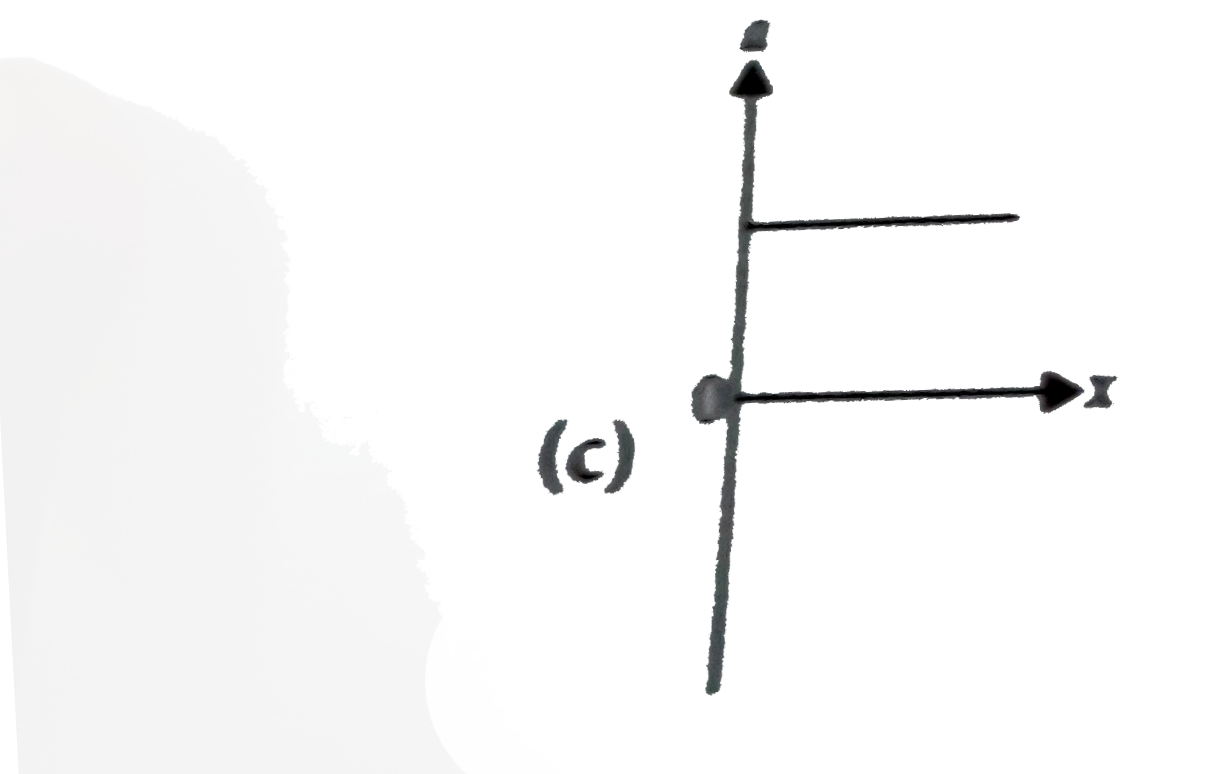 D
D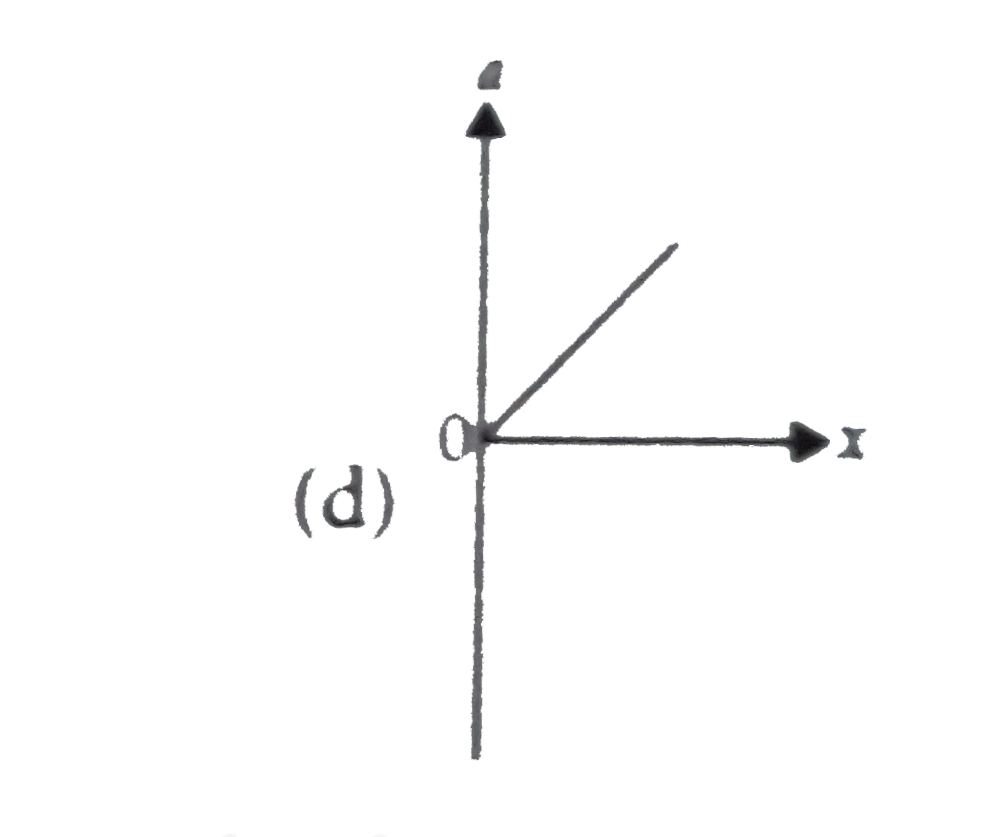
Which of the following figure represents the variation of particle momentum and the associated de - Broglie wavelength ?
A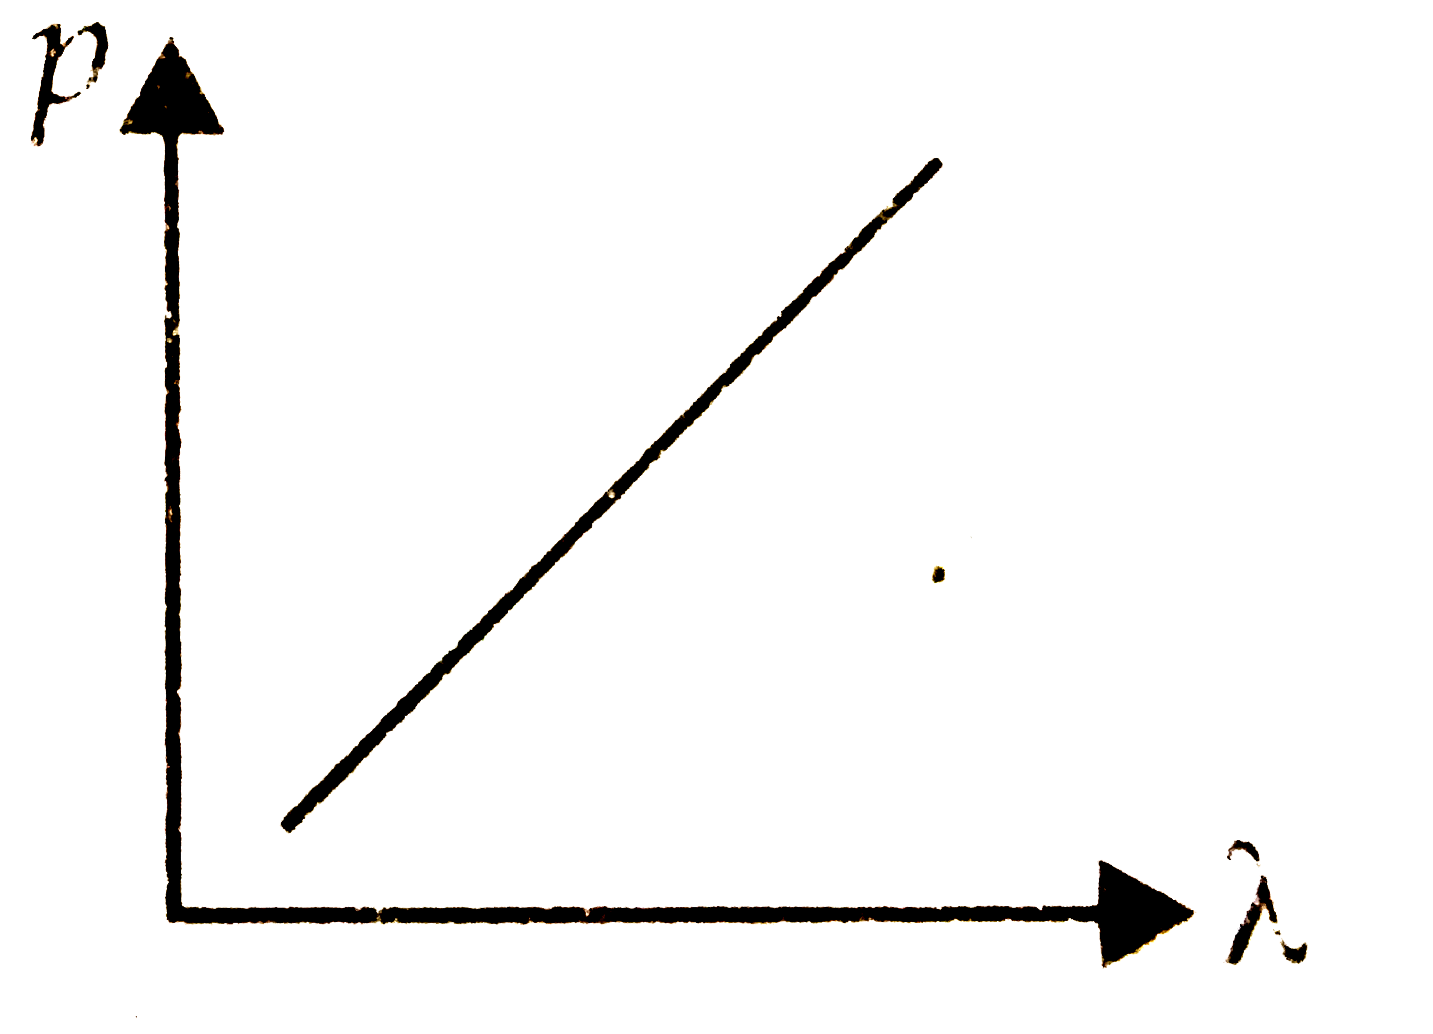 B
B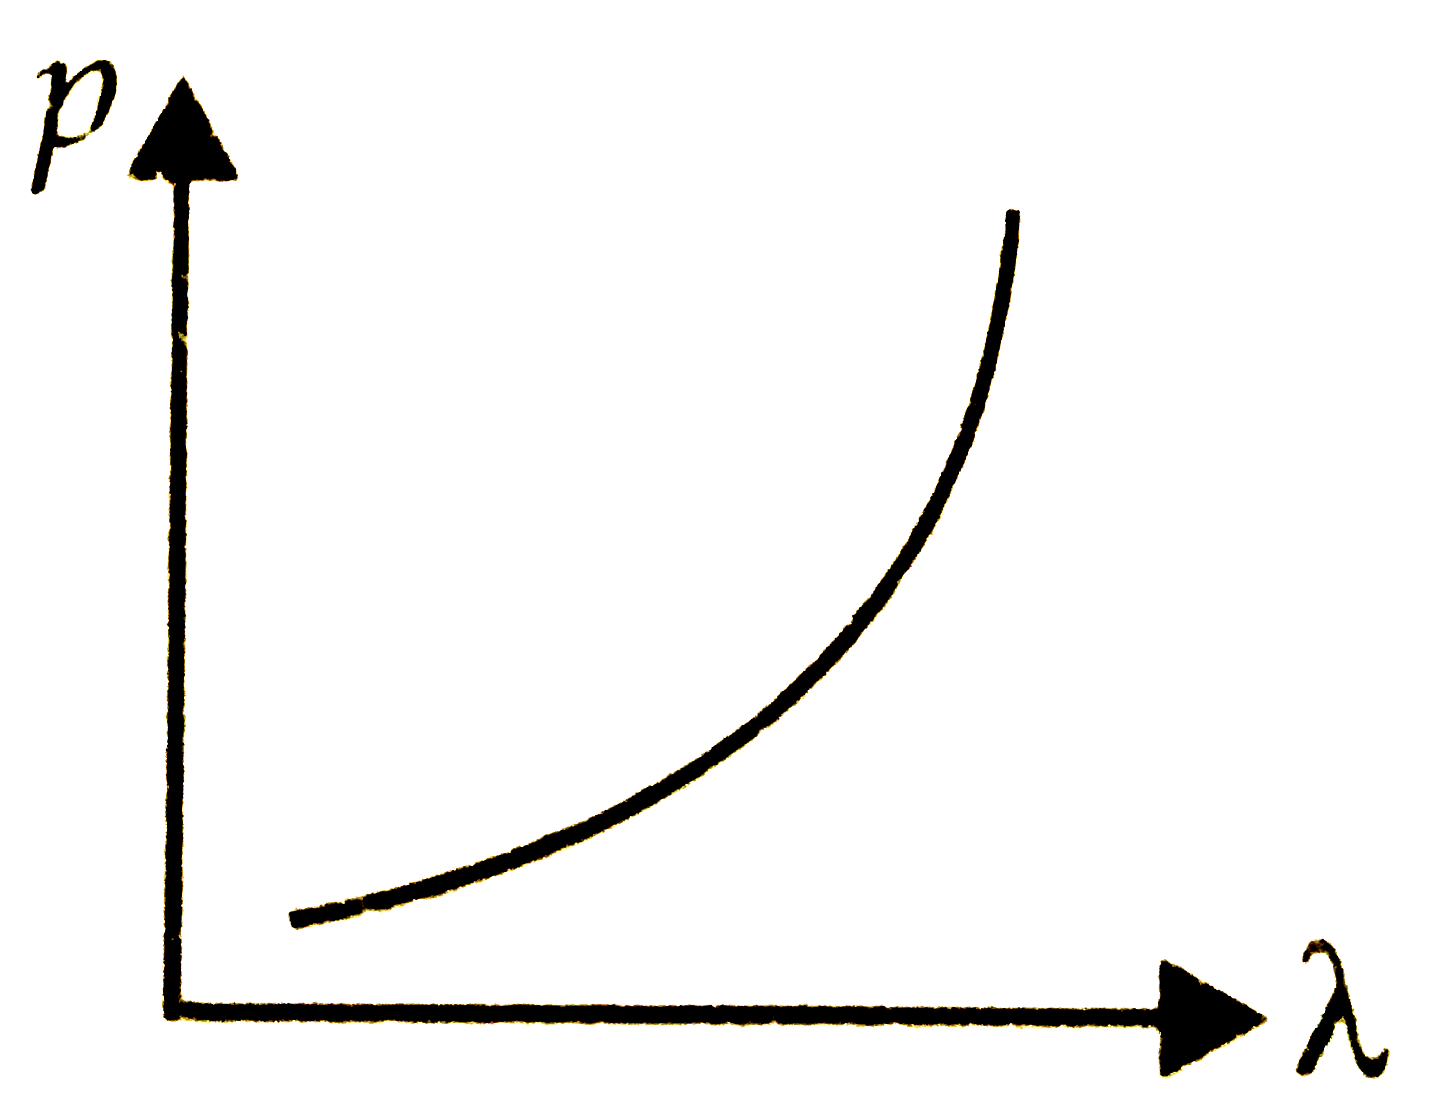 C
C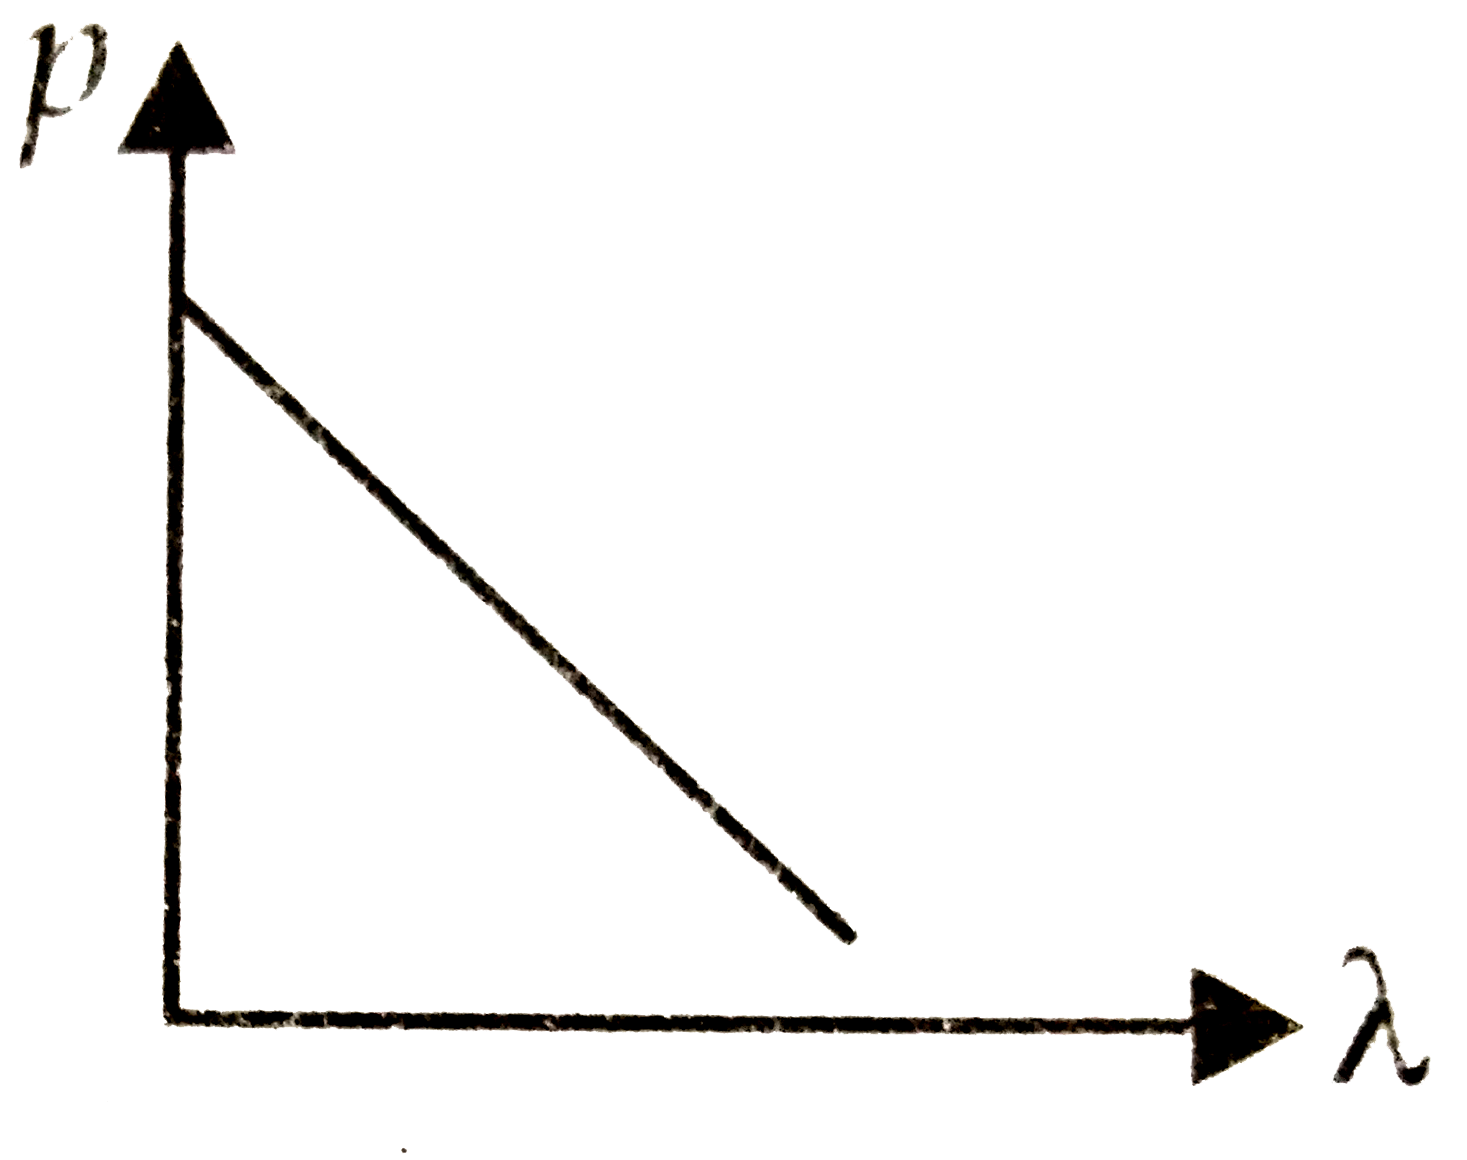 D
D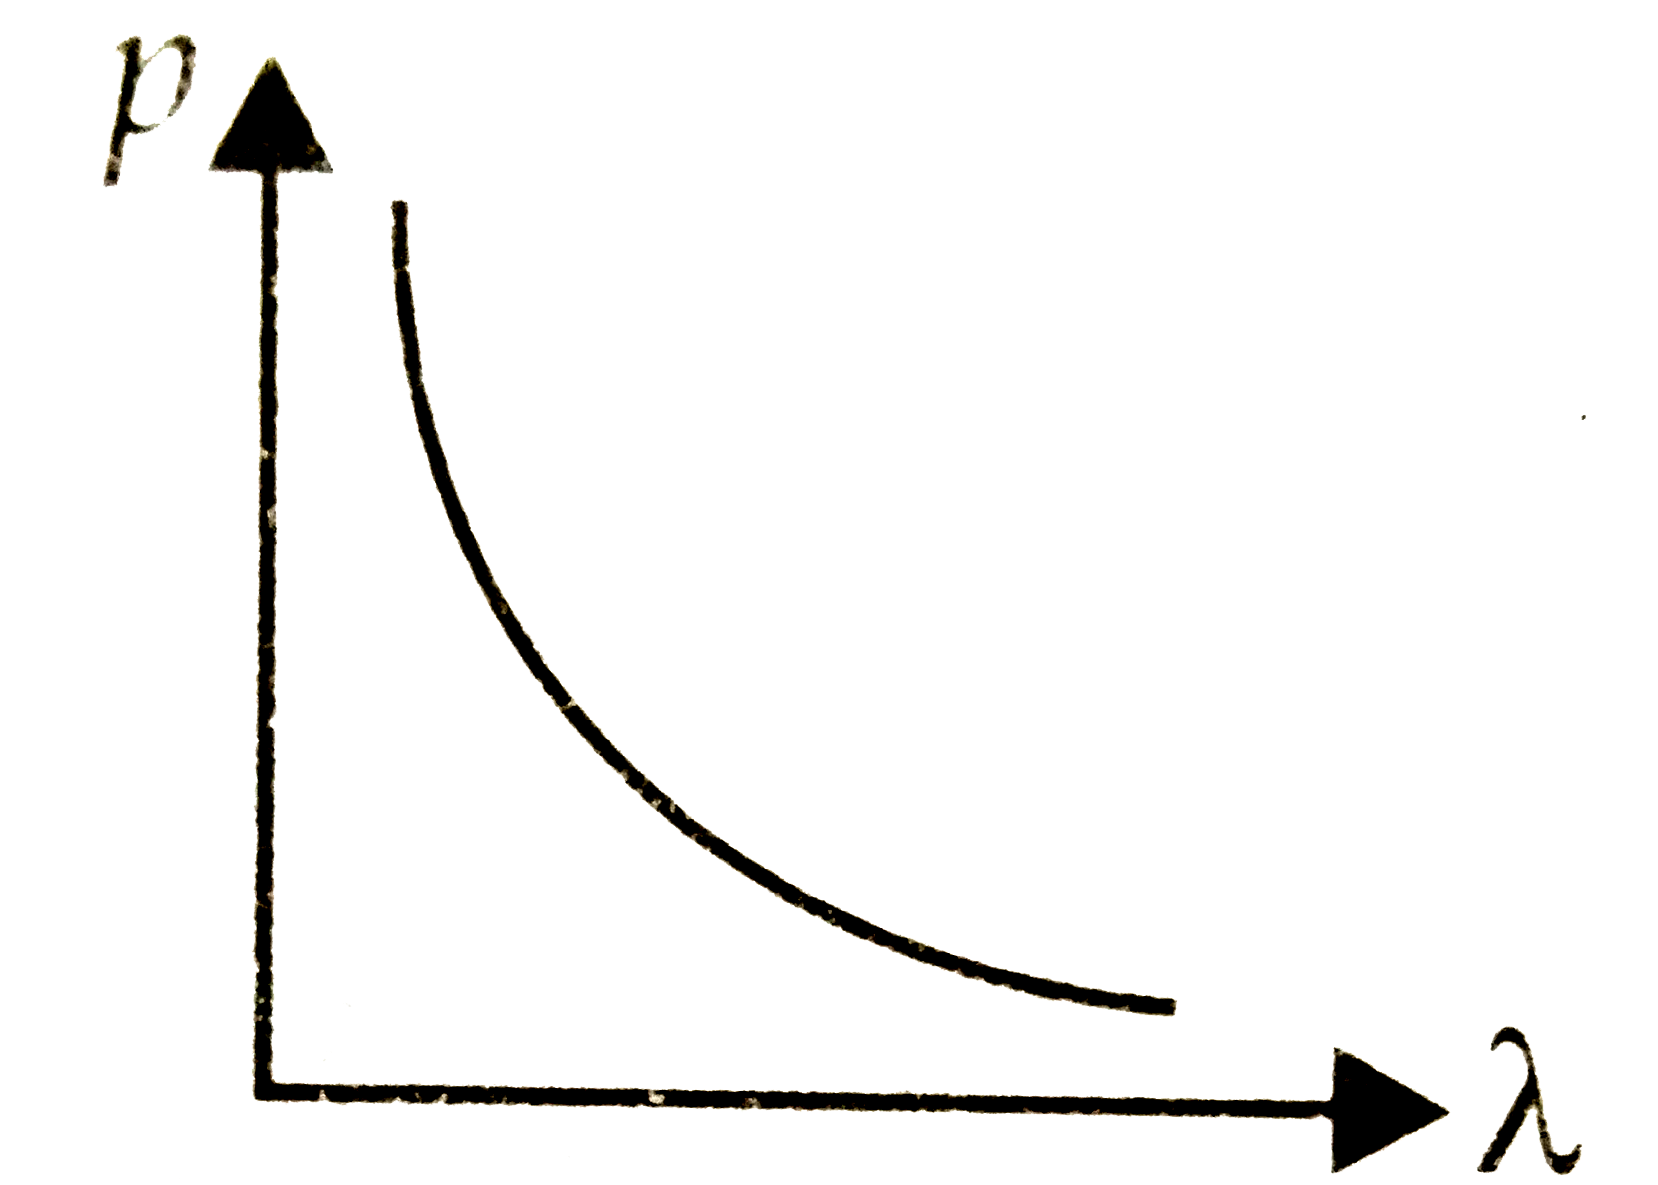
Within elastic limit, which of the following graphs correctly represents the variation of extension in the length of wire with the external load?
A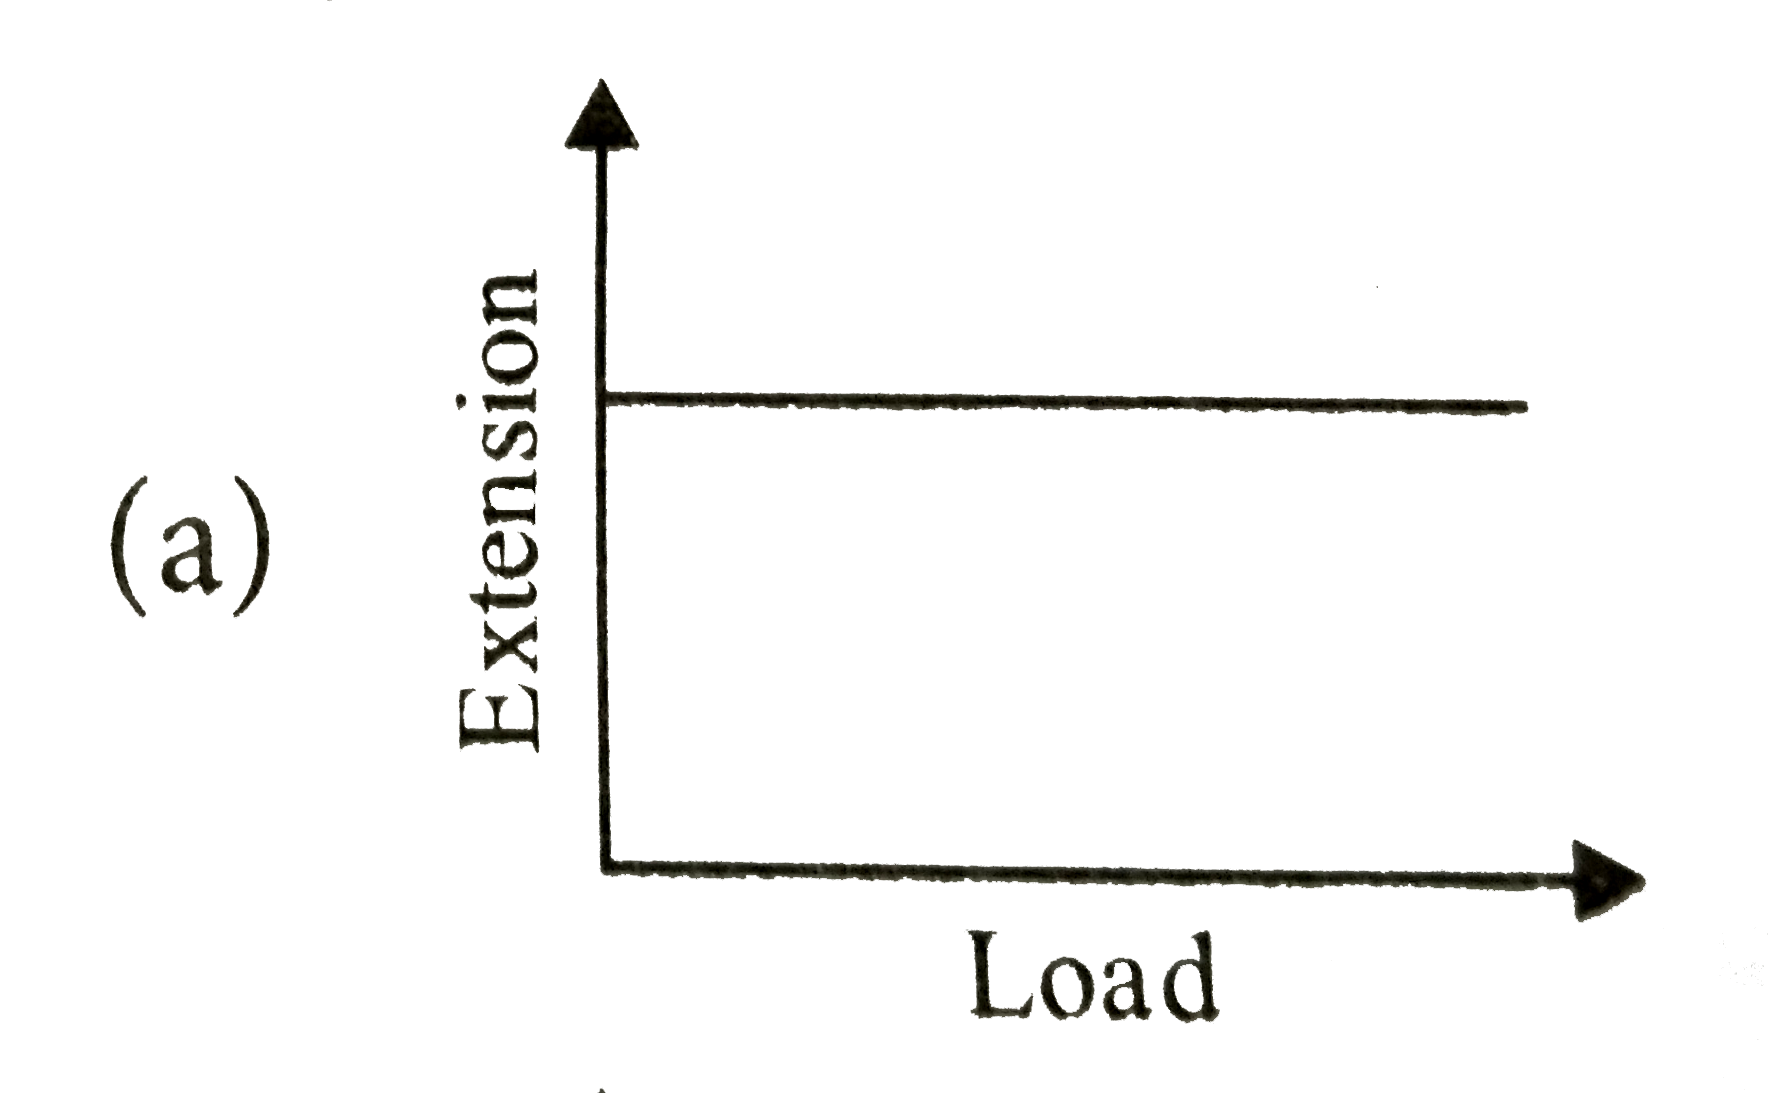 B
B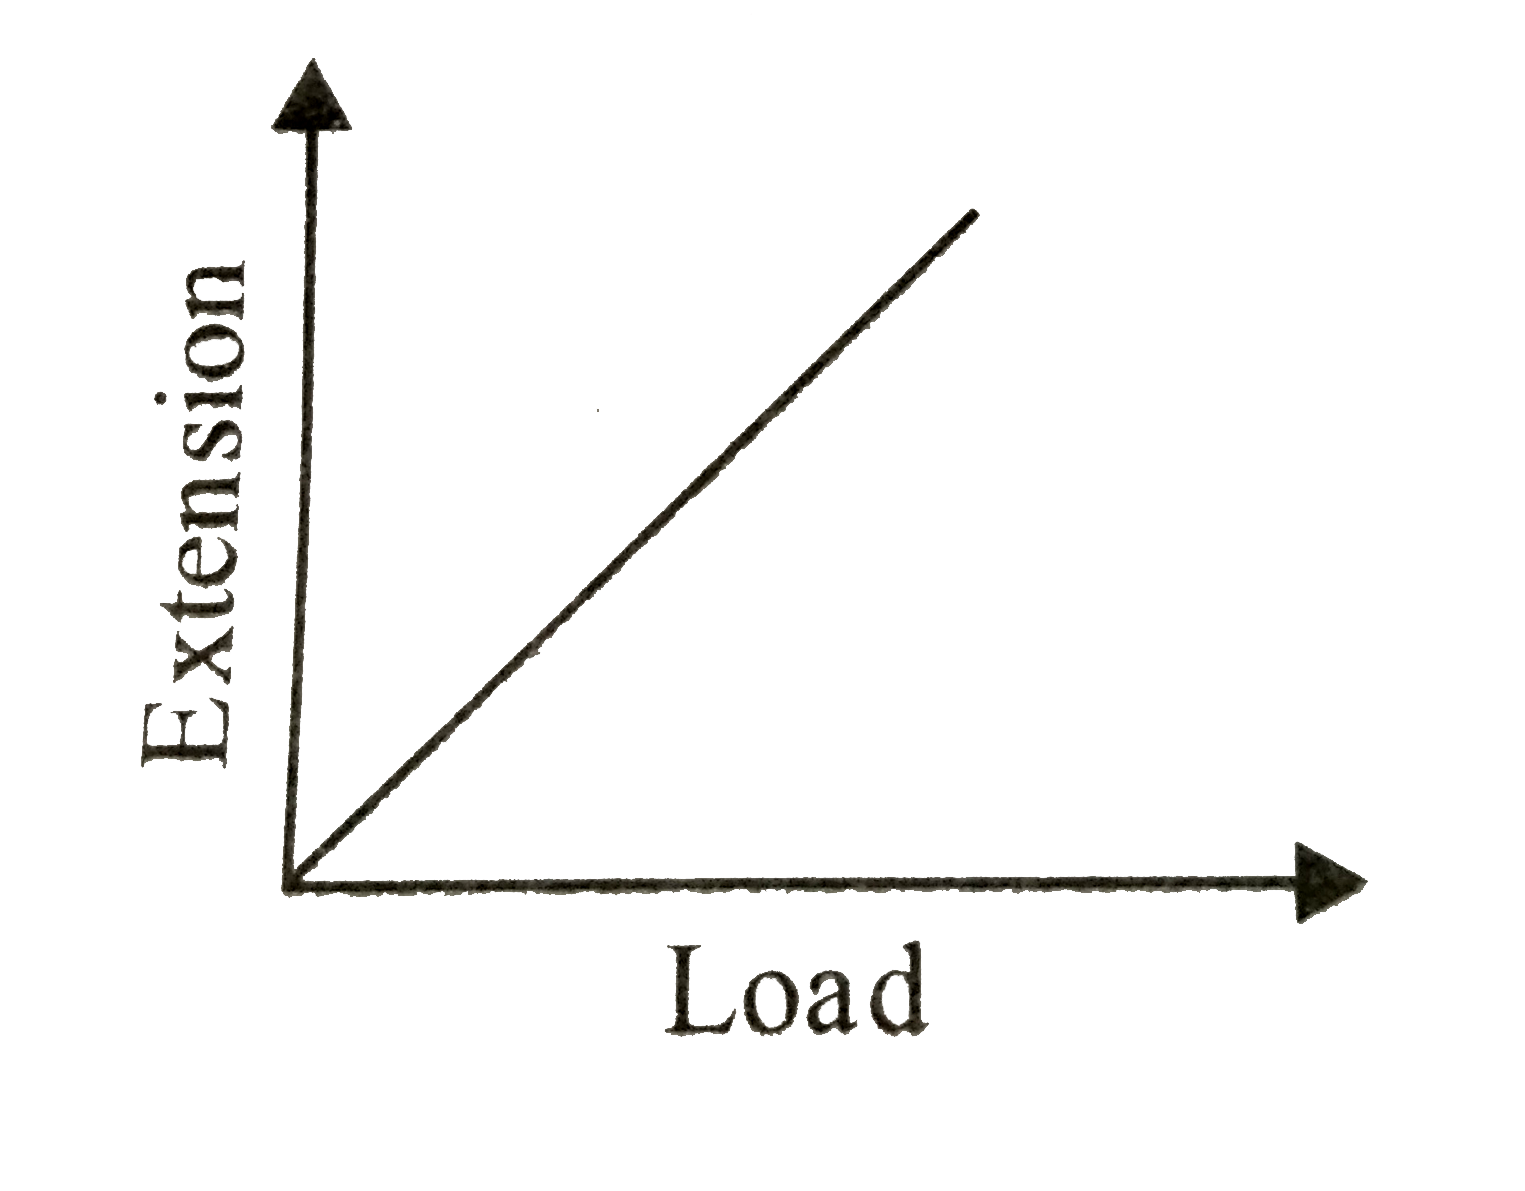 C
C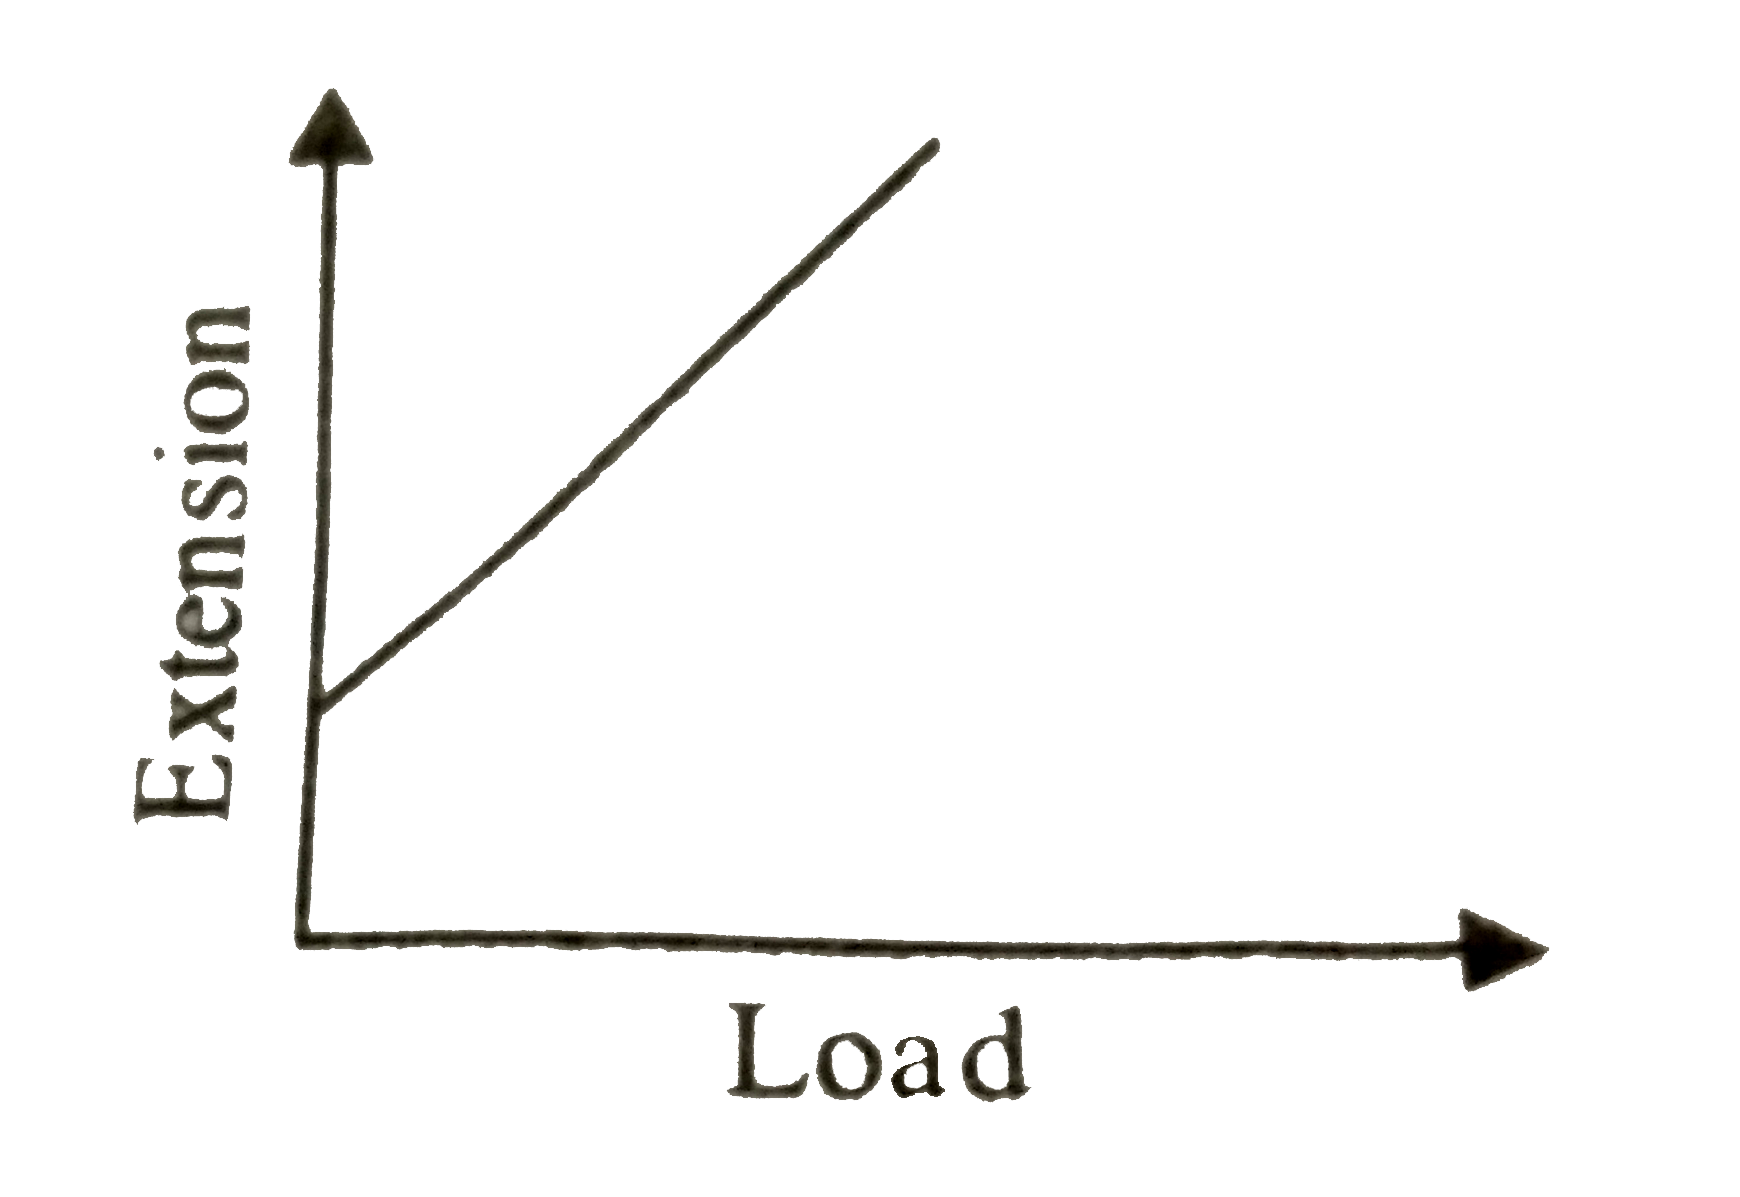 D
D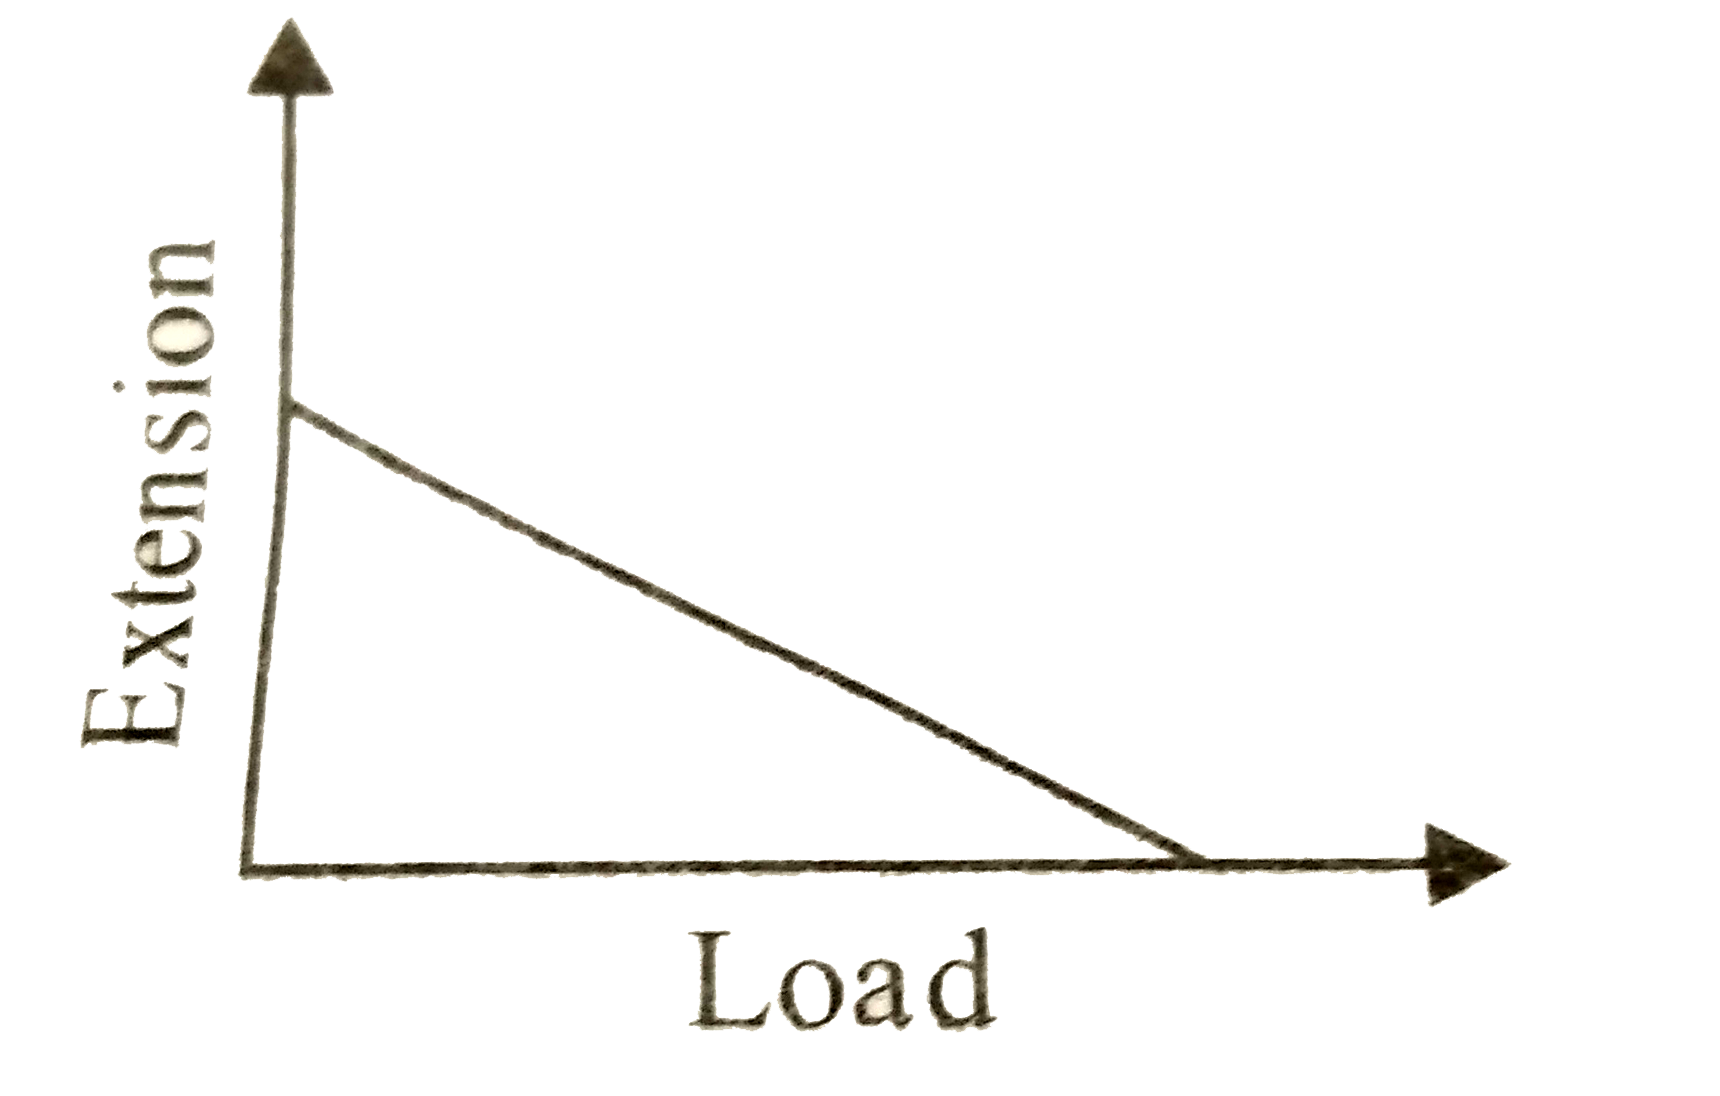
Which of the following graphs best represents the variation of acceleration 'a' with displacement x?
View SolutionWhich of the following graphs correctly represents the variation of β=−dV/dPV
with P for an ideal gas at constant temperature?
View SolutionWhich of the following graphs correctly represents the variation of β=−dV/dPV
with P for an ideal gas at constant temperature?
View SolutionWhich of the following graphs correctly represents the variation of β=−(dVdP)/V with P for an ideal gas at constant temperature
View SolutionThe given graph shows the variation of velocity with displacement. Which one of the graphs given below correctly represents the variation of acceleration with displacement ?
View Solution