A rebber ball is released from a height aboout 1.5m. If is caught after three bounces. Skerch graphs of ist position, velocity, and acceleration as functions of time. Take positive y-direction as upwrad direction.
To solve the problem of sketching the graphs of position, velocity, and acceleration of a rubber ball released from a height of 1.5 meters and caught after three bounces, we can follow these steps:
Step 1: Understanding the Motion
1. The ball is released from a height of 1.5 meters.
2. It will fall under the influence of gravity, bounce back, and lose some energy with each bounce.
3. We will consider the upward direction as positive.
Step 2: Position vs. Time Graph
1. Initial Position: The ball starts at a height of 1.5 m.
2. Free Fall: As the ball falls, its position decreases until it reaches the ground (0 m).
3. First Bounce: The ball bounces back to a height less than 1.5 m (due to energy loss).
4. Subsequent Bounces: Each subsequent bounce reaches a lower height than the previous one.
5. Final Position: After three bounces, the ball is caught, which means its position returns to 0 m.
Sketch: The position graph will start at 1.5 m, drop to 0 m, then rise to a height less than 1.5 m, drop again to 0 m, rise to a height even lower, drop to 0 m, and finally remain at 0 m when caught.
Step 3: Velocity vs. Time Graph
1. Falling Phase: Initially, the velocity is 0. As the ball falls, it gains negative velocity (downward).
2. At Ground Level: When it hits the ground, the velocity is momentarily 0 before bouncing back up.
3. Bouncing Up: The ball bounces back with a positive velocity (upward) but less than the velocity it had while falling.
4. Subsequent Bounces: Each time it bounces, the peak velocity decreases due to energy loss.
Sketch: The velocity graph will show a downward slope (negative velocity) as it falls, a spike upwards (positive velocity) after each bounce, and the spikes will get shorter with each bounce.
Step 4: Acceleration vs. Time Graph
1. During Free Fall: The acceleration is constant and equal to -g (approximately -9.81 m/s²) while the ball is falling.
2. At the Bounce: When the ball hits the ground, there is a sudden change in acceleration (impulse), but it will still be negative as it bounces back up.
3. During the Bounce: The acceleration will briefly be positive (upward) as it rebounds but will return to -g during the free fall.
Sketch: The acceleration graph will show a constant negative value during the fall, a brief spike upwards during the bounce, and then return to the negative value.
Final Graphs
- Position vs. Time: A curve that starts at 1.5 m, drops to 0 m, bounces up to lower heights, and remains at 0 m.
- Velocity vs. Time: A graph that shows negative values while falling, spikes upwards for each bounce, with decreasing heights for each spike.
- Acceleration vs. Time: A constant negative value during free fall, brief positive spikes during bounces, returning to negative.
1. The ball is released from a height of 1.5 meters.
2. It will fall under the influence of gravity, bounce back, and lose some energy with each bounce.
3. We will consider the upward direction as positive.
1. Initial Position: The ball starts at a height of 1.5 m.
2. Free Fall: As the ball falls, its position decreases until it reaches the ground (0 m).
3. First Bounce: The ball bounces back to a height less than 1.5 m (due to energy loss).
4. Subsequent Bounces: Each subsequent bounce reaches a lower height than the previous one.
5. Final Position: After three bounces, the ball is caught, which means its position returns to 0 m.
1. Falling Phase: Initially, the velocity is 0. As the ball falls, it gains negative velocity (downward).
2. At Ground Level: When it hits the ground, the velocity is momentarily 0 before bouncing back up.
3. Bouncing Up: The ball bounces back with a positive velocity (upward) but less than the velocity it had while falling.
4. Subsequent Bounces: Each time it bounces, the peak velocity decreases due to energy loss.
1. During Free Fall: The acceleration is constant and equal to -g (approximately -9.81 m/s²) while the ball is falling.
2. At the Bounce: When the ball hits the ground, there is a sudden change in acceleration (impulse), but it will still be negative as it bounces back up.
3. During the Bounce: The acceleration will briefly be positive (upward) as it rebounds but will return to -g during the free fall.
- Position vs. Time: A curve that starts at 1.5 m, drops to 0 m, bounces up to lower heights, and remains at 0 m.
- Velocity vs. Time: A graph that shows negative values while falling, spikes upwards for each bounce, with decreasing heights for each spike.
- Acceleration vs. Time: A constant negative value during free fall, brief positive spikes during bounces, returning to negative.
Topper's Solved these Questions
- KINEMATICS-1BOOK - CENGAGE PHYSICS ENGLISHCHAPTER - KINEMATICS-1EXERCISE - Exercise 4.1
17 Videos
- KINEMATICS-1BOOK - CENGAGE PHYSICS ENGLISHCHAPTER - KINEMATICS-1EXERCISE - Exercise 4.2
12 Videos
- KINEMATICS-1BOOK - CENGAGE PHYSICS ENGLISHCHAPTER - KINEMATICS-1EXERCISE - Integer
9 Videos
- GRAVITATIONBOOK - CENGAGE PHYSICS ENGLISHCHAPTER - GRAVITATIONEXERCISE - INTEGER_TYPE
1 Videos
- KINEMATICS-2BOOK - CENGAGE PHYSICS ENGLISHCHAPTER - KINEMATICS-2EXERCISE - Exercise Integer
9 Videos
Similar Questions
A ball is dropped from a height of 5 m, if it rebound upto height of 1.8 m, then the ratio of velocities of the ball after and before rebound is :
View SolutionA ball thrown vertically upward with initial velocity u. Which of the following graphs represent the velocity of ball correctly as function of time?
(Take upward direction as positive)
View SolutionA rubber ball is dropped from a height of 5mon a plane, where the acceleration due to gravity is not shown. On bouncing it rises to 1.8m. The ball loses its velocity on bouncing by a factor of
View SolutionA ball is dropped from height 5m. The time after which ball stops rebounding if coefficient of restitution between ball and ground e=1/2, is
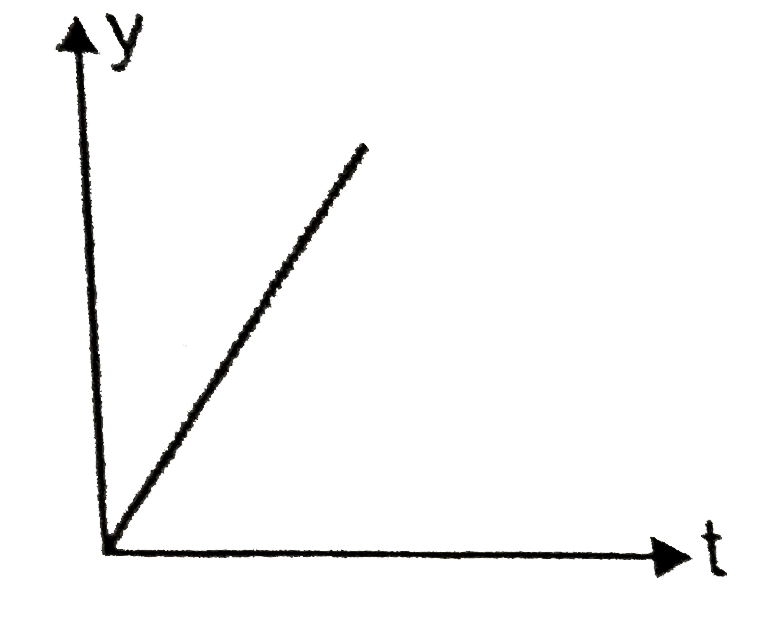
View SolutionA particle starts moving from rest the origin & moves along positive x− direction . Its rate of change of kinetic energy with time shown on y− axis veries with time t as shown in the graph. If position, velocity , acceleration & kinetic energy of the particle at any time t are x,v,a,&k respectively then which of the option (s) may be correct ?

View SolutionA player throwsa a ball upwards with an initial speed of 29.4ms−1.
(i) What is the direction of acceleration during the upwared motion of the ball?
(ii) What are the velocity and acceleration of the ball at the highest point of its motion?
(iii) Choose the x=0 and t=0 to be the location and time of the ball at its highest point, vertically downward direction to be the positive direction of X-axis, and give the signs of positive, velocity and acceleration of the ball during its upward, and downward motion.
(iv) To what height does the ball rise and after how long does the ball return to the player's hand?( Take g=9.8ms−2, and neglect air resistance).
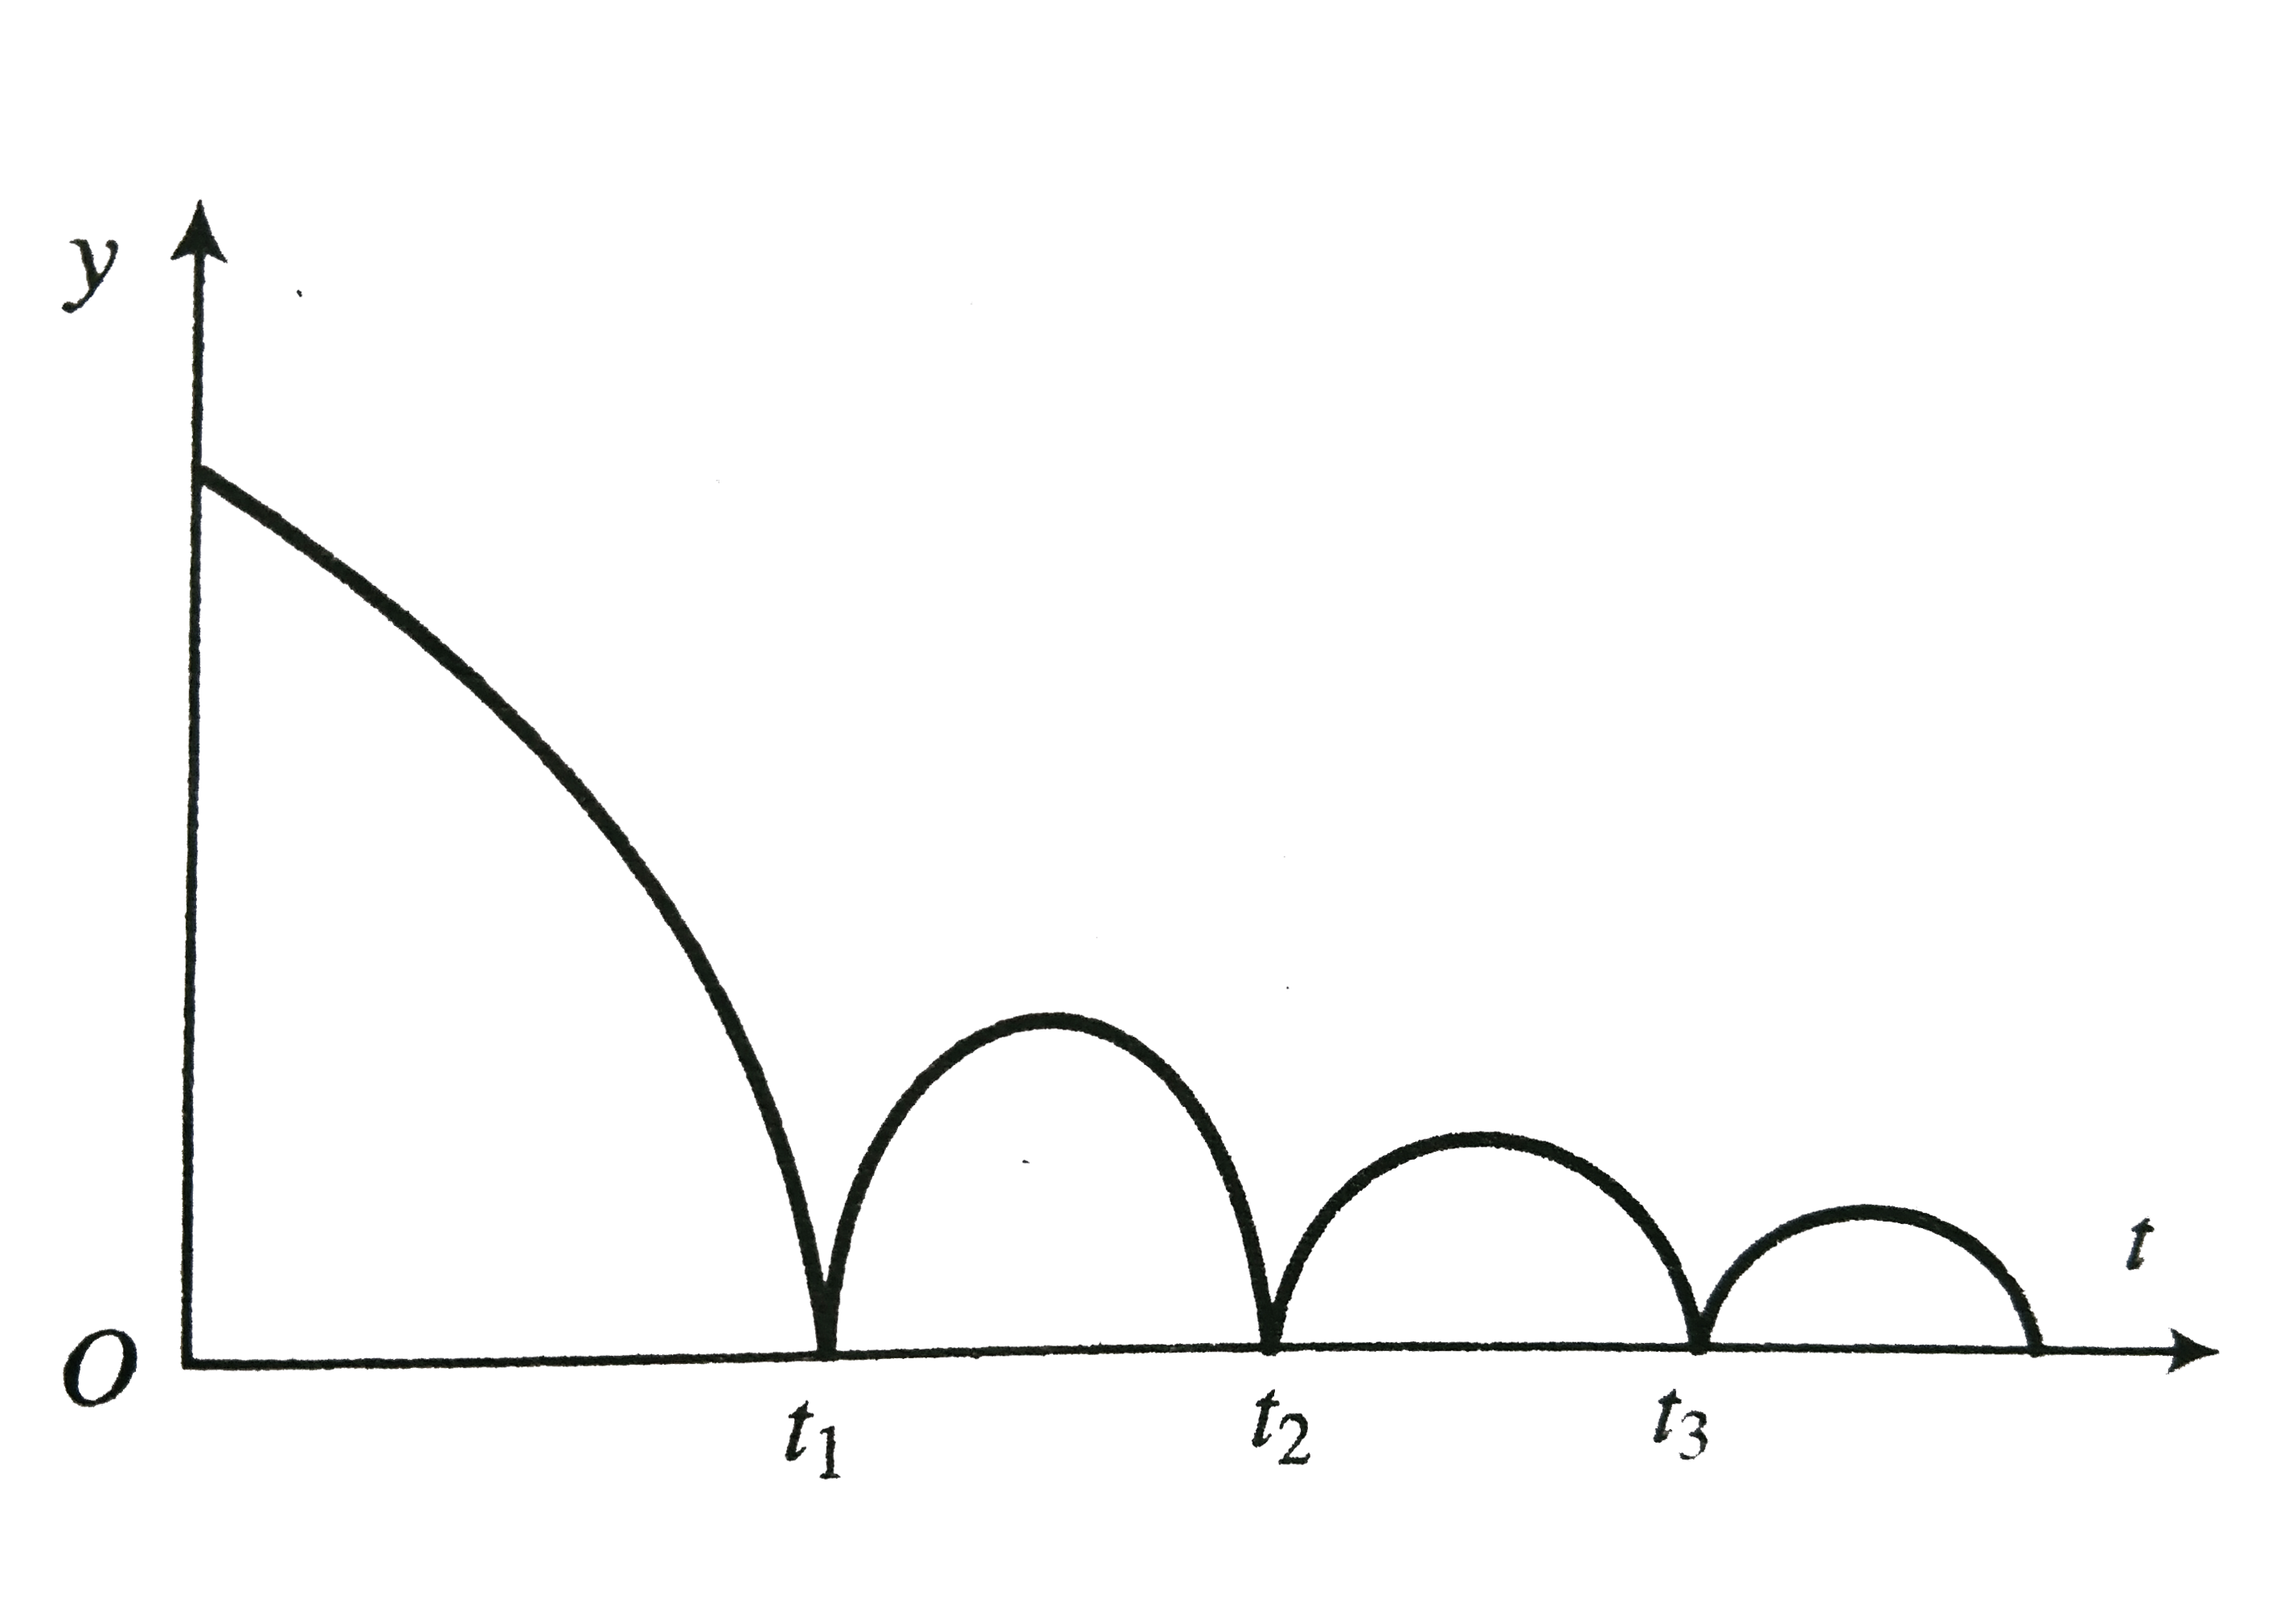
View SolutionThe graph as shown in. below descrines the motion of a ball rebounding from a horizontal surface being released from a point above the surface. Assume that the ball colledes each time with the floor inelastically. The quantity represented on the y-axis in the is the balls (take upward direction as positive)
 .
.
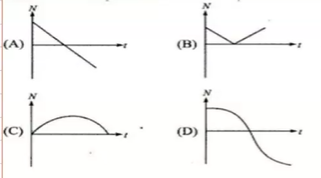
View SolutionA block of mass m is resting inside a smooth horizontal tube. If the tube accelerates vertically downward with acceleration a=kt where k is a positive constant, the correct plot showing the variation of normal reaction received by the block as a function of time (considering that upward direction of normal reaction is positive and taken towards positive direction y axis) will be


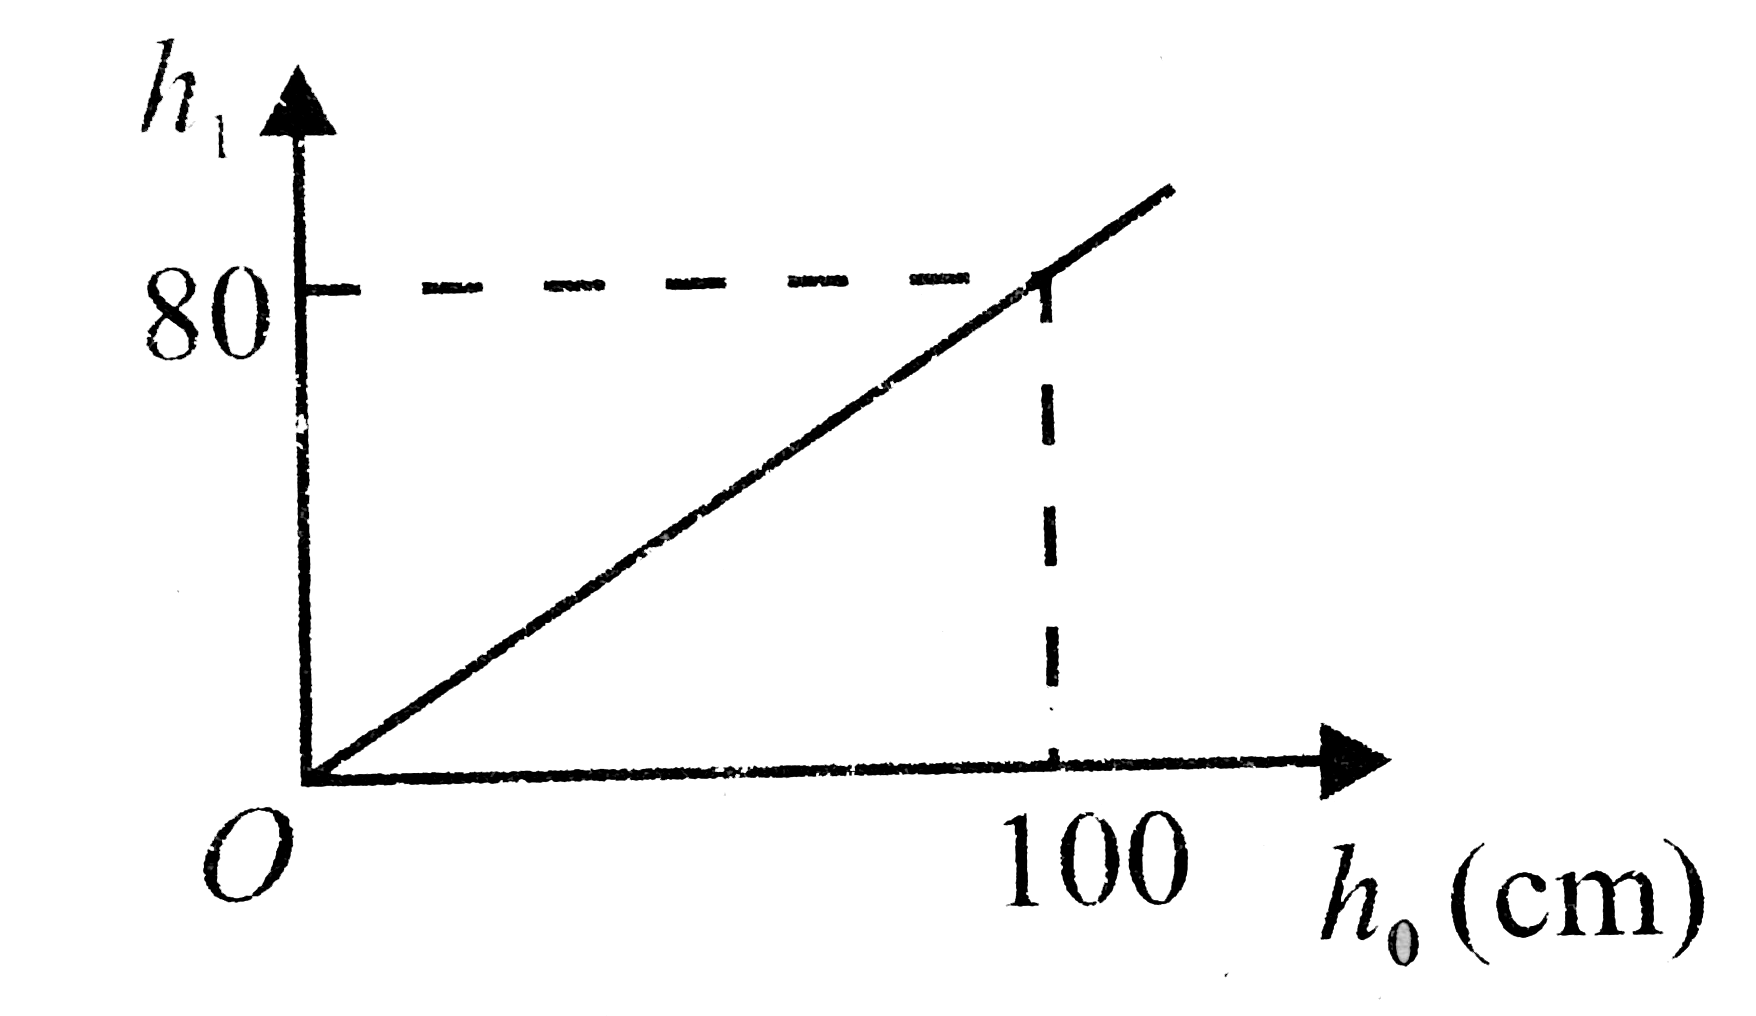
View SolutionA ball released from a height ho above a horizontal surface rebounds to a height h1, after one bounce. The graph that relates h0 to h1 is shown Fig. If the ball (of the mass m) was dropped from an initial height h and made three bounces, the kinetic energy of the ball immediately after the third impact with the surface was

View SolutionA uniform moving cricket ball is turned back by hitting it with a bat for a very short time interval. Show the variation of its acceleration with time. (Take acceleration in the back ward direction as positive).
View Solution
