The v-s graph for an airplane travelling on a straight runway is shown. Determine the acceleration of the plane at s=50m and s=150m. Draw the a-s graph. 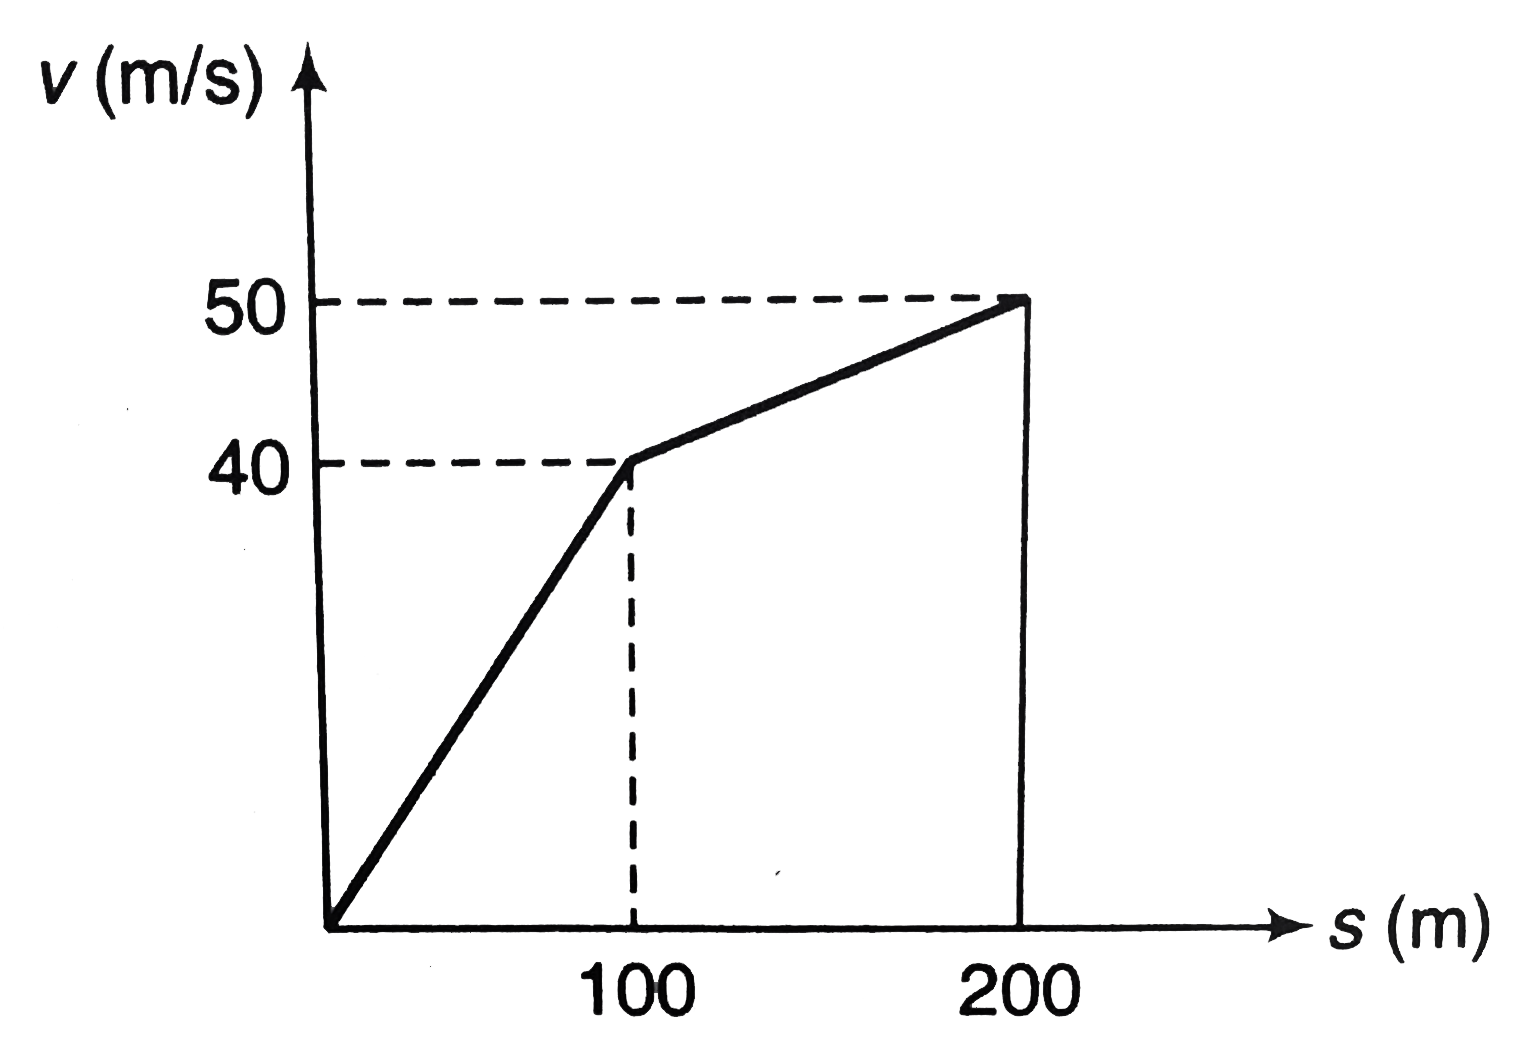
Referring to the v−s graph, its slope for 100m<s≤250 m<br>isequal→(60-50)/(250-100)=(1)/(15)<br>Theequationoftheabovegraphisgivenby(v-50)/(s-100)=(1)/(15)<br>Thisgivev=(650+s)/(15) 100 m lt s lt 250 m<br><imga≤ocr_imageload∈g=lazysrc=https://d10lpgp6xz60nq.cloudfront.net/physics_images/BMS_V01_C04_S01_055_S01.pngwh=80%mx-autosty≤=background:white;>.<br>Substitut∈gs=150 m,wehave<br>v(160)/(3) m s^(-1)<br>Sincea=(vdv)/(ds)and(dv)/(ds)=(1)/(15)for100 m lt s lt 250 m,wehave<br>a=(32)/(9)m s^(-2).
Topper's Solved these Questions
- KINEMATICS-1BOOK - CENGAGE PHYSICS ENGLISHCHAPTER - KINEMATICS-1EXERCISE - Solved Examples
9 Videos
- KINEMATICS-1BOOK - CENGAGE PHYSICS ENGLISHCHAPTER - KINEMATICS-1EXERCISE - Exercise 4.1
17 Videos
- GRAVITATIONBOOK - CENGAGE PHYSICS ENGLISHCHAPTER - GRAVITATIONEXERCISE - INTEGER_TYPE
1 Videos
- KINEMATICS-2BOOK - CENGAGE PHYSICS ENGLISHCHAPTER - KINEMATICS-2EXERCISE - Exercise Integer
9 Videos
Similar Questions
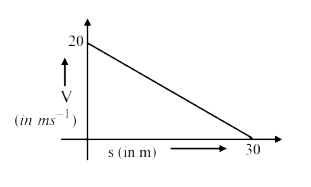
The velocity –position graph of a particle moving along a straight line is shown. Then acceleration of the particle at s = 15 m is :
View SolutionThe velocity-time graph of a particle moving along a straight line is shown is . The rate of acceleration and deceleration is constant and it is equal to 5ms−2. If the a average velocity during the motion is 20ms−1, Then
 .
.
The value of t is.
View SolutionThe velocity-time graph of a particle moving along a straight line is shown is Fing. The rate of acceleration and deceleration is constant and it is equal to 5ms−2. If the a average velocity during the motion is 20ms−1, Then
 .
.
The distace travelled with uniform velcoty is .
View SolutionThe velocity-time graph of a particle moving along a straight line is shown is Fig. The rate of acceleration and deceleration is constant and it is equal to 5ms−2. If the a average velocity during the motion is 20ms−1, Then
 .
.
The maximum velocity of the particle is .
View SolutionThe velocity-time graph of a particle moving along a straight line is shown is Fig. The rate of acceleration and deceleration is constant and it is equal to 5ms−2. If the a average velocity during the motion is 20ms−1, Then
 .
.
The maximum velocity of the particle is .
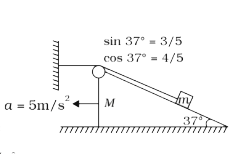
View SolutionAs shown in the figure, if acceleration of M with respect to ground is 5m/s2, then :
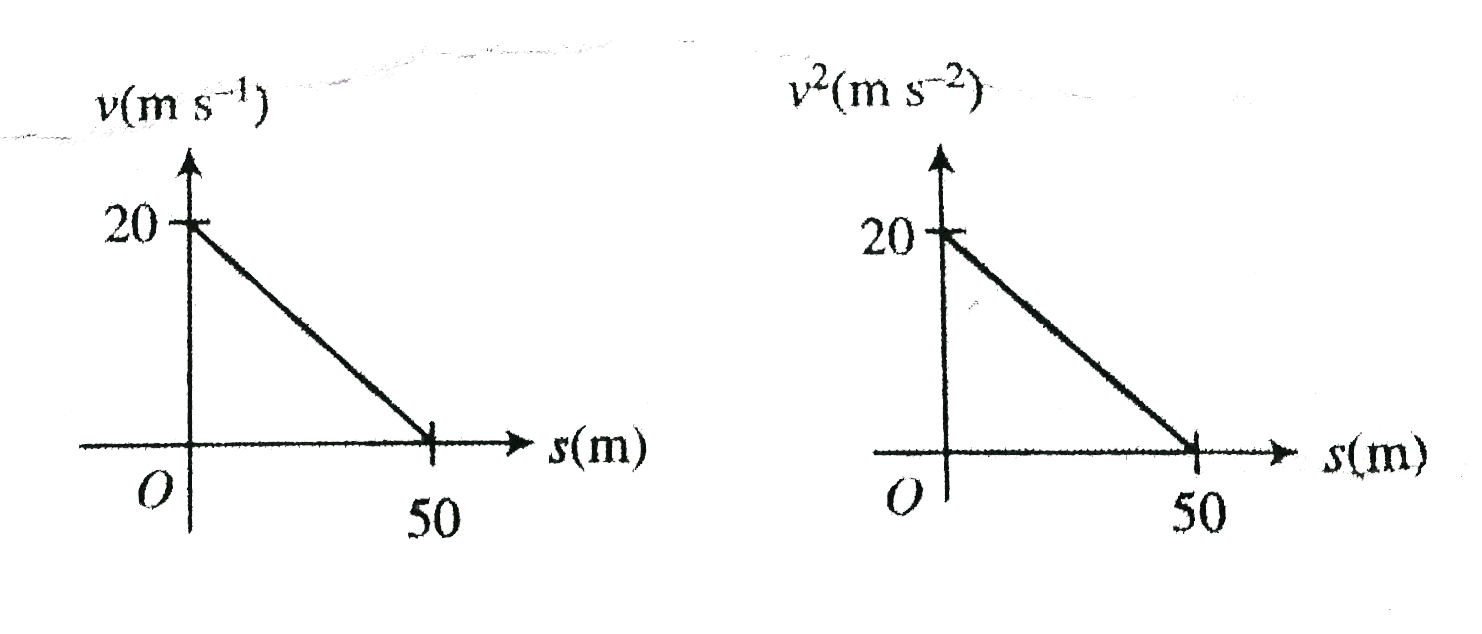
View SolutionThe v−s and v2−s graph are given for two particles. Find the accelerations of the particles at s=0.
 .
.
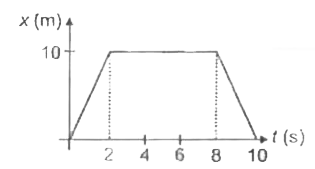
View SolutionThe position - time graph for a particle moving along a straight line is shown in figure. The total distance travelled by it in time t = 0 to t = 10 s is
View SolutionThe acceleration-time graph of a particle moving in a straight line is as shown in figure. The velocity of the particle at time t=0 is 2m/s. The velocity after 2 seconds will be
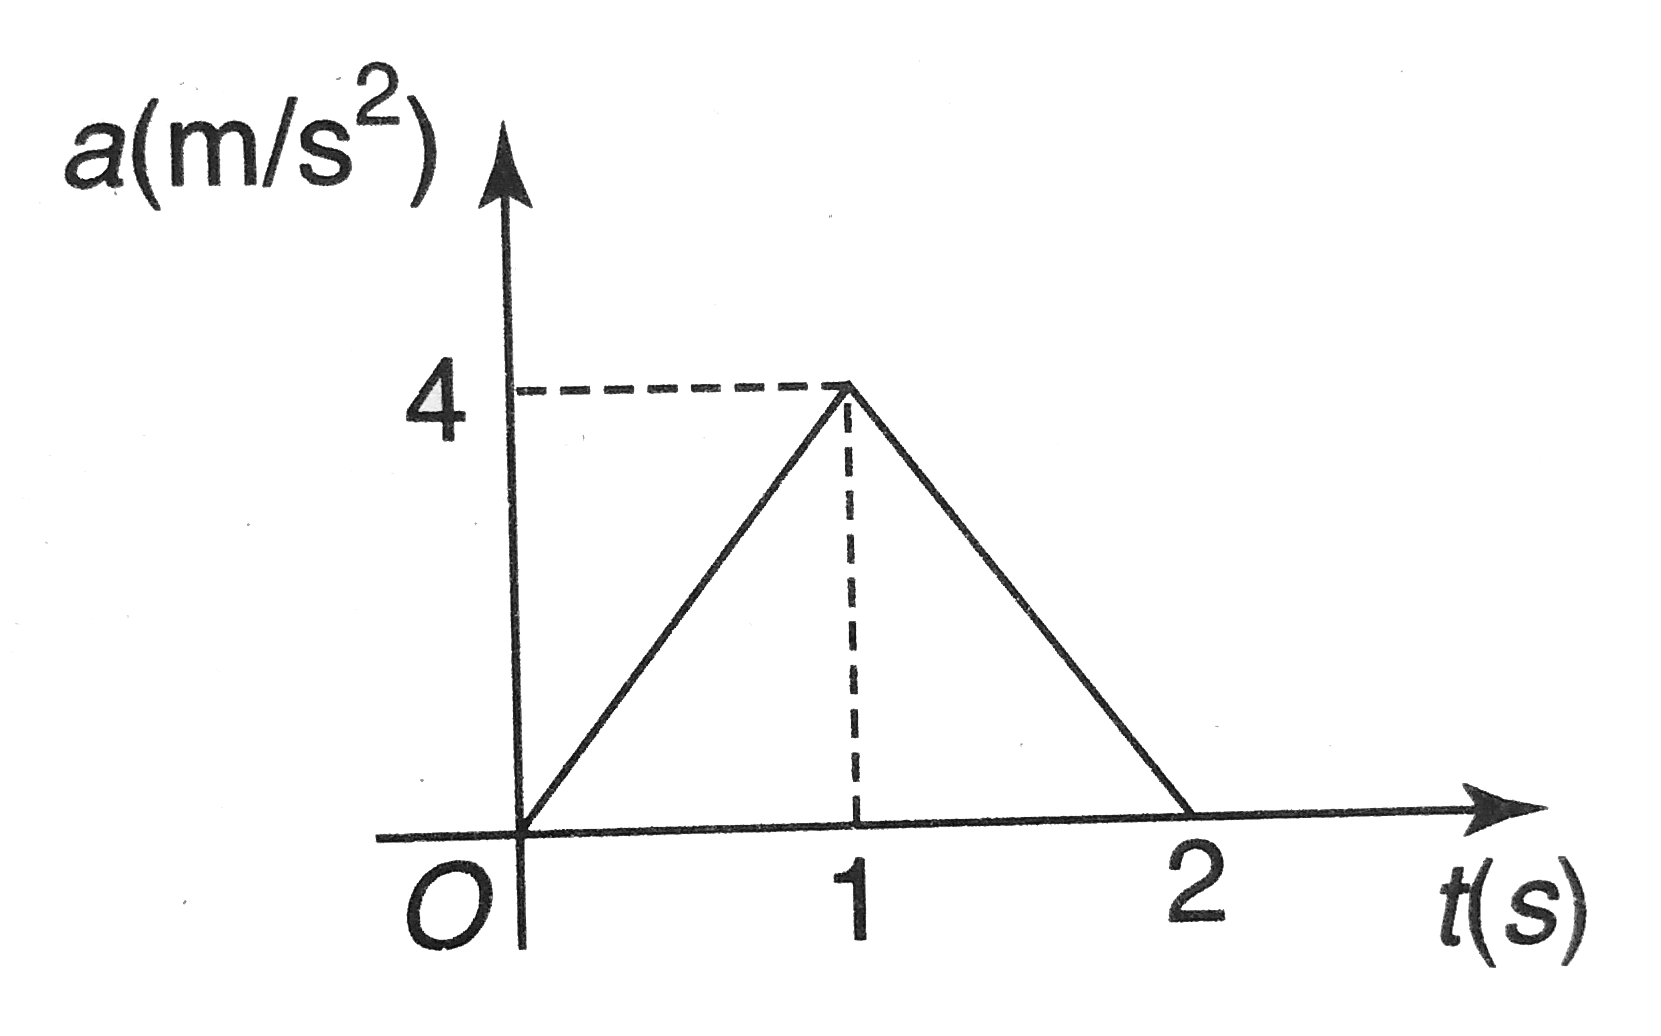
View SolutionThe acceleration-time graph of a particle moving in a straight line is as shown in figure. The velocity of the particle at time t=0 is 2m/s. The velocity after 2 seconds will be

View Solution
