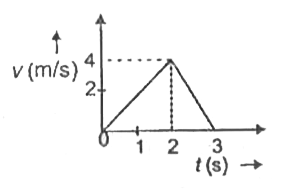
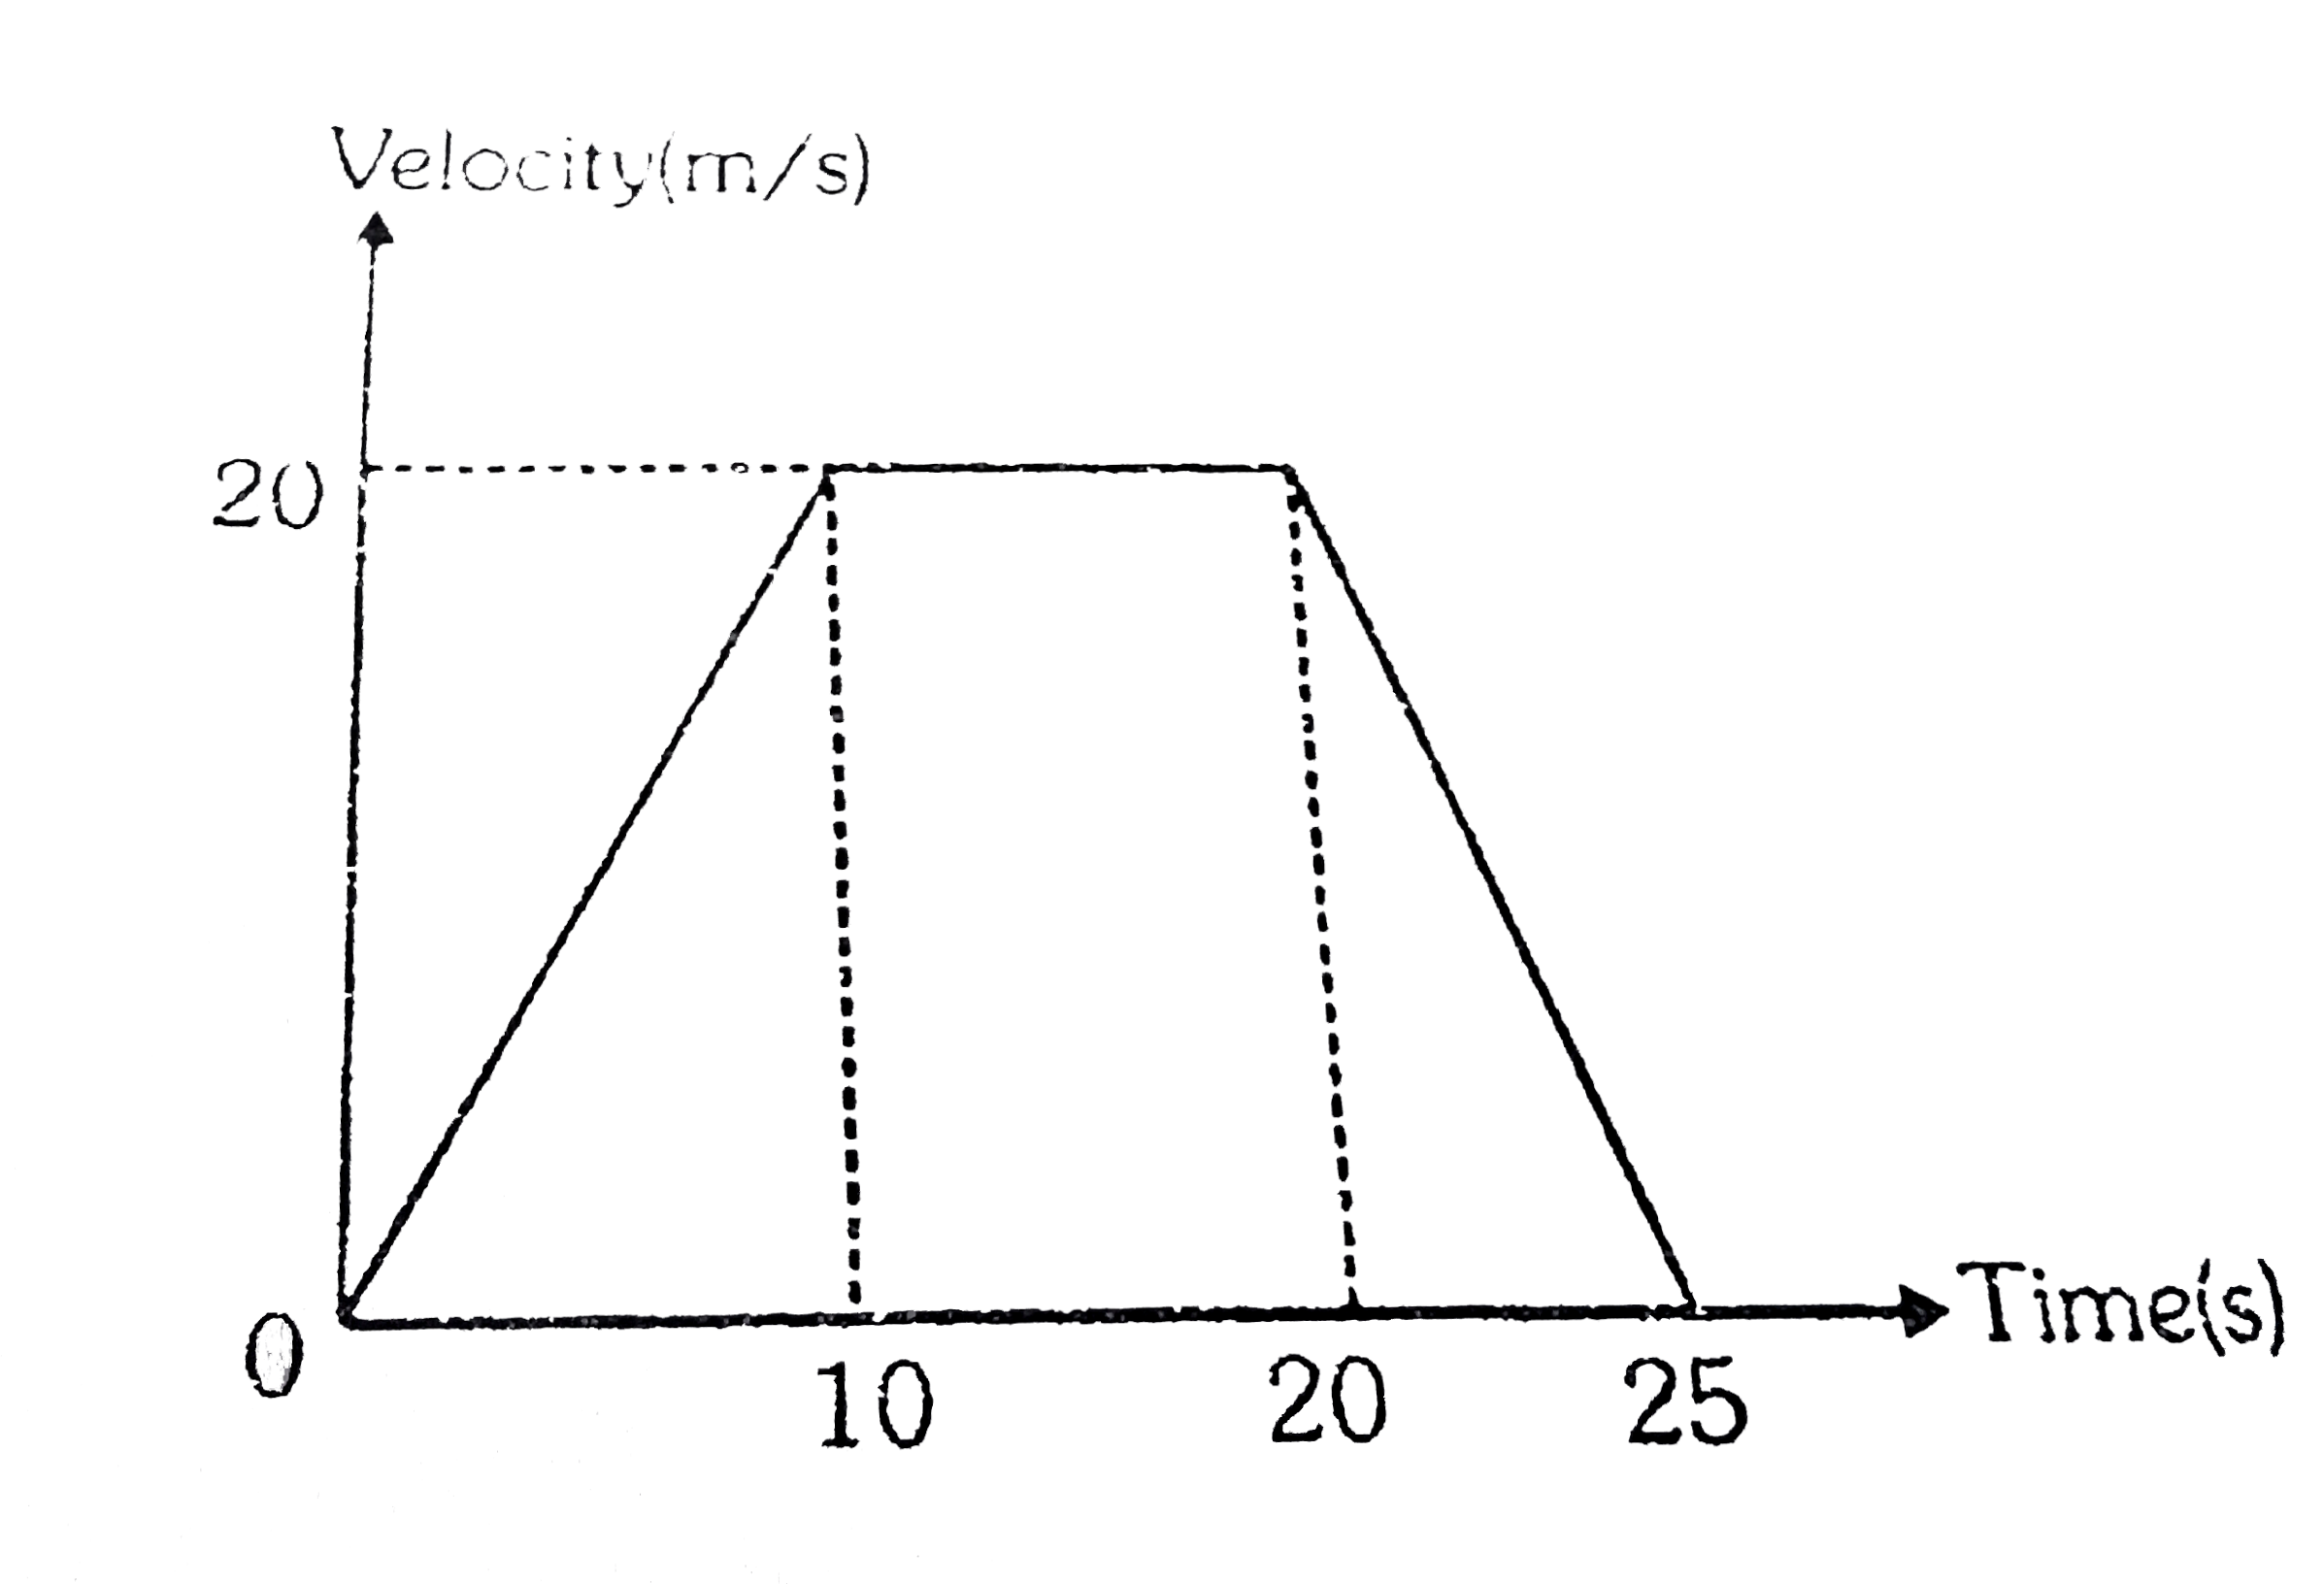
The velocity-time graph of a bosy moving along a straight line is given below find:
(a) Average velocity in whole time of motion
(b) Average speed in whole time of motion
(c ) Draw acceleration vs time graph.
 .
.
a. Area of graph above time axis
A=12×(8+4)×=60m
Area of graph below time axis
B=12×4=10=20m
Average velocity in whole time of motion
→v=DisplacementTotaltime
=AreaA−AreaBTotaltime=600−2012=3.33ms−1
b. Averaga speed in whole time of motion
vav=TotalAreaBTotaltime
=AreaA+AreaBTotlatime=60+2012=6.67ms−1
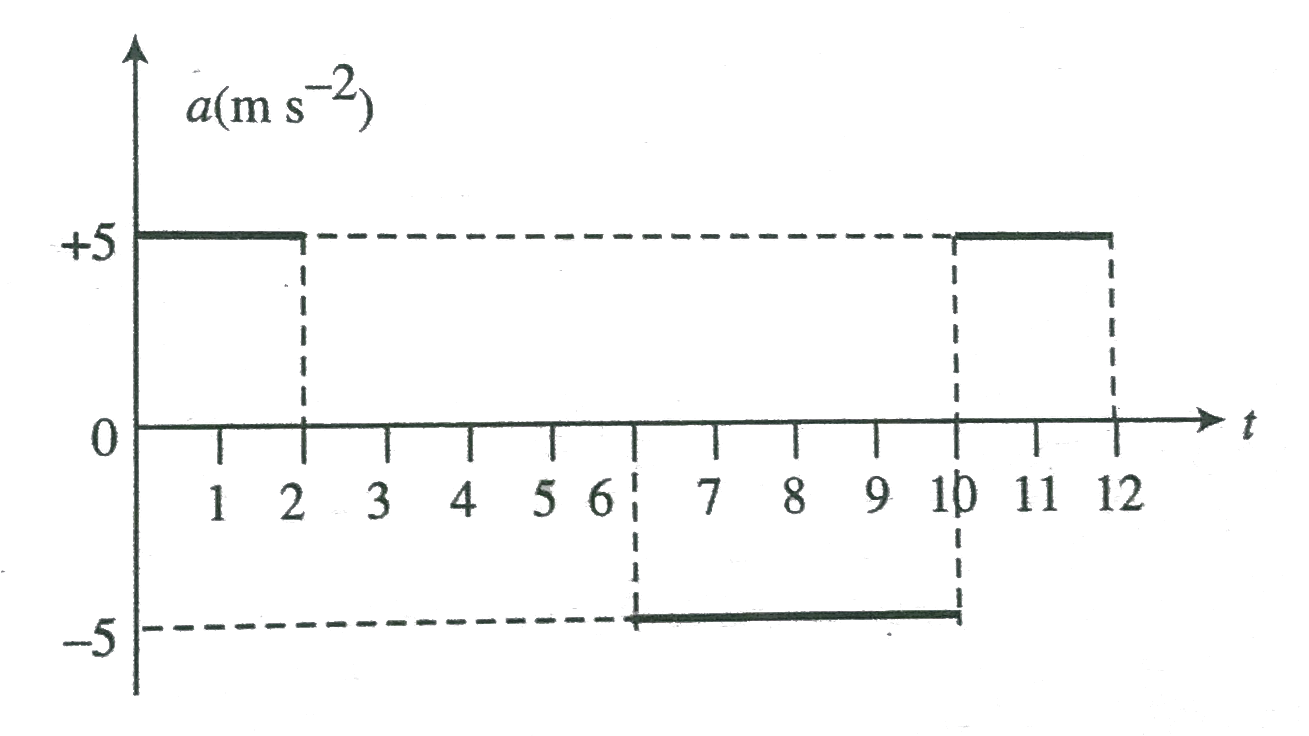
c. Acceleration:
 .
.
From 0 to 2s,
av2−v1t2−t1=10−02−0=5ms−2
From 2 to 6s, a=v2−v1t2−t1=10−106−2=0
From 6 to 10s, a=v2−v1t2−t1=10−1010−2=5ms−2
From 10 to 12 s,
a=v2−v1t2−t1=0−(−10)12−10=5ms−2
Acceleration vs time graph is drawn in .
Topper's Solved these Questions
- KINEMATICS-1BOOK - CENGAGE PHYSICS ENGLISHCHAPTER - KINEMATICS-1EXERCISE - Solved Examples
9 Videos
- KINEMATICS-1BOOK - CENGAGE PHYSICS ENGLISHCHAPTER - KINEMATICS-1EXERCISE - Exercise 4.1
17 Videos
- GRAVITATIONBOOK - CENGAGE PHYSICS ENGLISHCHAPTER - GRAVITATIONEXERCISE - INTEGER_TYPE
1 Videos
- KINEMATICS-2BOOK - CENGAGE PHYSICS ENGLISHCHAPTER - KINEMATICS-2EXERCISE - Exercise Integer
9 Videos
Similar Questions
Knowledge Check
The velocity-time graph of a body in motion is a straight line inclined to the time axis. The correct statement is :
Avelocity is uniformBacceleration is uniformCboth velocity and acceleration are uniformDneither velocity nor acceleration is uniform.
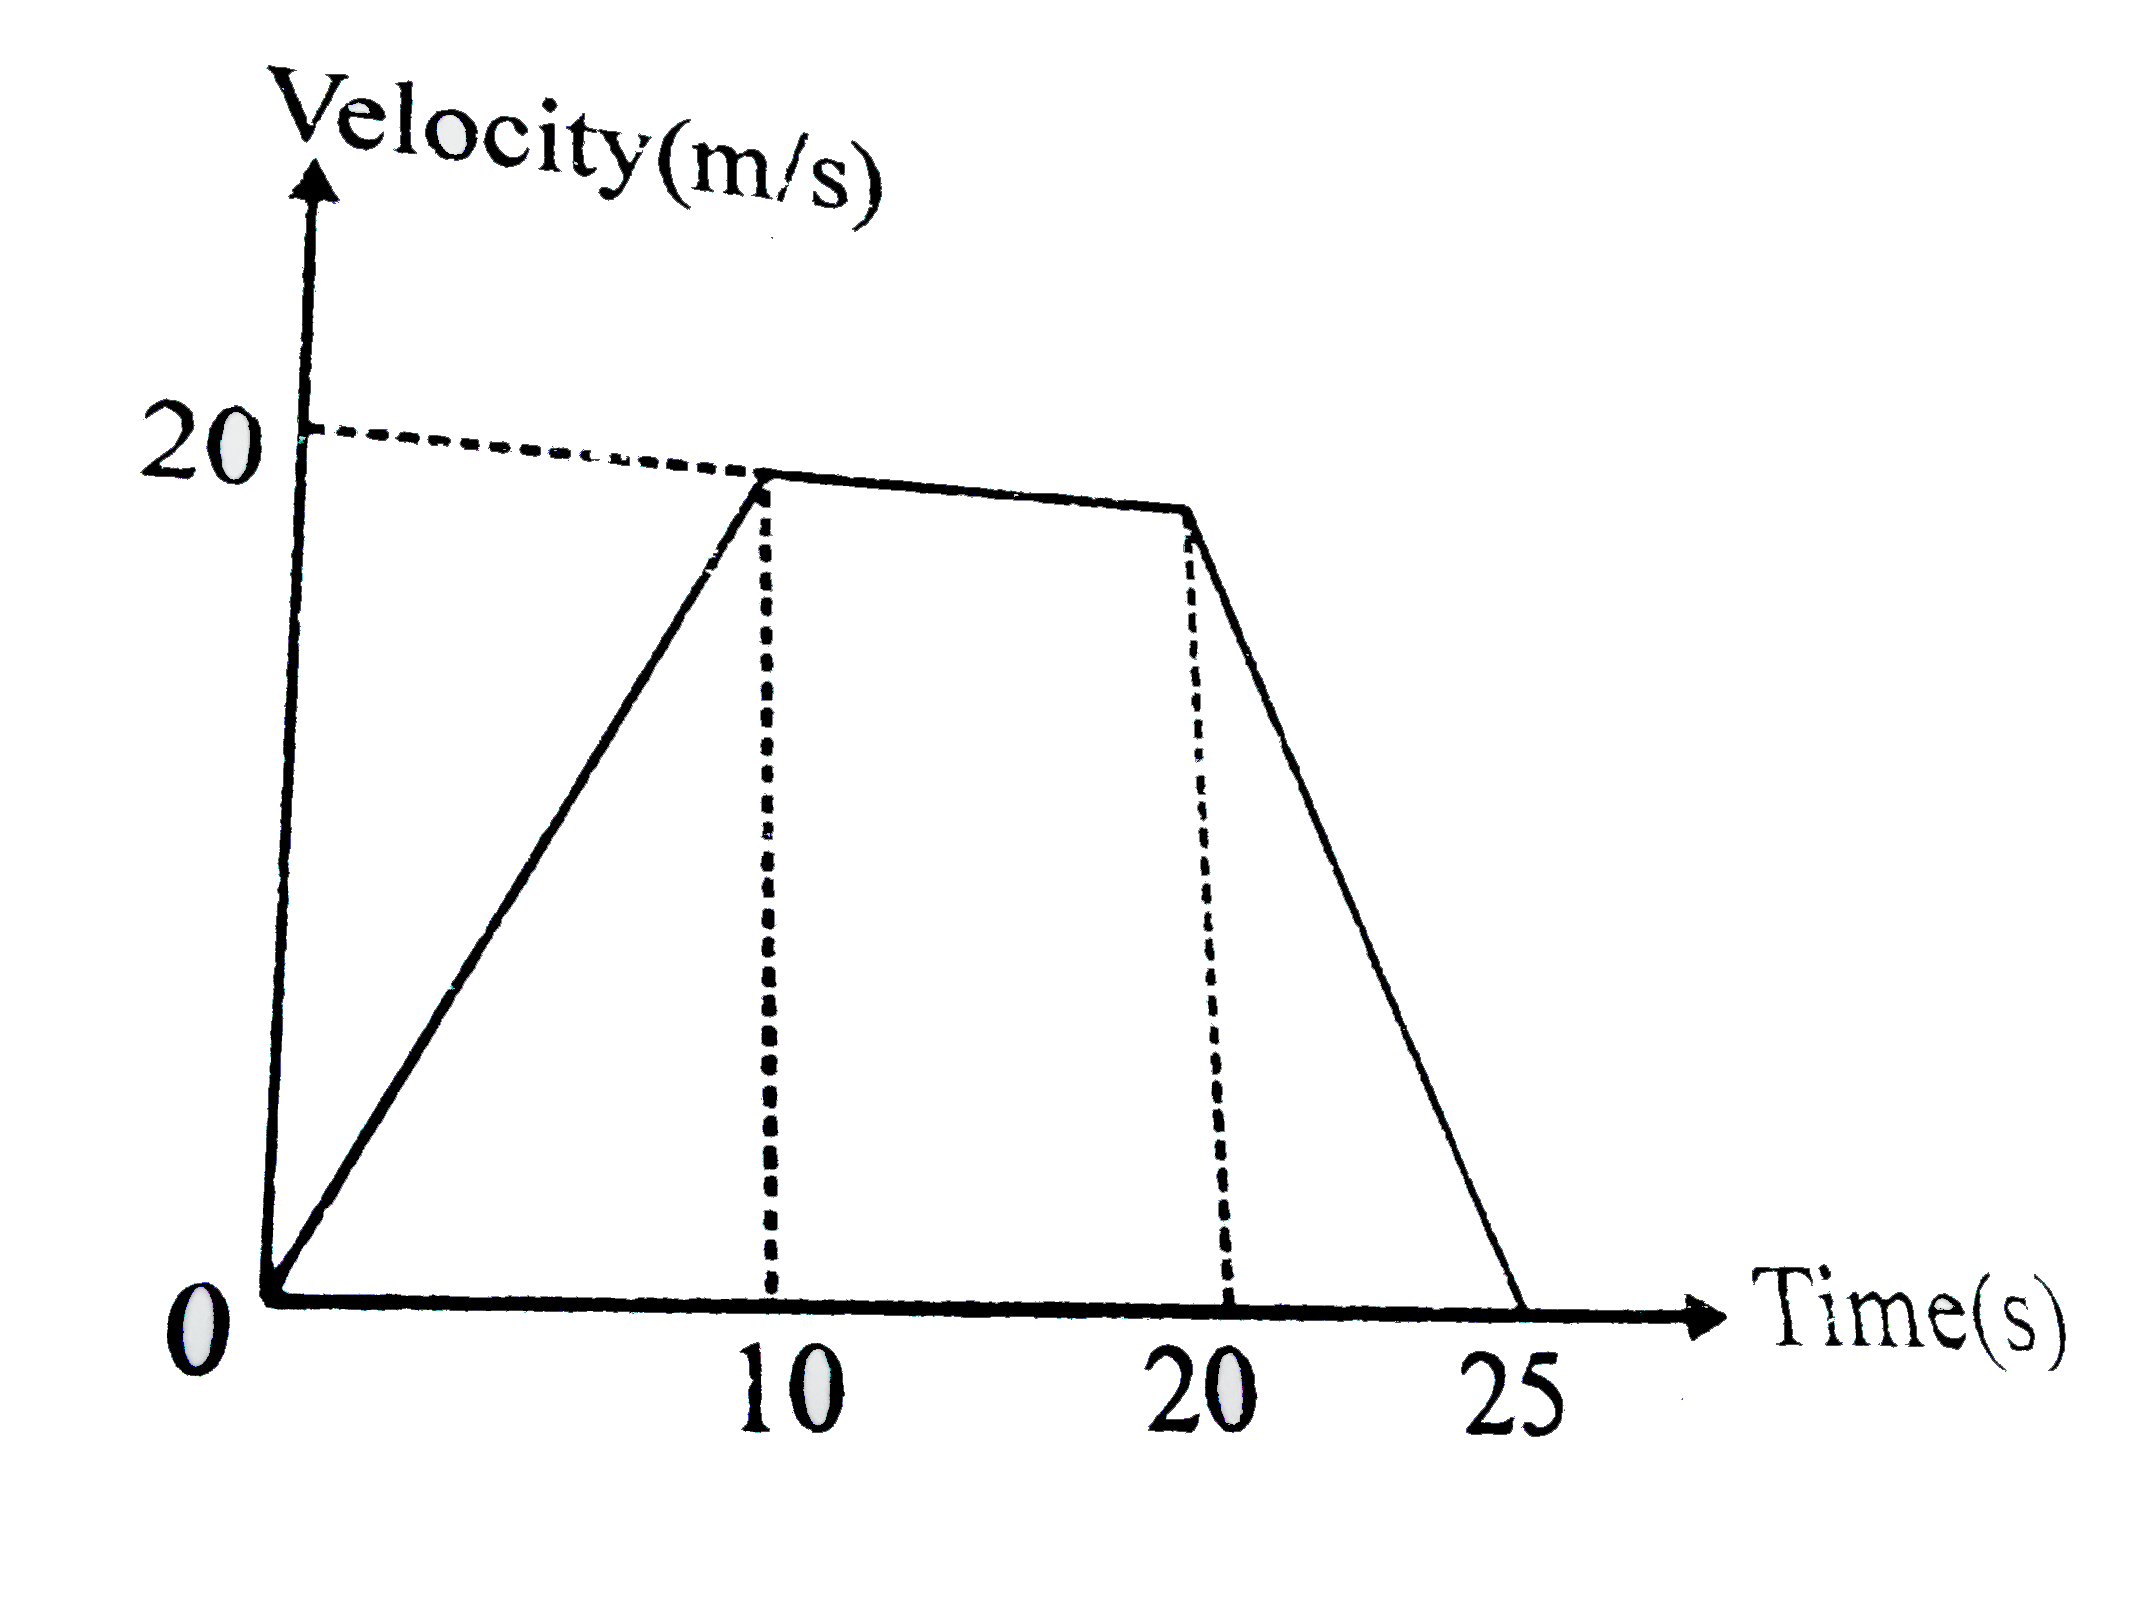
The velocity-time graph of a car moving along a straight road is shown in figure. The average velocity of the car in first 25 seconds is
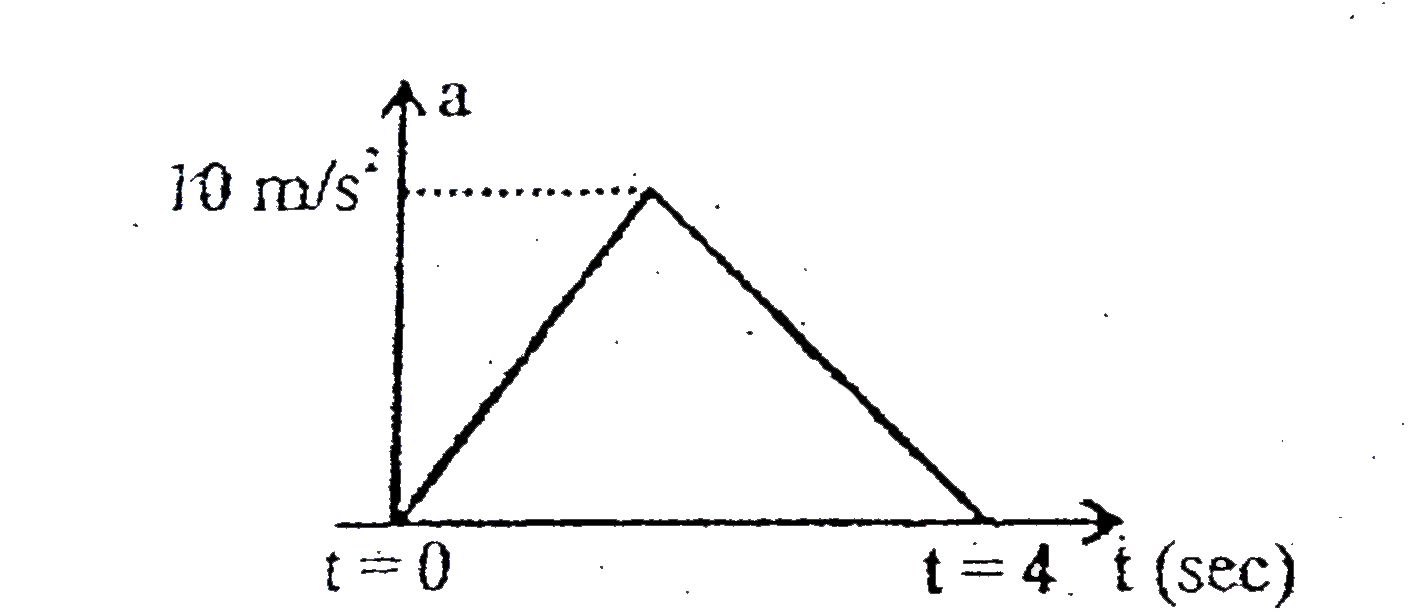
View SolutionAcceleration time graph of a particle moving along a straight line is given. Then average acceleration between t=0 & t=4 is :−
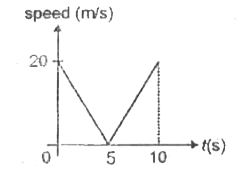
View SolutionThe speed - time graph for a body moving along a straight line is shown in figure. The average acceleration of body may be
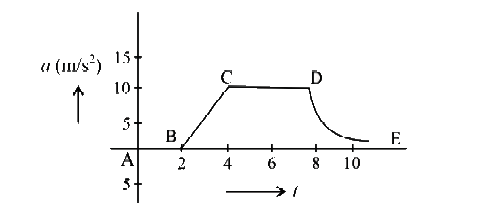
View SolutionThe uniform motion in the following acceleration-time graph is
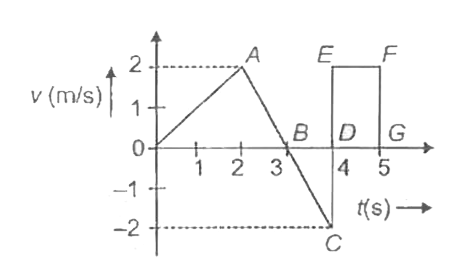
View SolutionThe velocity - time graph of a particle moving along a straight line is shown in the figure given below
The displacement of the particle in 5 second is
View SolutionThe velocity time graph of a particle moving in a straight line is given line is given in the figure. Then starting from t=0, the particle
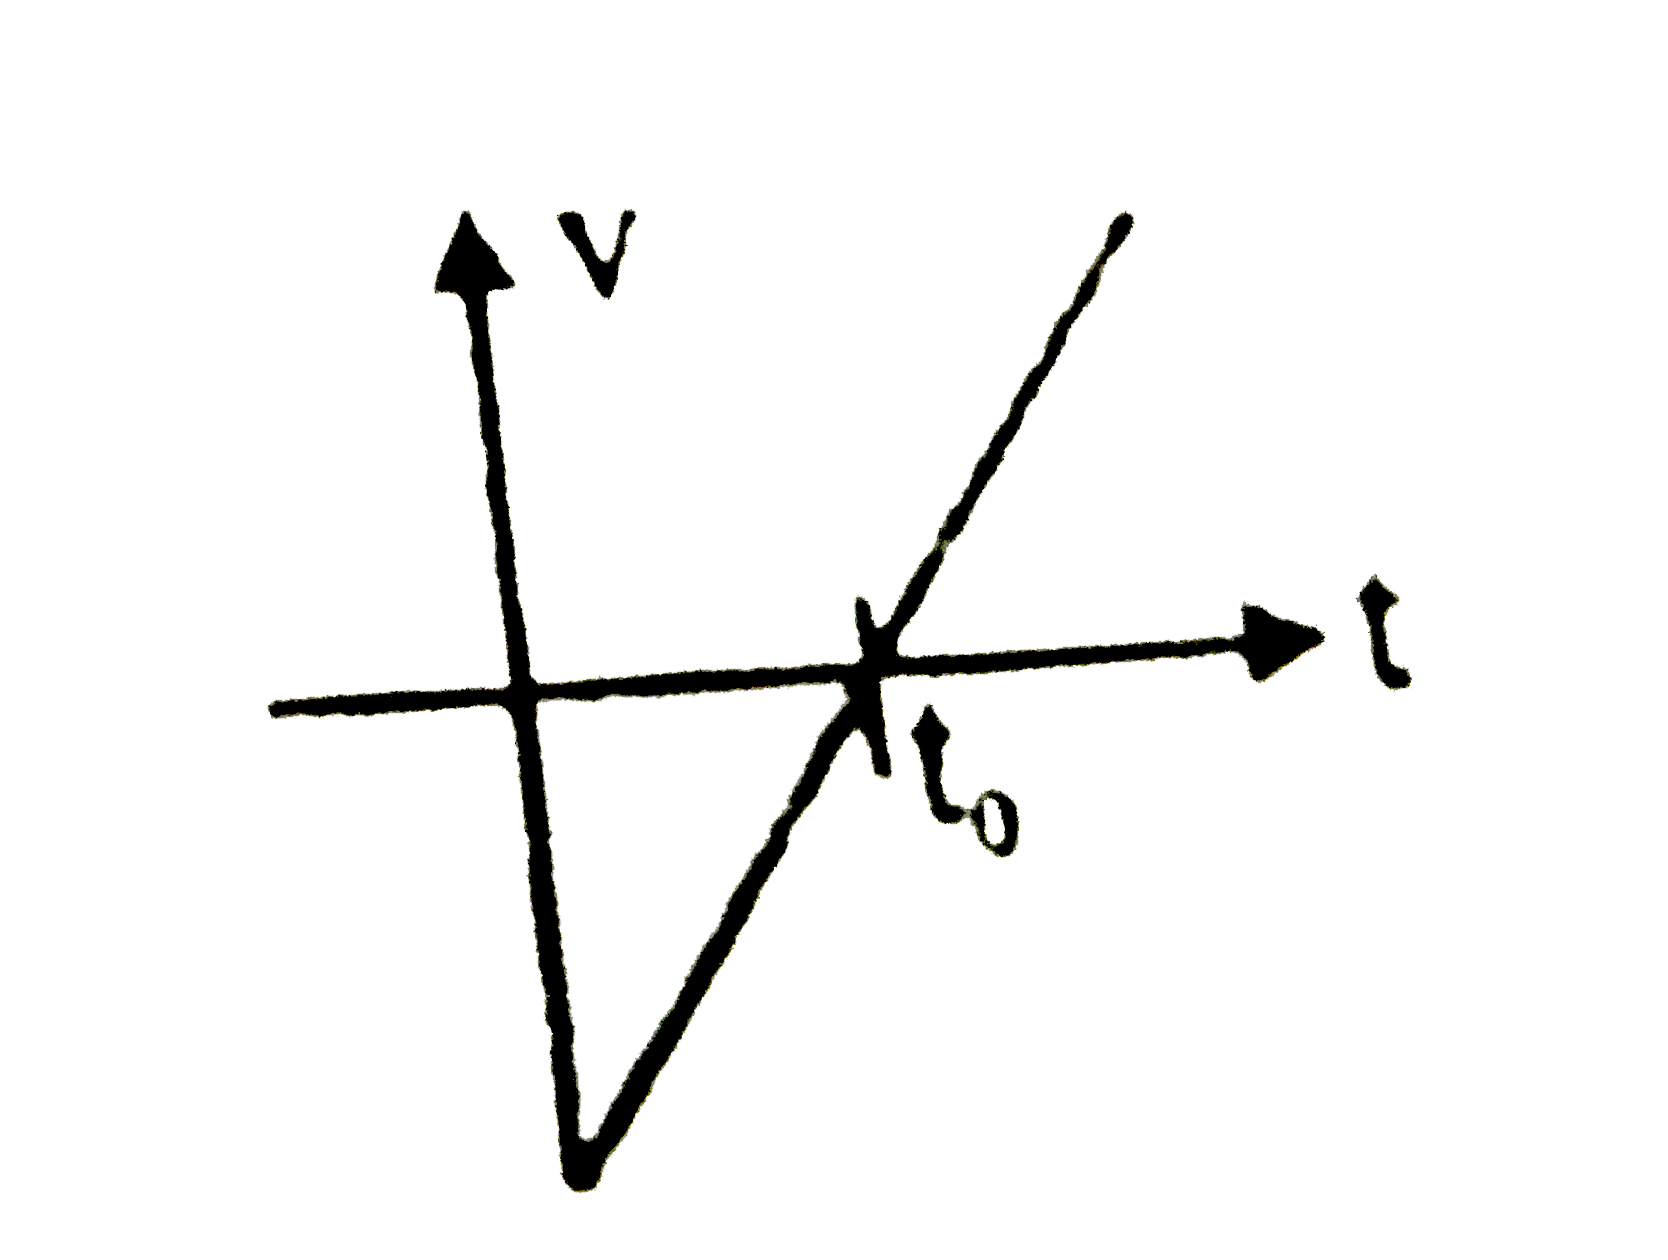
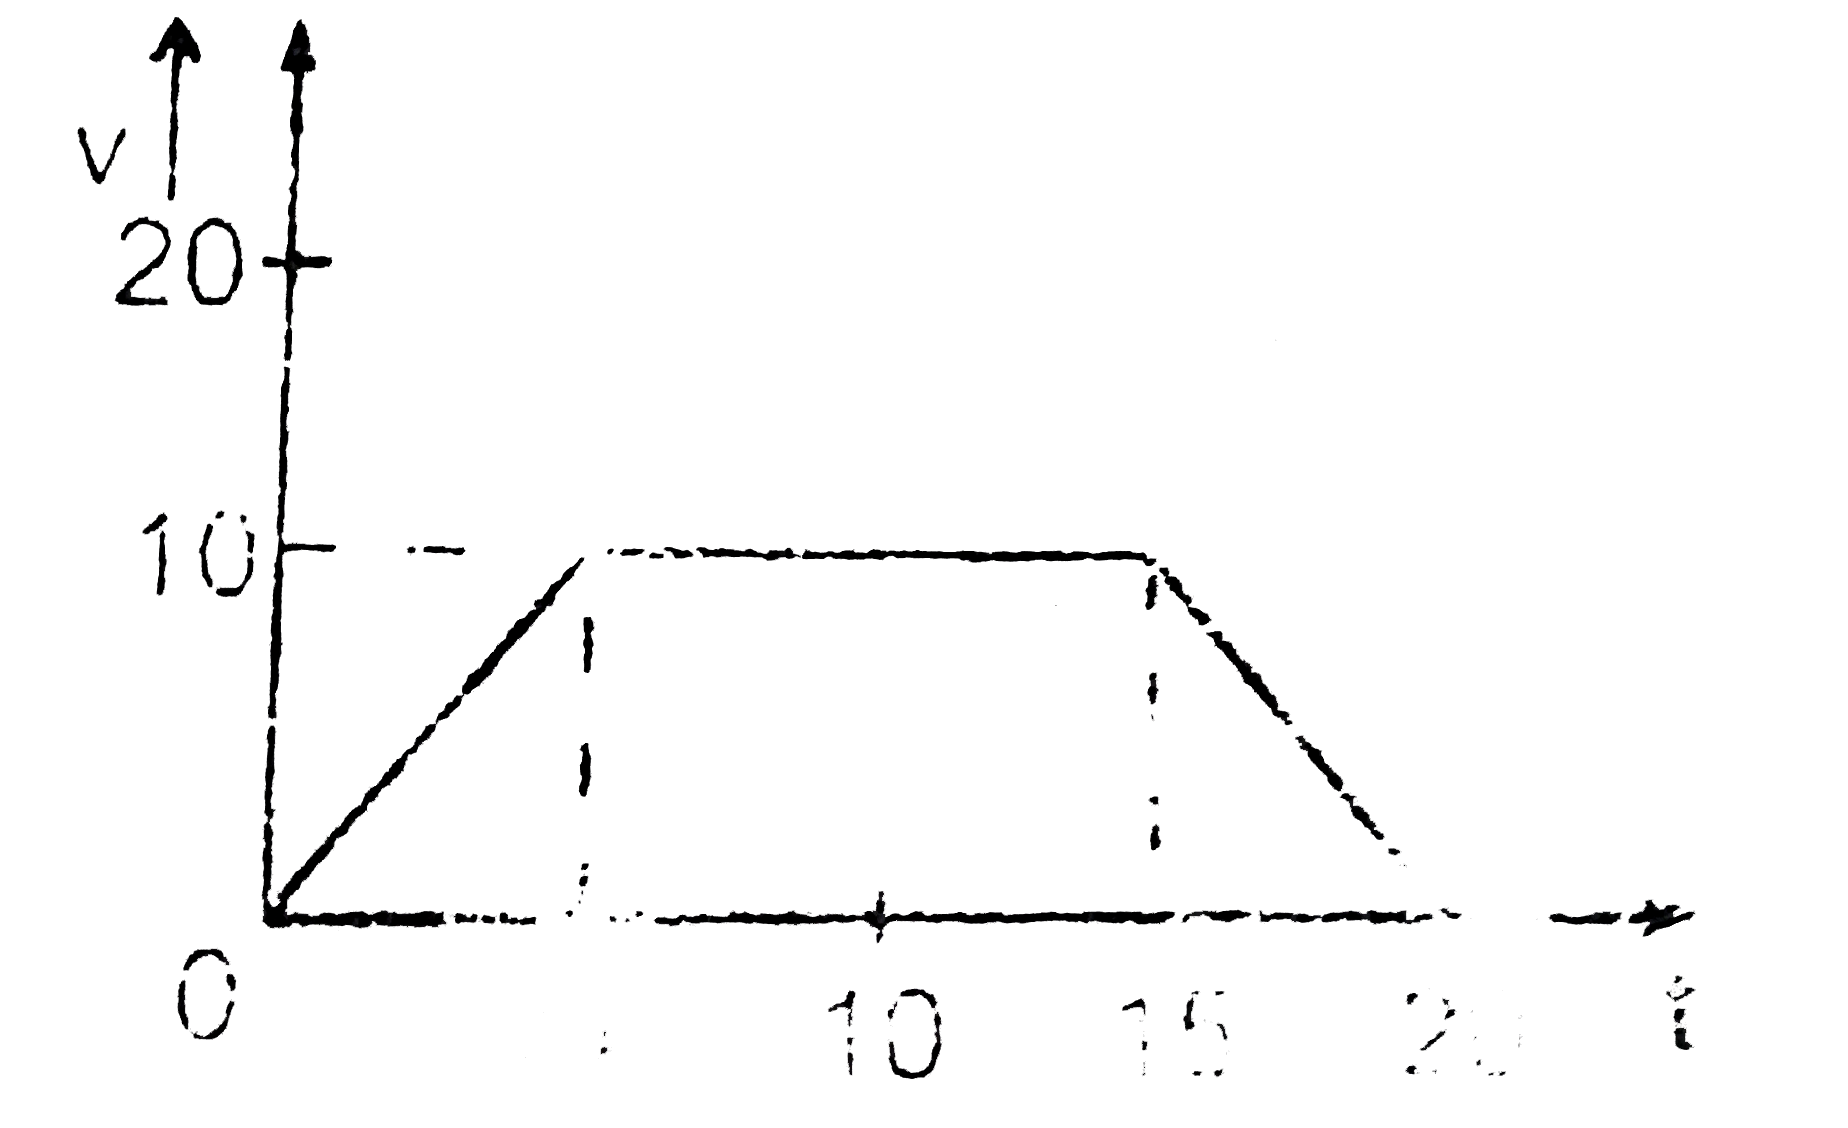
View SolutionFigure shows the velocity time graph of a particle moving along straight line (v is m/s and t is in second). It average velocity in 20 seconds will be:
 .
.
View Solution

