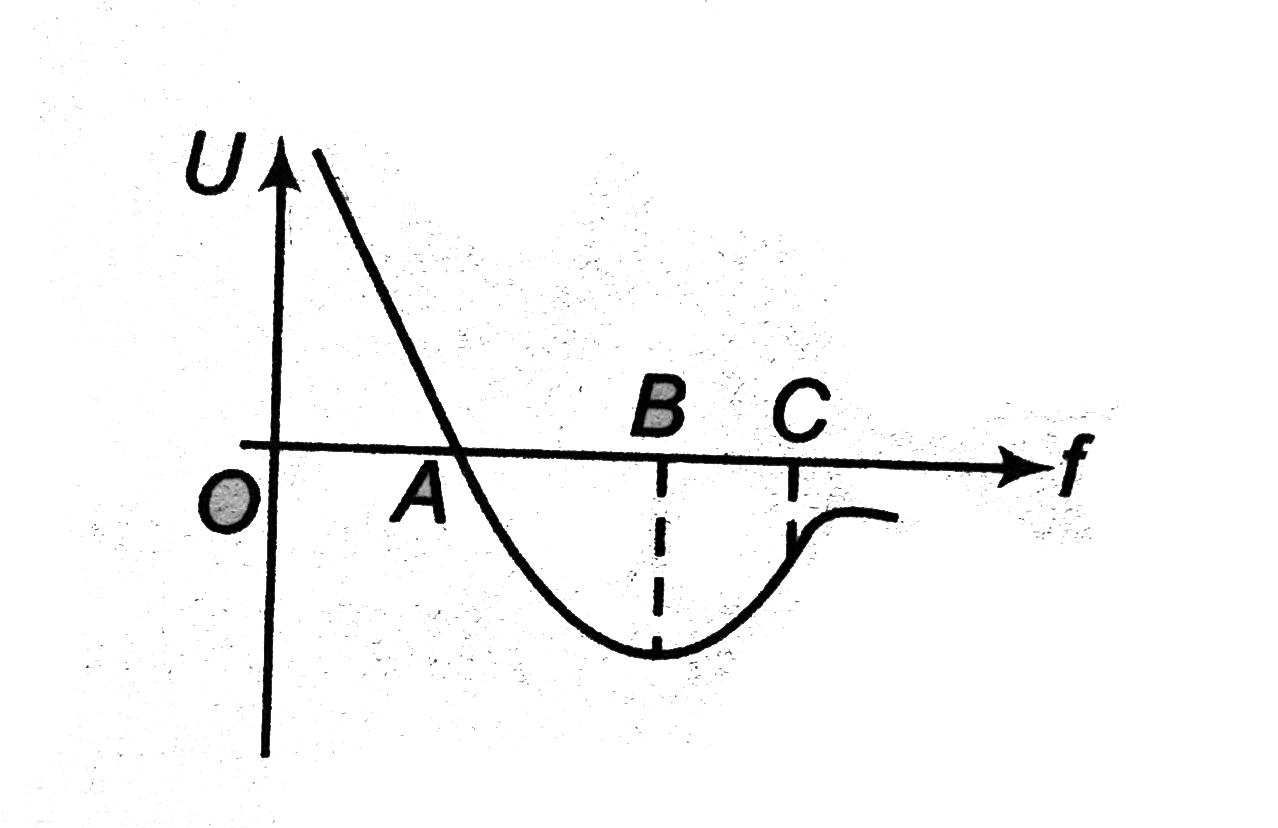
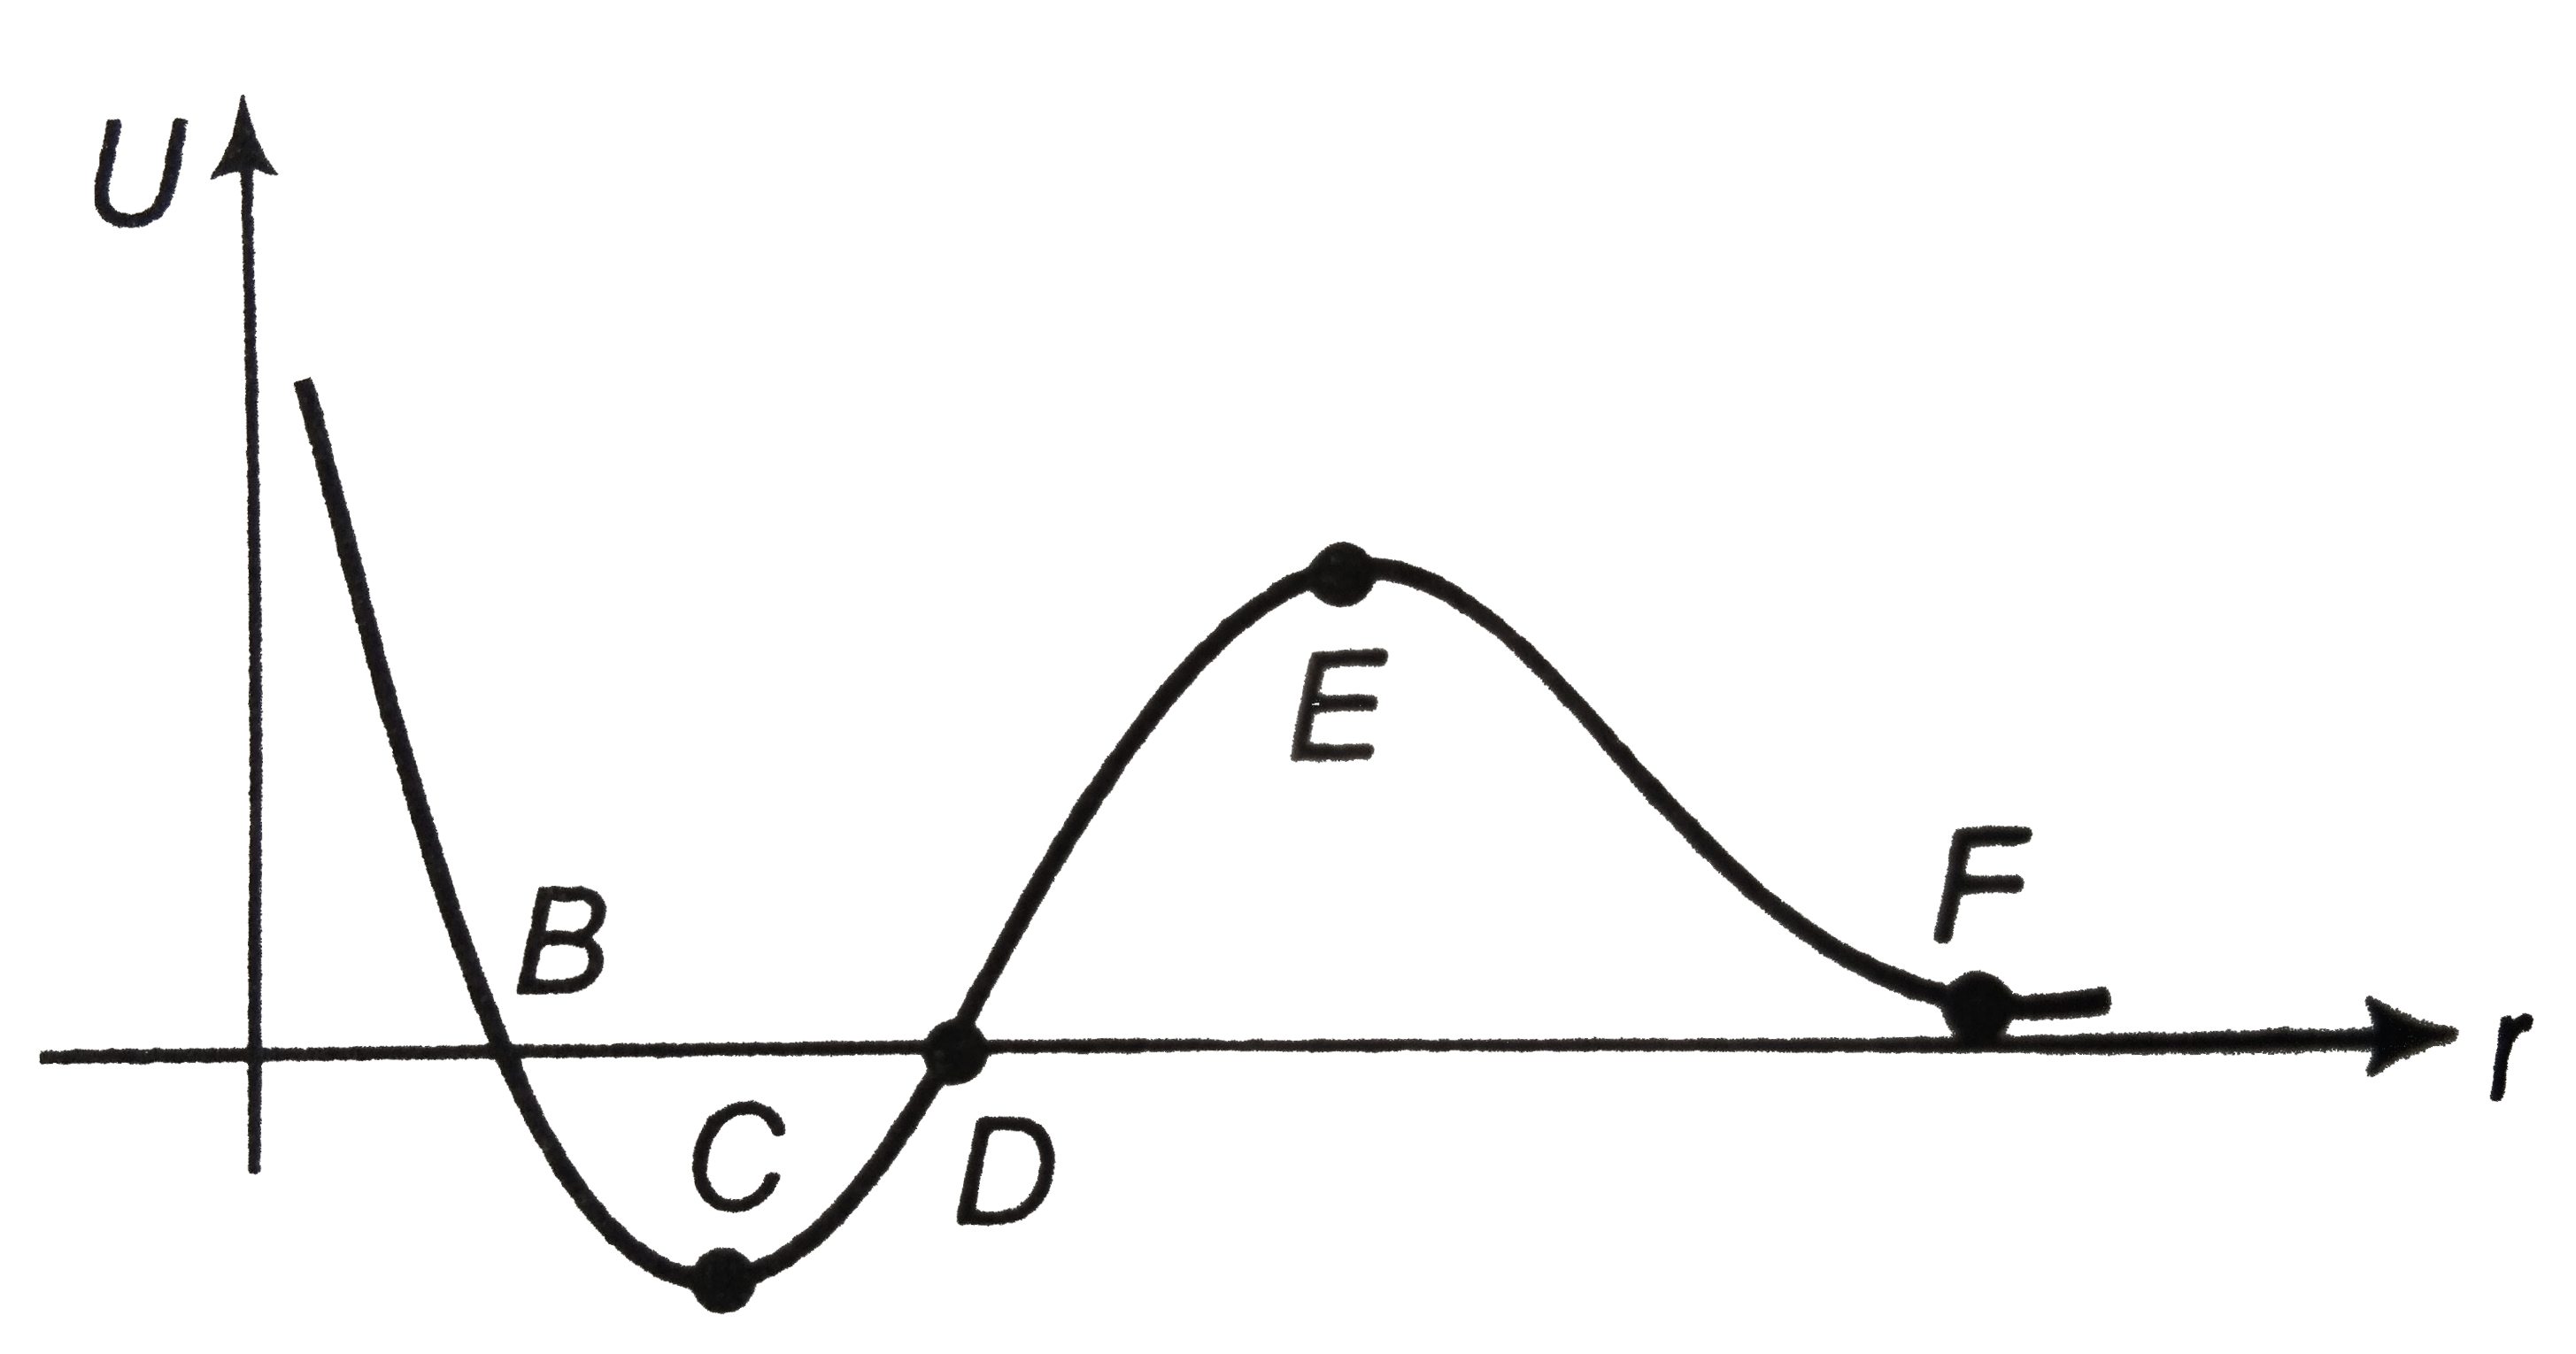
The curve in the diagram shows a potential energy U of two molecules for different values of intermolecular separation r. Which part of the curve represent that the intermolecular force is (i) repulsive, (ii) attractive ?
To determine which part of the potential energy curve represents repulsive and attractive intermolecular forces, we can follow these steps:
Step 1: Understand the Relationship Between Potential Energy and Force
The force F between two molecules can be derived from the potential energy U using the formula:
F=−dUdr
This means that the force is related to the slope of the potential energy curve.
Step 2: Identify the Equilibrium Point
Look for the point on the curve where the potential energy is at a minimum. This point is where the slope is zero, which means:
dUdr=0⇒F=0
This point is often referred to as the equilibrium position, denoted as r0.
Step 3: Analyze the Slope Beyond the Equilibrium Point
- For r>r0: The slope of the curve is positive (the curve is rising). This means:
dUdr>0⇒F<0
Since the force is negative, it indicates that the intermolecular force is attractive in this region.
Step 4: Analyze the Slope Before the Equilibrium Point
- For r<r0: The slope of the curve is negative (the curve is falling). This means:
dUdr<0⇒F>0
Since the force is positive, it indicates that the intermolecular force is repulsive in this region.
Conclusion
- The region before r0 (where the slope is negative) represents repulsive forces.
- The region beyond r0 (where the slope is positive) represents attractive forces.
The force F between two molecules can be derived from the potential energy U using the formula:
F=−dUdr
This means that the force is related to the slope of the potential energy curve.
Look for the point on the curve where the potential energy is at a minimum. This point is where the slope is zero, which means:
dUdr=0⇒F=0
This point is often referred to as the equilibrium position, denoted as r0.
- For r>r0: The slope of the curve is positive (the curve is rising). This means:
dUdr>0⇒F<0
Since the force is negative, it indicates that the intermolecular force is attractive in this region.
- For r<r0: The slope of the curve is negative (the curve is falling). This means:
dUdr<0⇒F>0
Since the force is positive, it indicates that the intermolecular force is repulsive in this region.
- The region before r0 (where the slope is negative) represents repulsive forces.
- The region beyond r0 (where the slope is positive) represents attractive forces.
Topper's Solved these Questions
- PROPERTIES OF MATTERBOOK - ICSECHAPTER - PROPERTIES OF MATTEREXERCISE - MODULE 1 (ELASTICITY)CONCEPTUAL SHORT ANSWER QUESTIONS WITH ANSWERS
12 Videos
- PROPERTIES OF MATTERBOOK - ICSECHAPTER - PROPERTIES OF MATTEREXERCISE - MODULE 1 (ELASTICITY)LONG ANSWER QUESTIONS
5 Videos
- PROPERTIES OF MATTERBOOK - ICSECHAPTER - PROPERTIES OF MATTEREXERCISE - MODULE 4 (SOLVED EXAMPLES)
11 Videos
- OSCILLATIONS BOOK - ICSECHAPTER - OSCILLATIONS EXERCISE - SELECTED PROBLEMS (OSCILLATION IN A TUNNEL BORED THROUGH THE EARTH)
2 Videos
- SAMPLE QUESTION PAPER - 01 BOOK - ICSECHAPTER - SAMPLE QUESTION PAPER - 01 EXERCISE - SECTION - D
12 Videos
Similar Questions
The potential energy U of diatomic molecules as a function of separation r is shown in figure. Identify the correct stateement.

View SolutionThese diagrams represent the potential energy U of a diatomic molecule as a function of the inter-atomic distance r. The diagram corresponds to stable molecule found in nature is.
View Solution(a) Draw a plot showing the variation of potential energy of a pair of nucleons as a function of their separation . Mark the regions where the nuclear force is :
(i) attractive and (ii) repulsive.
(b) In the nuclear reaction
n+235U→92aXe+54 94Sr+2nb determine the values of a and b .
View SolutionThe potential energy curve for interaction between two molecules is shown in figure. Which of the following statements are true?
View SolutionFigure shows four PV diagrams. Which of these curves represent isothermal and adiabatic processes?

View SolutionDraw a plot of potential energy of a pair of nucleons as a function of their separation . Write two important conclusions which you can draw regarding the nature of nuclear forces .
View SolutionIn which of the following molecules, intermolecular attraction is purely London force?
View SolutionDraw a plot of potential energy of a pair of nucleons as a function of their separations. Mark the regions where the nuclear force is (i) attractive and (ii) repulsive. Write any two characteristic features of nuclear forces.
View SolutionThe given plot shows the variation of U, the potential energy of interaction between two particles with the distance separating them r,

View SolutionThe given plot shows the variation of U, the potential energy of interaction between two particles with the distance separating them r,

View Solution
