Use Graph paper for this question.
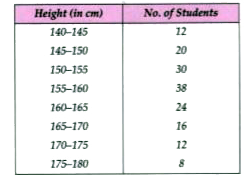
A survey regarding height ( in cm) of 60 boys belonging to Class 10 of a school was conducted. The following data was recorded.

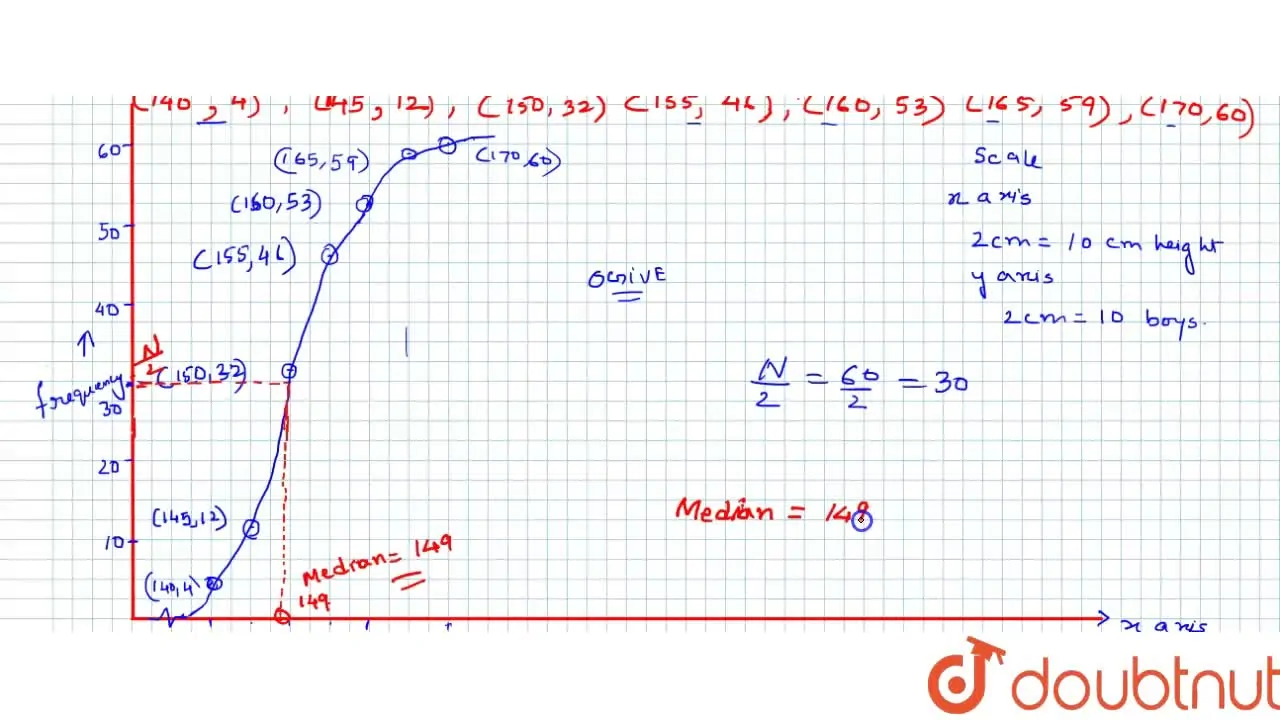
Taking 2 cm = height of 10 cm along one axis and 2 cm = 10 boys along the other axis draw an ogive of the above distribution. Use the graph to estimate the following :
(i) the median
The correct Answer is:149 cm
Step by step video & image solution for Use Graph paper for this question. A survey regarding height ( in cm) of 60 boys belonging to Class 10 of a school was conducted. The following data was recorded. Taking 2 cm = height of 10 cm along one axis and 2 cm = 10 boys along the other axis draw an ogive of the above distribution. Use the graph to estimate the following : (i) the median by Maths experts to help you in doubts & scoring excellent marks in Class 10 exams.
Related Playlists
Similar Questions
Use Graph paper for this question.
A survey regarding height ( in cm) of 60 boys belonging to Class 10 of a school was conducted. The following data was recorded.
Taking 2 cm = height of 10 cm along one axis and 2 cm = 10 boys along the other axis draw an ogive of the above distribution. Use the graph to estimate the following :
(iii) if above 158 cm is considered as the tall boys of the class. Find the number of boys in the class who are tall.View SolutionA survey reagarding the heights ( in cm) of 50 girls of class X of a school was conducted and the following data was obtained. Find the mean
 View Solution
A survery regrding the heights (in cm ) of 50 girls of a class conducted and the following data was obatained.

Find the mean of above data.View SolutionThe marks obtained (out of 100) by 400 students in an examination are given below:

Using a graph paper, draw an ogive for the above distribution. Use ogive to estimate the following: estimate the median.View SolutionThe weight of 50 workers is given below :

Draw an ogive of the given distribution using a graph sheet. Take 2 cm = 10 kg on one axis and 2 cm = 5 workers along the other axis. Use a graph to estimate the following the upper and lower quartiles.View SolutionThe following table shows the distribution of the heights of a group of students:

Use a graph sheet to draw an Ogive for the distribution. Use the Ogive to find:
the inter quartile rangeView SolutionThe following distribution represents the height of 160 students of a school.

Draw an ogive for the given distribution taking 2 cm = 5 cm of height on one axis and 2 cm = 20 cm students on the other axis. Using the graph, determine.
(i) The median height.View SolutionThe following table shows the distribution of the heights of a group of students:

Use a graph sheet to draw an Ogive for the distribution. Use the Ogive to find:
the number of students whose height is more than 168 cmView SolutionThe following table shows the distribution of the heights of a group of students:

Use a graph sheet to draw an Ogive for the distribution. Use the Ogive to find:
the number of students whose height is less than 148 cm.View SolutionUse graph paper for this question. Take 2cm=1 unit on both the axes.
Construct the locus of points equidistance from A and B.View Solution


