The curve given below show enzymatic activity with relation to three conditions (pH, temperature and substrate concentration)
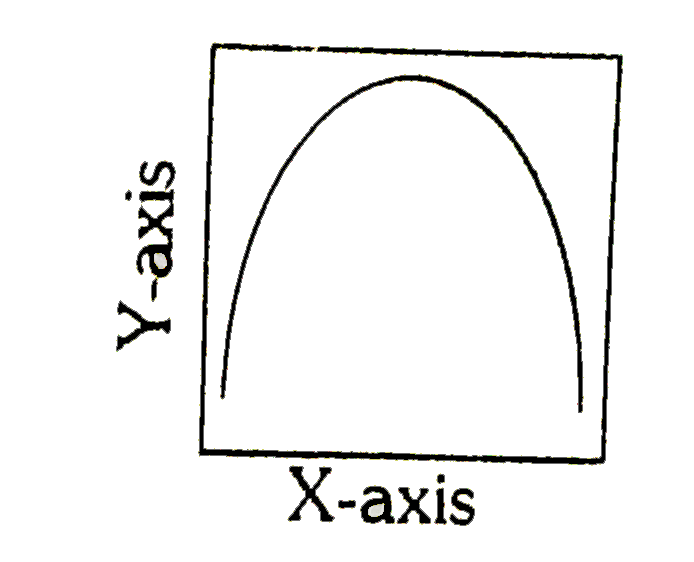
What do the two axises (x and y) represent
X-axisY-axisTemperature −Enzyme activity
X-axisY-axisSubstrate −Enzymatic activity
X-axisY-axisEnzymatic activity −Temperature
X-axisY-axisEnzymatic activity −pH
The correct Answer is:A
X-axis represents temperature and Y-axis . represent enzyme activity. All enzyme act at an optimum temperature, above and below this temperature. the enzyme activity declines.
Similar Questions
the curve given below shows wnzymatic acitvity with relation to three conditions (pH , temperature and substrate concentration ).
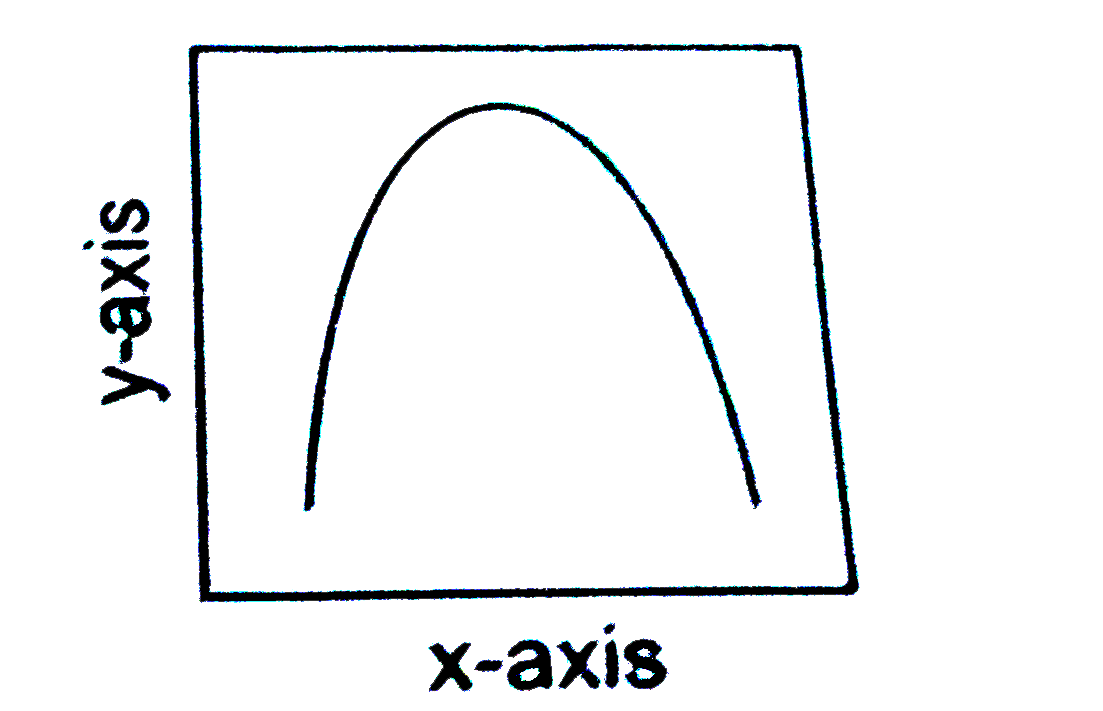
what do the two axes ( x and y) represent ?
View SolutionThe given curve shows enzymatic activity with relation to three conditions (pH, temperature & substrate concentration) What do the two axes (x & y) represent?
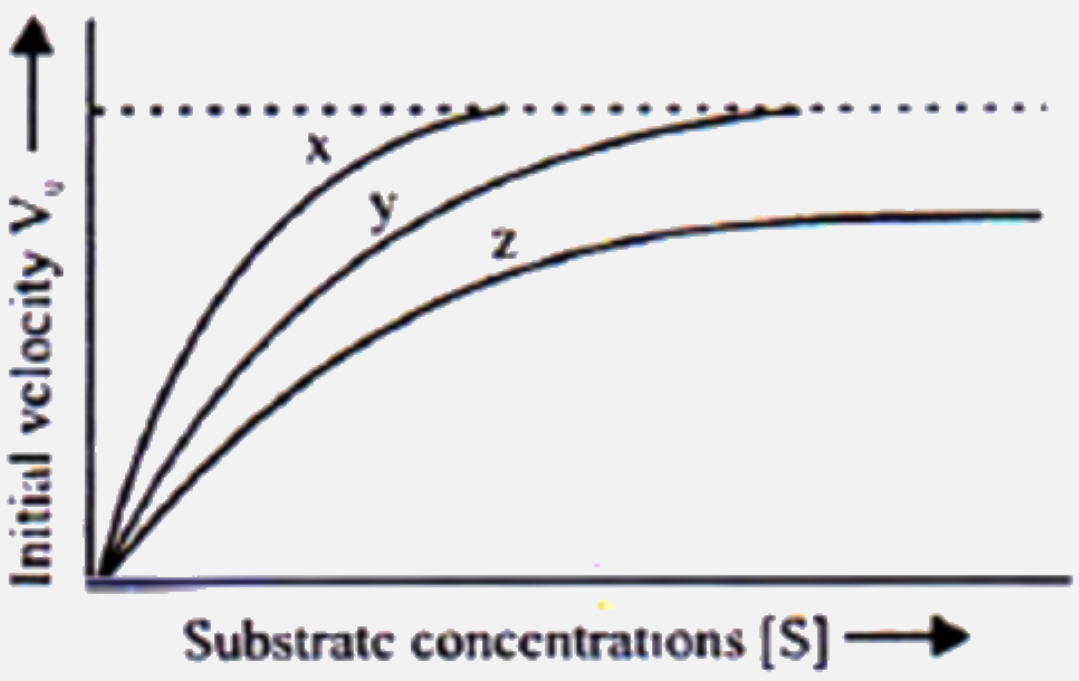
View SolutionFigure given below shows three velocity-substrate concentration curves for an enzyme reaxtion. What do the curves for an enzyme reaction. What do the curves depict
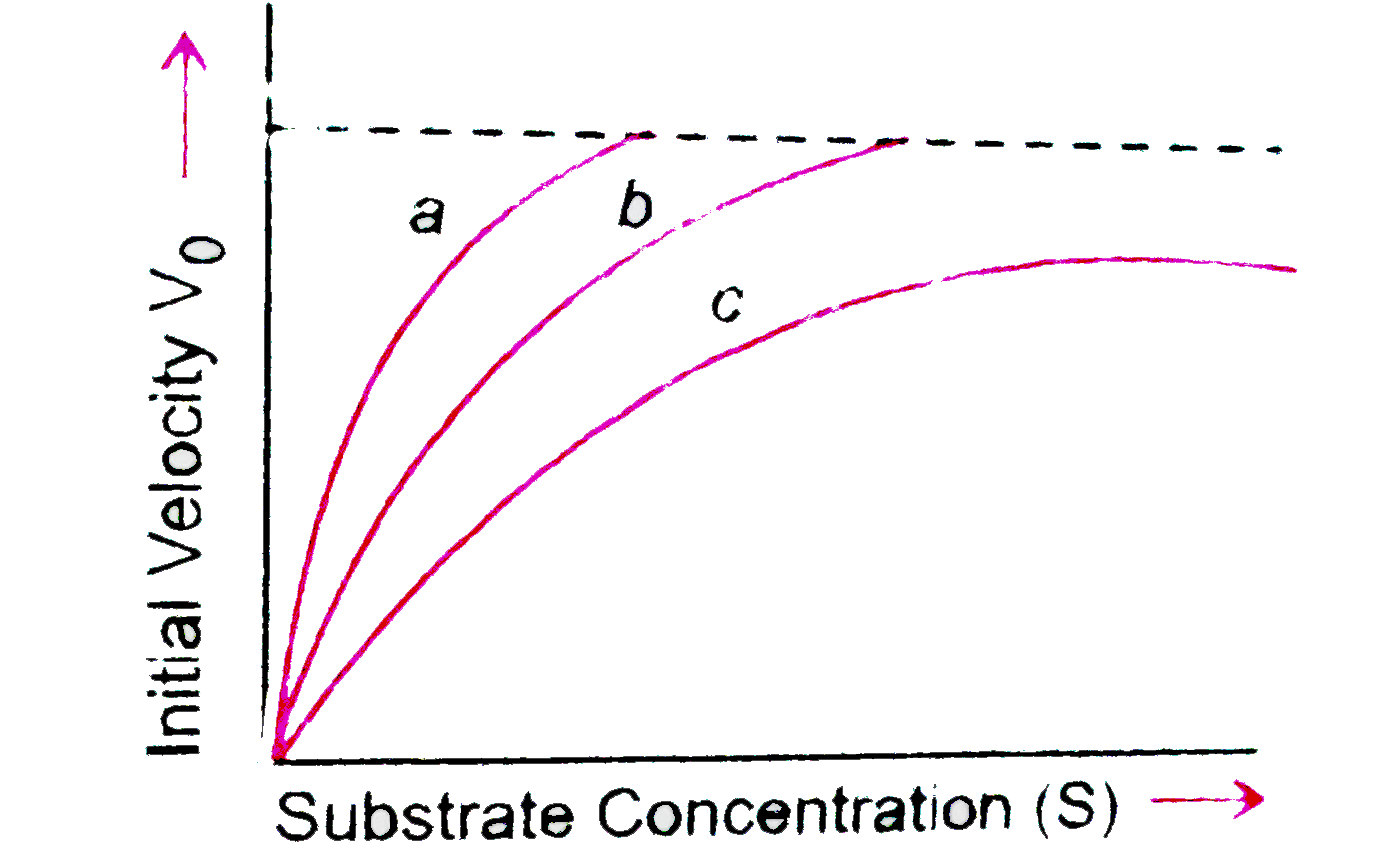
View SolutionThe Given figure shows three velocity-substrate concentration curves of an enzyme reaction. What do the curves X Y and Z depict respectively ?
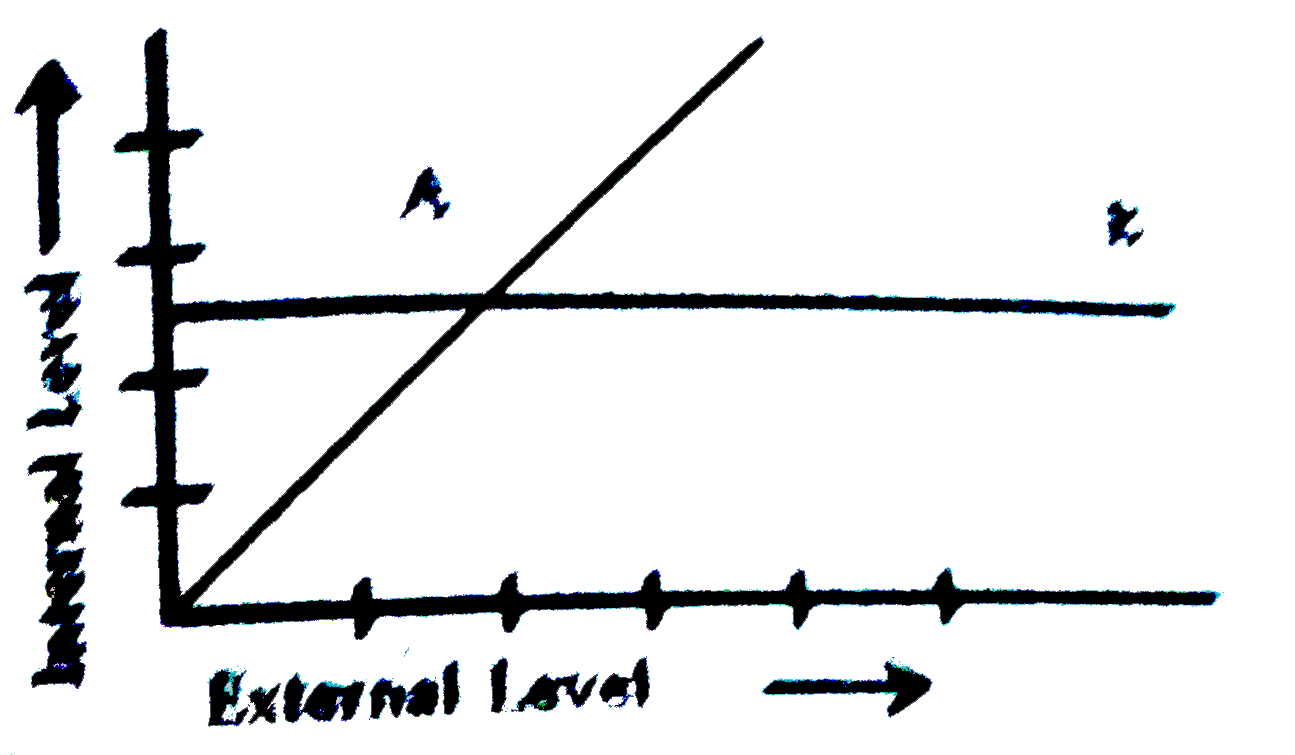
View Solution(a) The graph given below represents the organisms response to temperature as an environmental condition.
(i) Which one of the two lines represents conformers and why ?
(ii) What does the other line in the graph represent and why ?
(b) Mention the different adaptations the parasites have evolved with, to be able to successfully complete their life cycles in their hosts.
View SolutionThe diagram in Fig. 11.8 below shows the change of phases of a substance on a temperature-time graph on heating the substances at a constant rate.
(a) What do the parts AB, BC, CD and DE represent?
(b) What is the melting point of the substance ?
(c) What is the boiling point of the substance ?
View SolutionThe plot given below shows P – T curves (where P is the pressure and T is the temperature) for two solvents X and Y and isomolal solutions of NaCl in these solvents. NaCl completely dissociates in both the solvents.

On addition of equal number of moles of a non-volatile solute S in equal amount (in kg) of these solvents, the elevation of boiling point of solvent X is three times that of solvent Y. Solute S is known to undergo dimerization in these solvents. If the degree of dimerization is 0.7 in solvent Y, the degree of dimerization in solvent X is ______________.
View SolutionWhat is denoted by X and Y in the given graph?
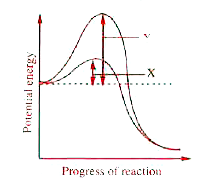
XY1) Activation energy without enzymeActivation energy with enzyme2) Activation energy with enzyme Activation energy without enzyme3) Substrate concentration with enzymeSubstrate concentration without enzyme4) Substrate concentration without enzymeSubstrate concentration with enzyme
View Solution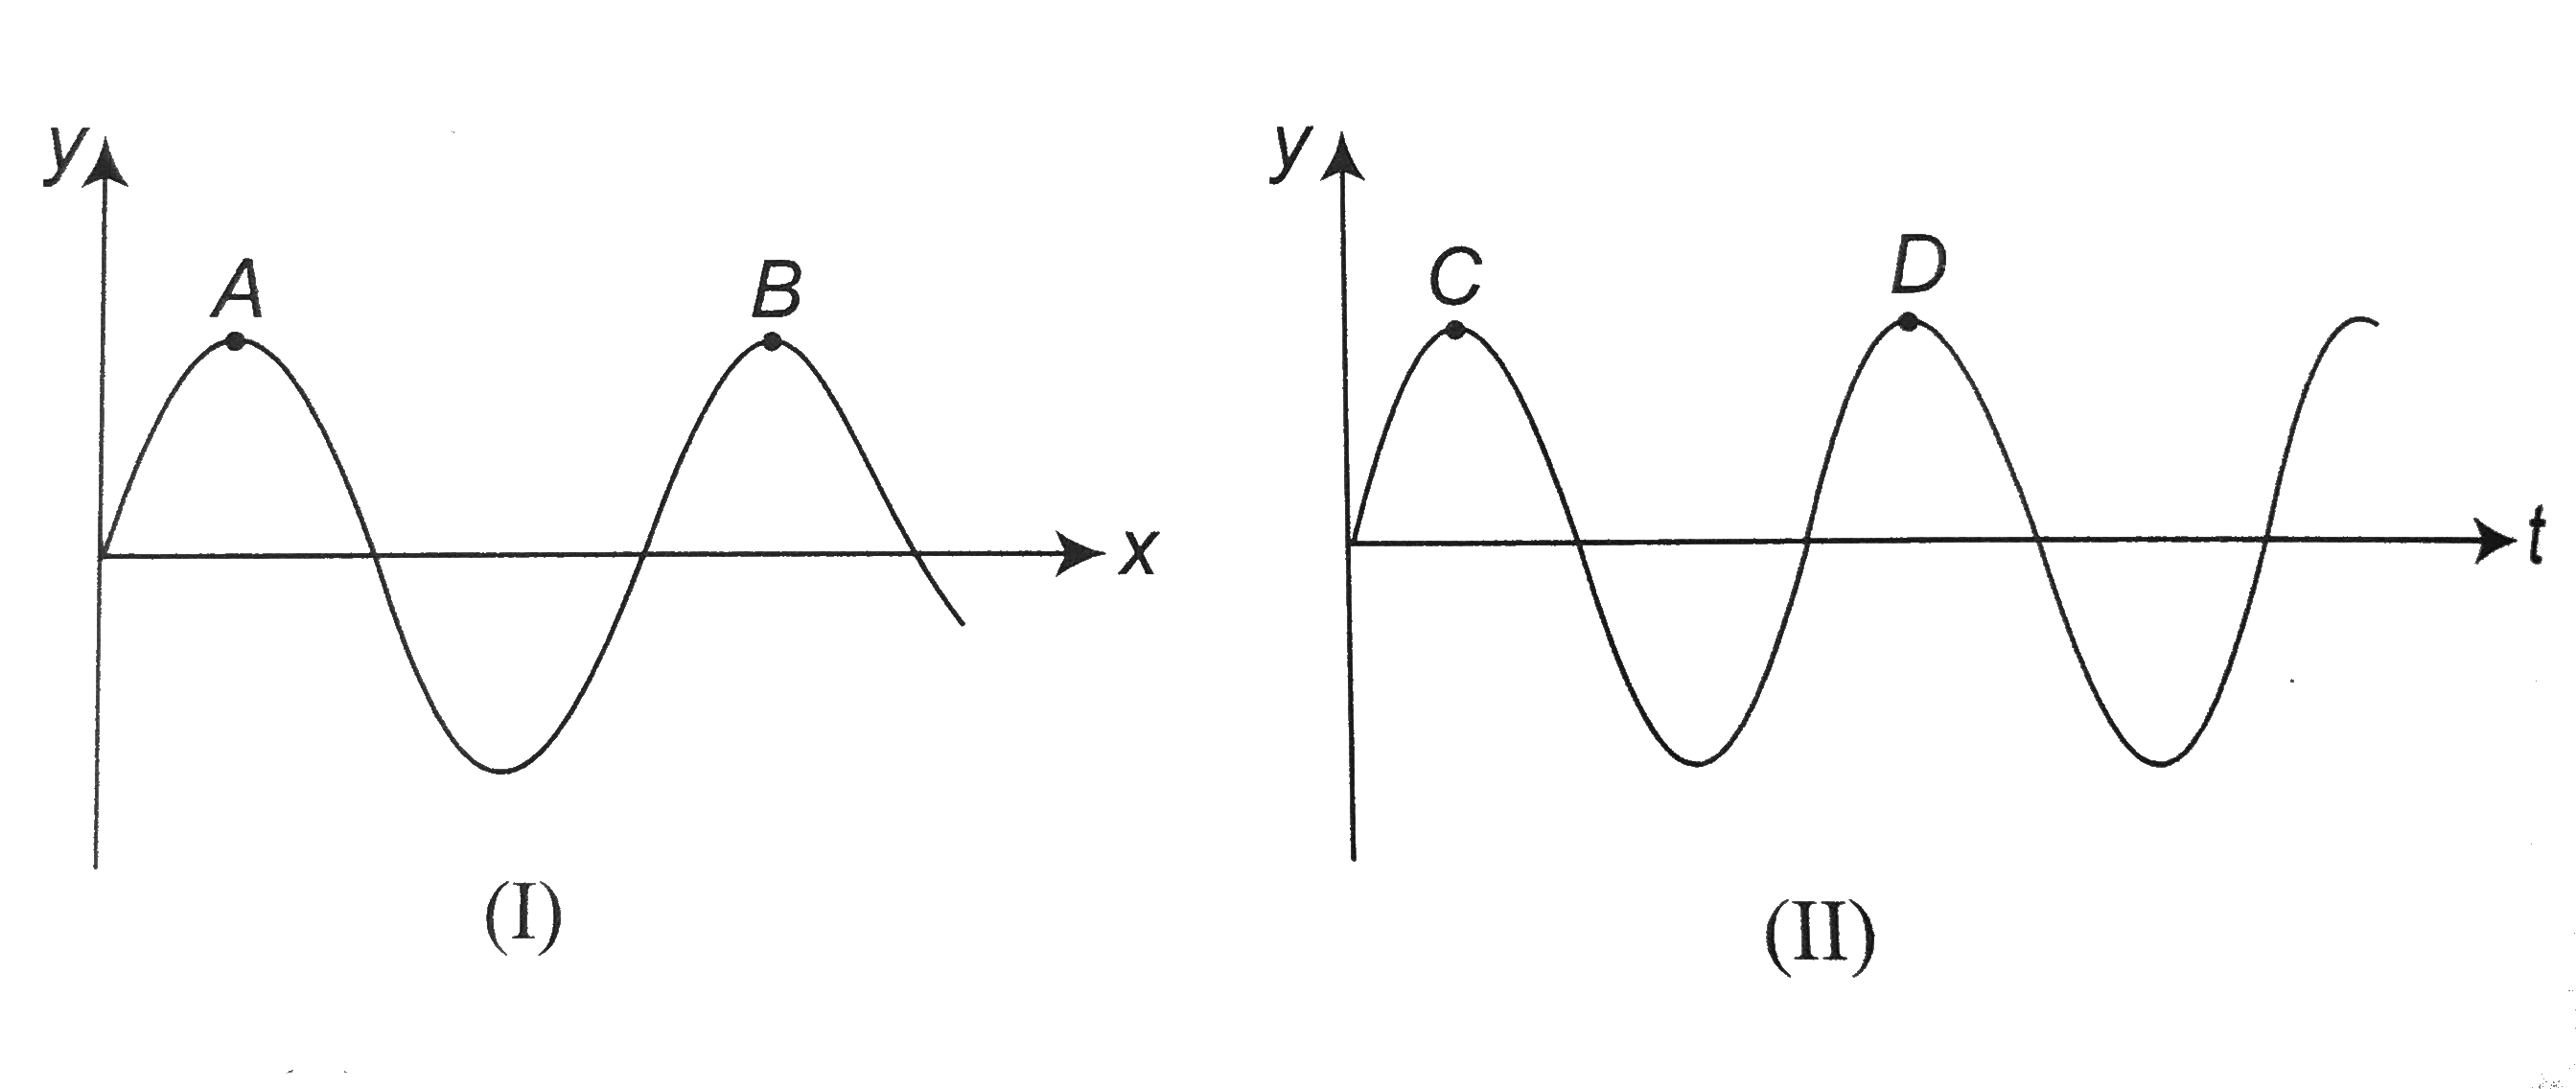
The same progressive wave is represented by two graphs I and II. Graph I shows how the displacement y varies with the distance x along the wave at a given time. Graph II shows how y varies with time t at a given point on the wave. The ratio of measurements AB to CD, marked on the curves represents:
View SolutionThe figure given below represents the set-up at the start of certain experiment to demonstrate an activity of plants:
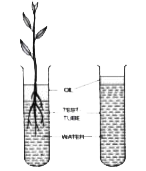
What will be the observations in the two test tubes after about 2-3 days ?
View Solution
