(a) The graph given below represents the organisms response to temperature as an environmental condition.
(i) Which one of the two lines represents conformers and why ?
(ii) What does the other line in the graph represent and why ?
(b) Mention the different adaptations the parasites have evolved with, to be able to successfully complete their life cycles in their hosts.
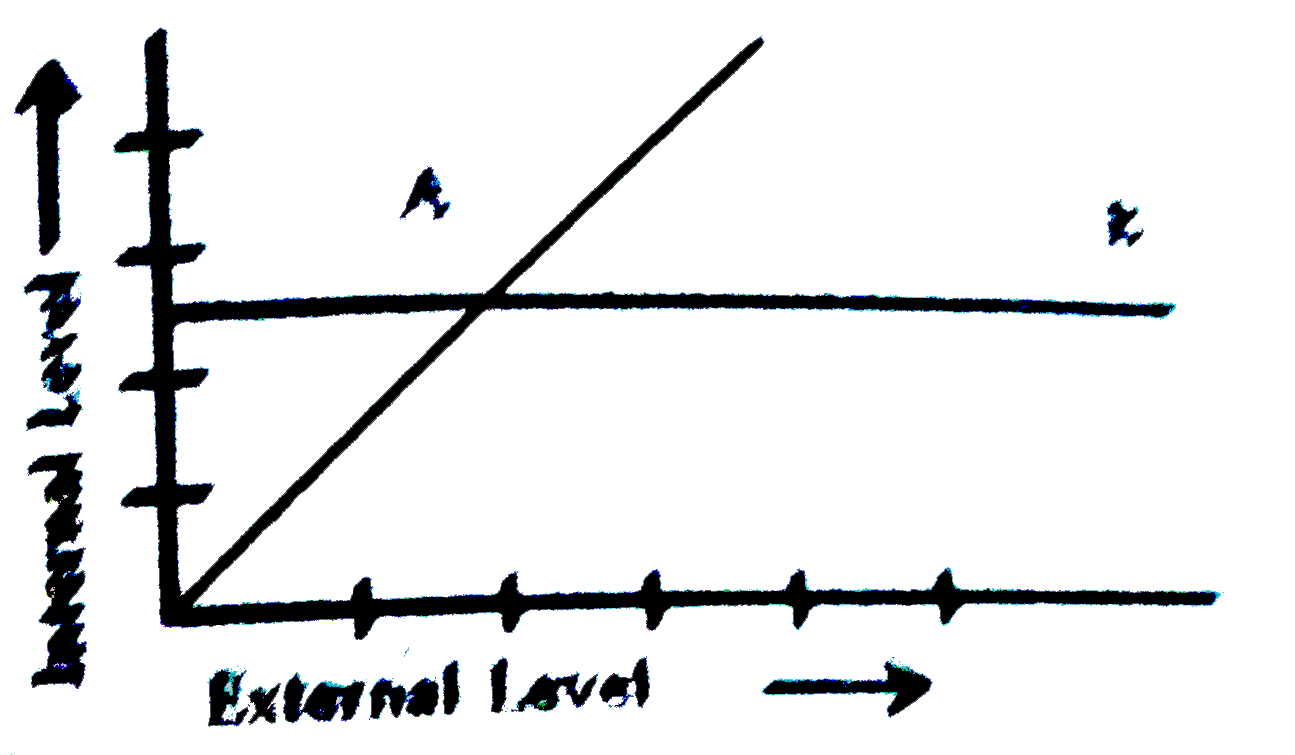
(i) Conformers : Aquatic animals and plants in which the osmotic concentration of body fluids changes according to the ambient conditions of water are called conformers.
(ii) Regulators : Some organisms are able to maintain homeostasis by physiological means which ensures constant body temperature, constant osmotic concentration etc.
Topper's Solved these Questions
- XII BOARDSBOOK - XII BOARD PREVIOUS YEAR PAPER ENGLISHCHAPTER - XII BOARDSEXERCISE - Delhi Board : Set II Section-A
1 Videos
- XII BOARDSBOOK - XII BOARD PREVIOUS YEAR PAPER ENGLISHCHAPTER - XII BOARDSEXERCISE - DELHI BOARD : SET-III (SECTION -A)
2 Videos
- XII BOARDSBOOK - XII BOARD PREVIOUS YEAR PAPER ENGLISHCHAPTER - XII BOARDSEXERCISE - OUTSIDE DELHI: SET III (SECTION A)
2 Videos
- SAMPLE PAPER 2019BOOK - XII BOARD PREVIOUS YEAR PAPER ENGLISHCHAPTER - SAMPLE PAPER 2019EXERCISE - Section E Part B
3 Videos
Similar Questions
The diagrams, given below, represent two inequations A and B on real number line.

(i) Write down A and B in set builder notations.
(ii) Represent A∩BandA'∩B on two different numbers lines.
View SolutionThe diagram given below represents a surgical sterilization method in males.
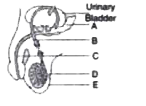
Study the same and answer the questions that follow: (i) Name the parts marked A, B, C, D and E.
(ii) Give the name of the surgical method represented in the diagram.
(iii) Which part is ligated or cut ?
(iv) Name the corresponding surgical method conducted on females.
(V) Name the part which is ligated in females and why?
View Solution
Knowledge Check
The graph given below represents changes in different ecological parameters due to effluent mixing in a stream. The three lines A, B anc C represent
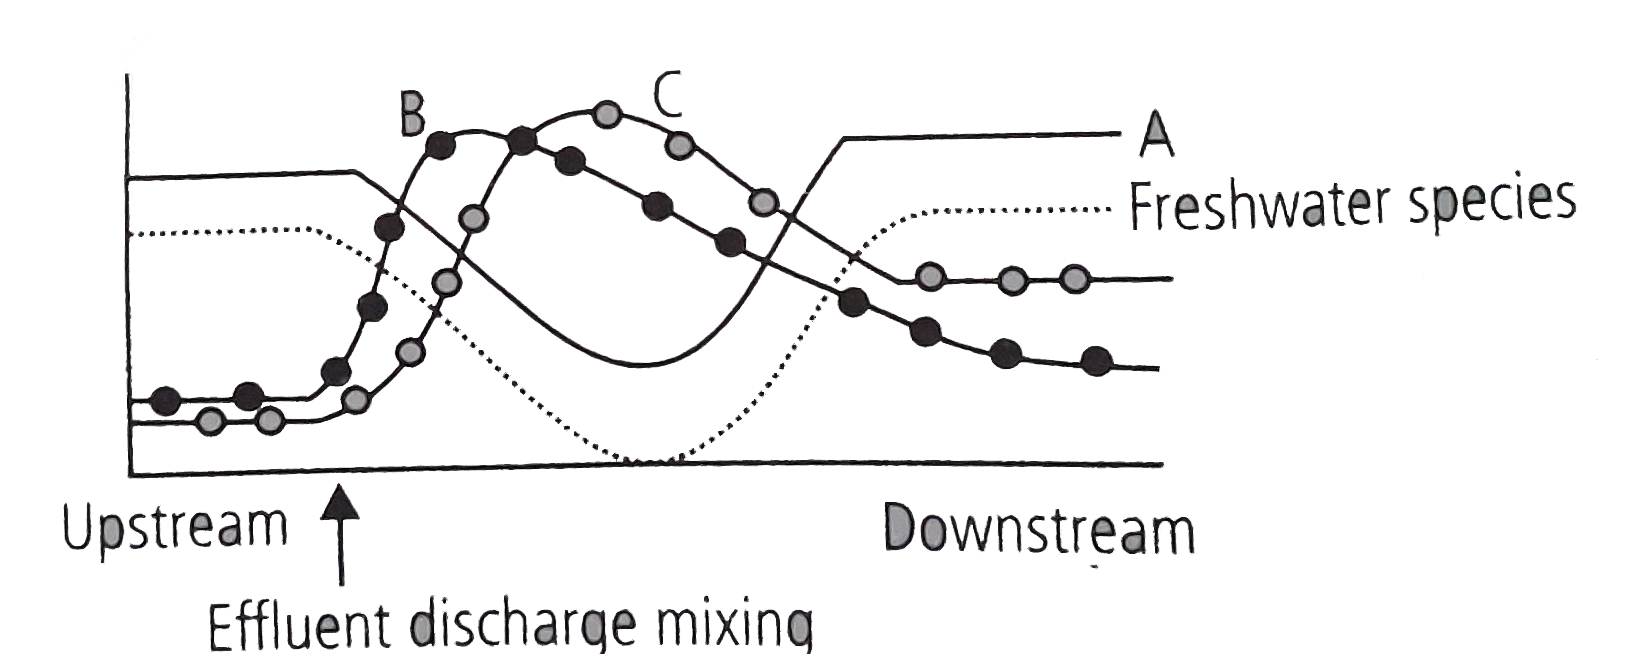 AA: oxygen concentration
B: biological O2 demand
C: pollution resistant speciesBA: pollutan
B: aerobic process
C: anaerobic processCA: oxygen concentration
B: CO2 concentration
C: termperatureDA: phosphate concentration
B: nitrate concentration
C: rate of photosynthesis.
The diagram given below is that of a structure present in a human kidney. Study the same and answer the questions that follows :
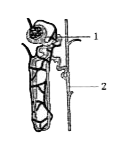
(i) Name the structure represented in the diagram.
(ii) What is the liquid entering part T called? Name two substances present in this liquid that are reabsorbed in the tubule.
(iii) What is the fluid that comes to part '2' called? Name the main nitrogenous waste in it.
(iv) Mention the three main steps involved in the formation of the fluid mentioned in (iii) above.
(v) Name the substance which may be present in the fluid part '11 if a person suffer from diabetes mellitus.
View SolutionIn the diagram ( given below ) the broken lines represents the paths followed by particles W,,X,Y and Z respectively through the constant field E. The numbers below the field represents meters.
In previous question if the particles started from rest and all are positively charge which particles must have been acted upon by a force other than that produced by the electric field.
A. W and Y
B. X and Z
C. X,Y and Z
D. W,X,Y and Z
View SolutionTwo friends Seema and Aditya work in the same office at Delhi. In the Christmas vacations, both decided to go to their hometowns represented by Town A and Town B respectively in the figure given below. Town A and Town B are connected by trains from the same station C (in the given figure)in Delhi.Based on the given situation, answer the following questions:
img src="https://d10lpgp6xz60nq.cloudfront.net/physics_images/MATH_041_X_SQP_E03_007_Q01.png" width="80%"gt
(i) Who will travel more distance, Seema or Aditya, to reach to their hometown?
(ii) Seema and Aditya planned to meet at a location D situated at a point D represented by the mid-point of the line joining the points represented by Town A and Town B. Find the coordinates of the point represented by the point D .
(iii) Find the area of the triangle formed by joining the points represented by A, B and C.
View Solution(i) Gas A is more soluble in water than Gas (B) at the same temperature. Which one of the two gases will have the higher value of KH (Henry's constant) and why?
(ii) In non-ideal solution, what type of deviation shows the formation of maximum boiling azeotropes ?
View Solution(a) The diagram given below is that of a developing human foetus in the womb. Study the same and then answer the questions that follow :
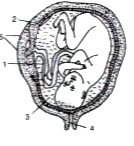
(i) Name the parts '1' and '5' indicated by guidelines.
(ii) What term is given to the period of development of the foetus in the womb ?
(iii) How many days does the foetus take to be fully developed ?
(iv) Mention two functions of the part labelled 2 other than its endocrine function.
(v) Name the hormone (any one) produce by the part labelled 2
(vi) What is the function of the part marked 3 ?
(b) Give the exact location of amnion.
[ICSE 2011, 2014]
View SolutionThe diagram given below represents an endocrine gland in the human body. Study the diagram and answer the following questions :
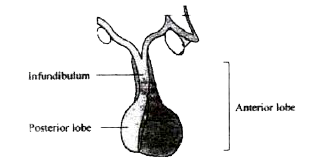
(i) Identify the endocrine gland. Where is it located?
(ii) Why is the above gland referred to as the 'Master gland' ?
(iii) Name the hormone which in deficiency causes Diabetes Insipidus. How does this disorder differ from Diabetes Mellitus ?
(iv) Explain the term 'Hormone'.
What is the role of Tropic hormones in the human body?
(v) Which lobe of the above gland secretes:
1. Oxytocin
2. ACTH
3. Growth hormone.
View SolutionStudy the graph given below and answer the questions that follow:

i) Write the status of food and space in the curves a) and b).
ii) In the absence of predators, which one of the two curves would appropriately depict the prey population?
iii) Time has been shown on X-axis and there is a parallel dotted line above it. Give the significance of this dotted line.
View Solution
