Oxygen dissociation curve of haemoglobin is
sigmoid
hyperbolic
linear
hypobolic
The correct Answer is:A
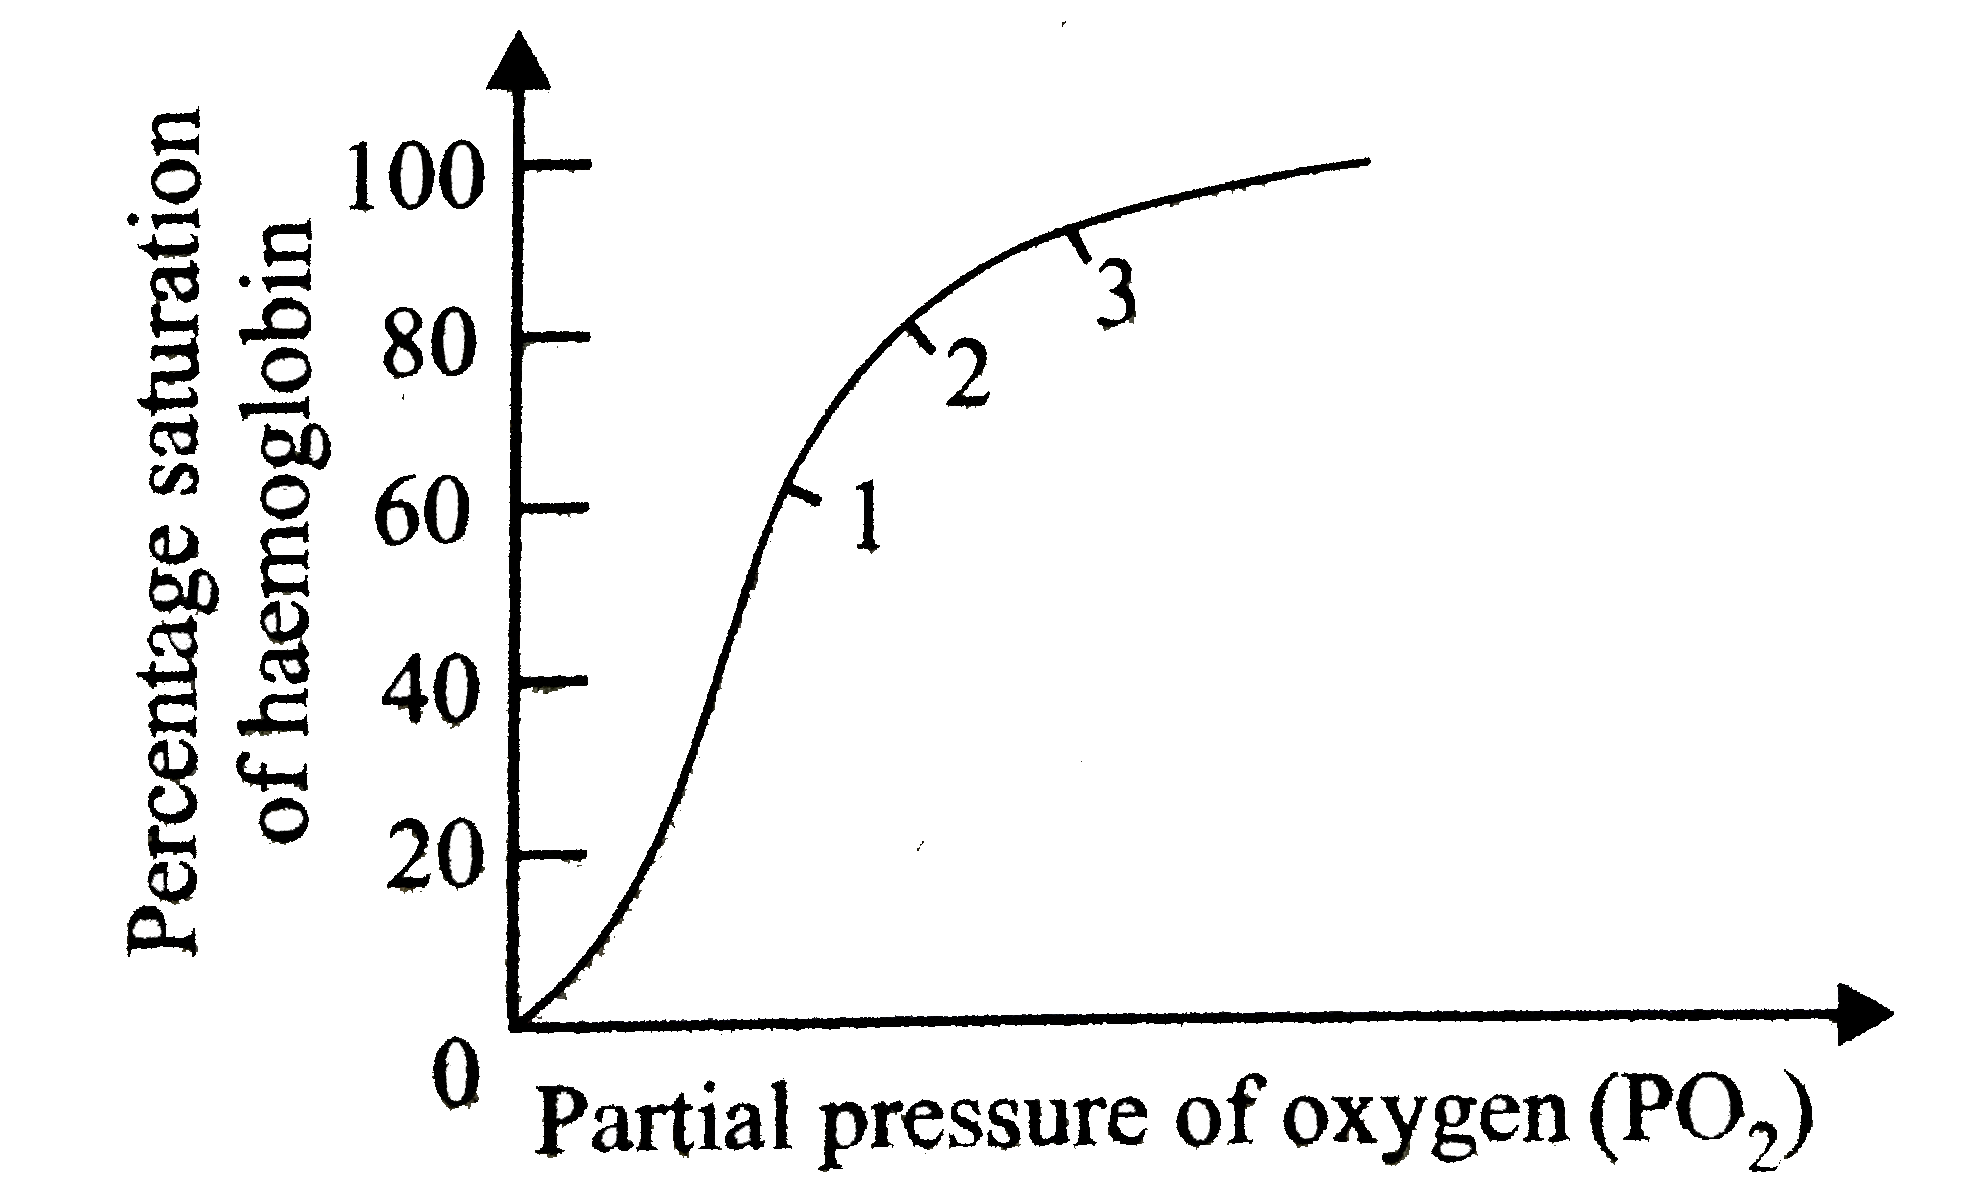
oxygen haemoglobin dissociation curve gives the relationship between the saturation of haemoglobin and oxygen tension the curve aginst time is sigmoid at 38∘C and pH 7.4 Dissociation of oxyghaemoglobin can be promoted by rise in the body temperature and low pH (highCO2)
Similar Questions
Knowledge Check
- Question 1 - Select One
The given graph shows an oxygen dissociation curve for haemoglobin.

Wher is the body will haemoglobin be saturated at the percentage shown at point 1,2 and 3 in graph ?ALeft ventriclePulmonary veinVena cava123BLeft ventriclePulmonary veinVena cava213CLeft ventriclePulmonary veinVena cava231DLeft ventriclePulmonary veinVena cava321 - Question 2 - Select One
The oxygen dissociation curve is
AparabolaBslopeCsigmoidDstright line.
Oxygen dissociation curve is
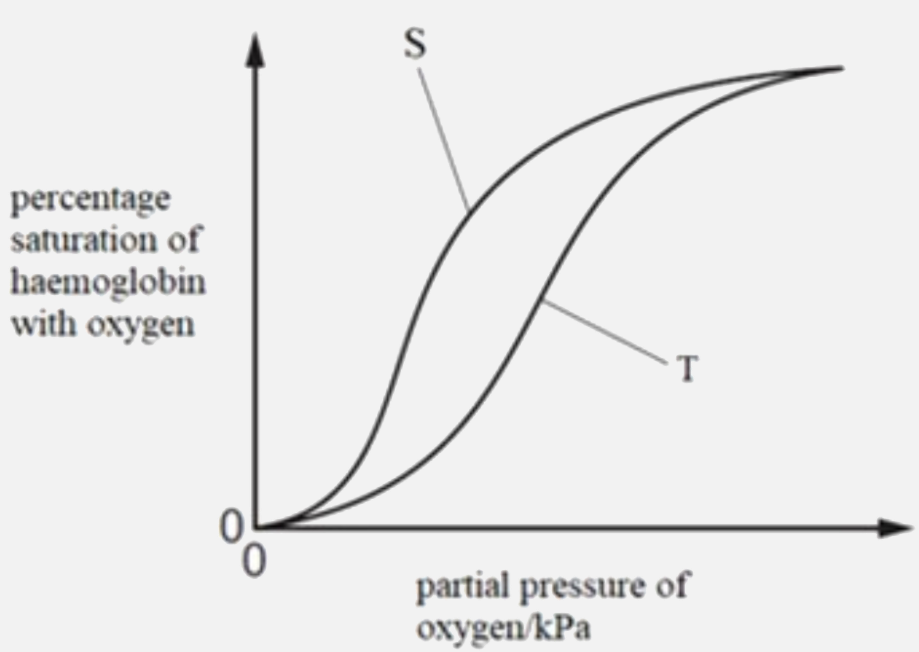
View SolutionThe graph shows the oxygen dissociation curves of haemoglobin from two species of mammals, s and T .

Which statements could explain the difference in the oxygen dissociation curves of species S and species T ?
I. Species T has higher haemoglobin concentration in its red blood cells than species S.
II. The haemoglobin in species T has a lower affinity for oxygen than the haemoglobin in species S.
III. Species T may be living at a higher altitudes than species S.View SolutionWhat is the shape of O2 dissociation curve for haemoglobin ?
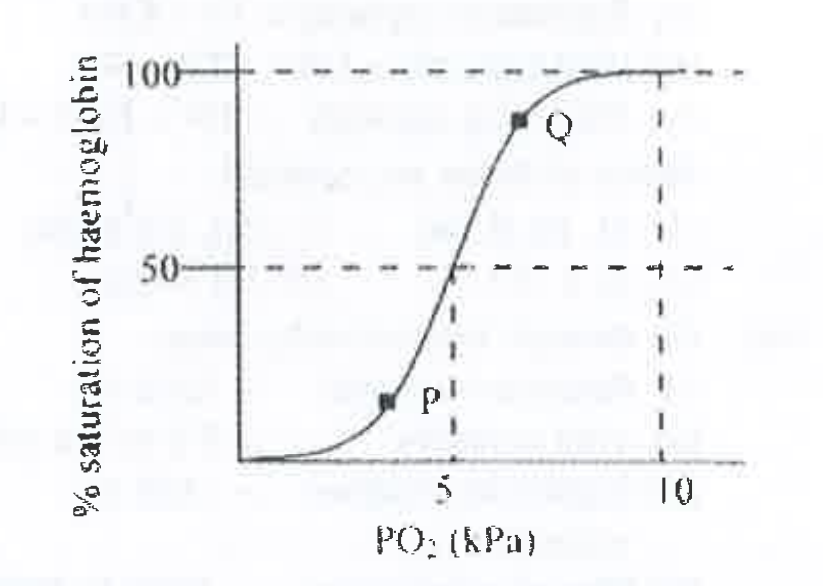
View SolutionOxygen saturation curve of haemoglobin molecule is show in the graph

The correct representation of haemoglobin molecule at points p and q is respectivelyView SolutionAssertion :− Low concentration of oxygen allow dissociation of oxyhaemoglobin.
Reason :− CO has more affinity with Haemoglobin as compares to oxygen.View SolutionO2 dissociation curve is:
View Solution
