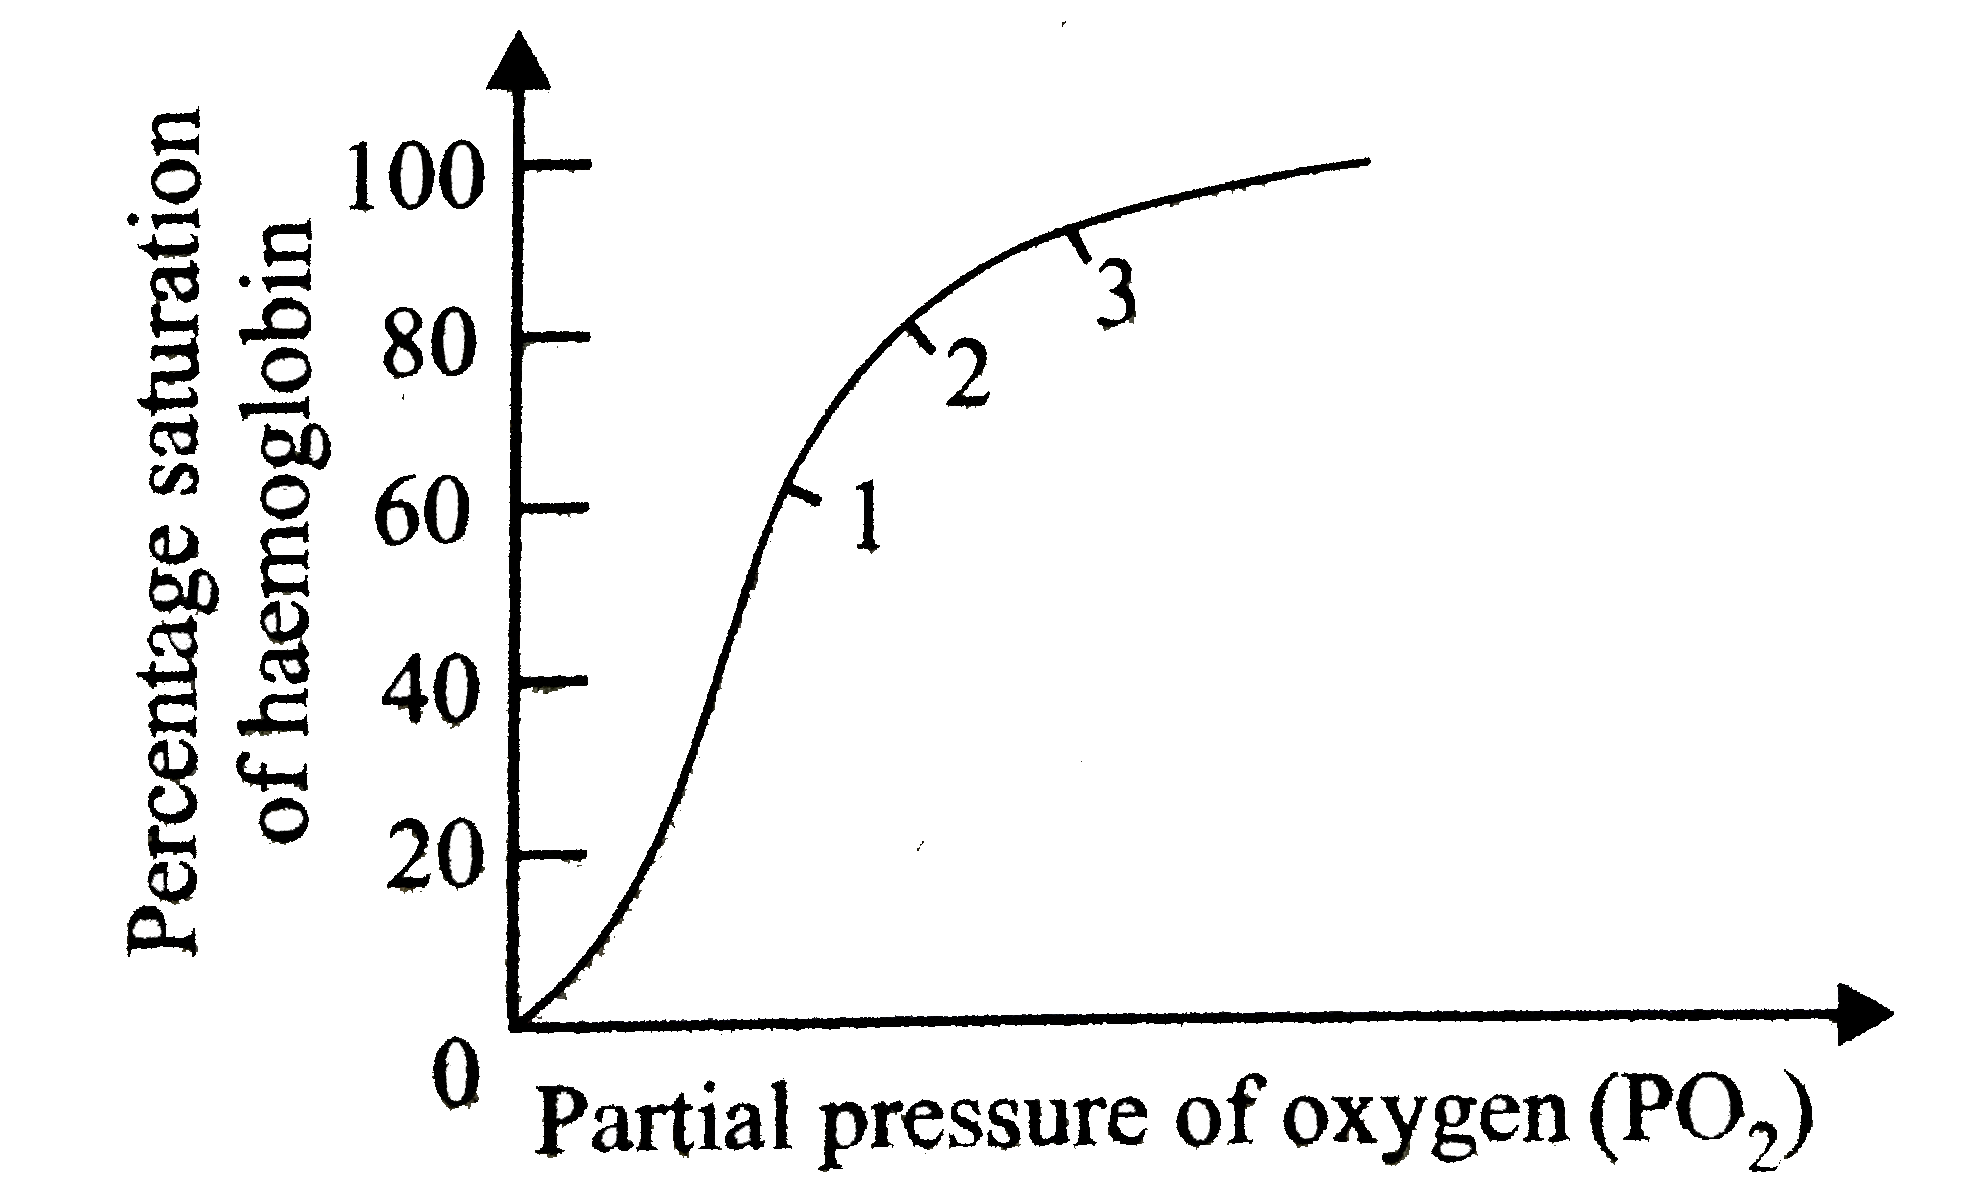
What is the shape of O2 dissociation curve for haemoglobin ?
It is sigmoid or 'S' shaped .
Topper's Solved these Questions
- BREATHING AND EXCHANGE OF GASES Book:AAKASH INSTITUTE ENGLISHChapter:BREATHING AND EXCHANGE OF GASES Exercise:EXERCISE
Explore 30 Videos
- BREATHING AND EXCHANGE OF GASES Book:AAKASH INSTITUTE ENGLISHChapter:BREATHING AND EXCHANGE OF GASES Exercise:ASSIGNMENT SECTION - A
Explore 35 Videos
- BREATHING AND EXCHANGE OF GASES Book:AAKASH INSTITUTE ENGLISHChapter:BREATHING AND EXCHANGE OF GASES Exercise:ASSIGNMENT SECTION - D
Explore 11 Videos
- BODY FLUIDS AND CIRCULATIONBook:AAKASH INSTITUTE ENGLISHChapter:BODY FLUIDS AND CIRCULATIONExercise:Assignment Section - D Assertion - Reason Type Questions
Explore 9 Videos
- CELL CYCLE AND CELL DIVISION Book:AAKASH INSTITUTE ENGLISHChapter:CELL CYCLE AND CELL DIVISION Exercise:SECTION-D (Assertion-Reason Type Questions )
Explore 10 Videos
Similar Questions
Knowledge Check
The given graph shows an oxygen dissociation curve for haemoglobin.

Wher is the body will haemoglobin be saturated at the percentage shown at point 1,2 and 3 in graph ?ALeft ventriclePulmonary veinVena cava123BLeft ventriclePulmonary veinVena cava213CLeft ventriclePulmonary veinVena cava231DLeft ventriclePulmonary veinVena cava321CO2 dissociates from carbamino haemoglobin when
APCO2 is high and PO2 is lowBPO2 is high and PCO2 is lowCPCO2 and PO2 are equalDnone of the above.The oxygen dissociation curve is
AparabolaBslopeCsigmoidDstright line.
Oxygen dissociation curve is
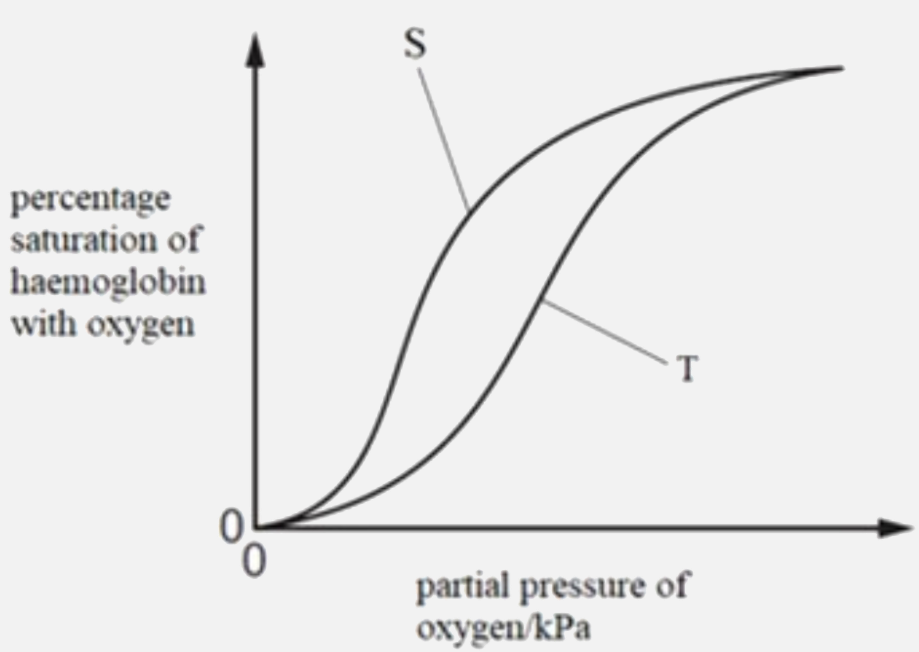
View SolutionThe graph shows the oxygen dissociation curves of haemoglobin from two species of mammals, s and T .

Which statements could explain the difference in the oxygen dissociation curves of species S and species T ?
I. Species T has higher haemoglobin concentration in its red blood cells than species S.
II. The haemoglobin in species T has a lower affinity for oxygen than the haemoglobin in species S.
III. Species T may be living at a higher altitudes than species S.
View SolutionO2 dissociation curve is shifted to right in all except
View SolutionWhat is the role of haemoglobin?
View SolutionWhen parital pressure of CO2(pCO2) rises the oxygen dissociation curve of haemoglobin will
View Solution

