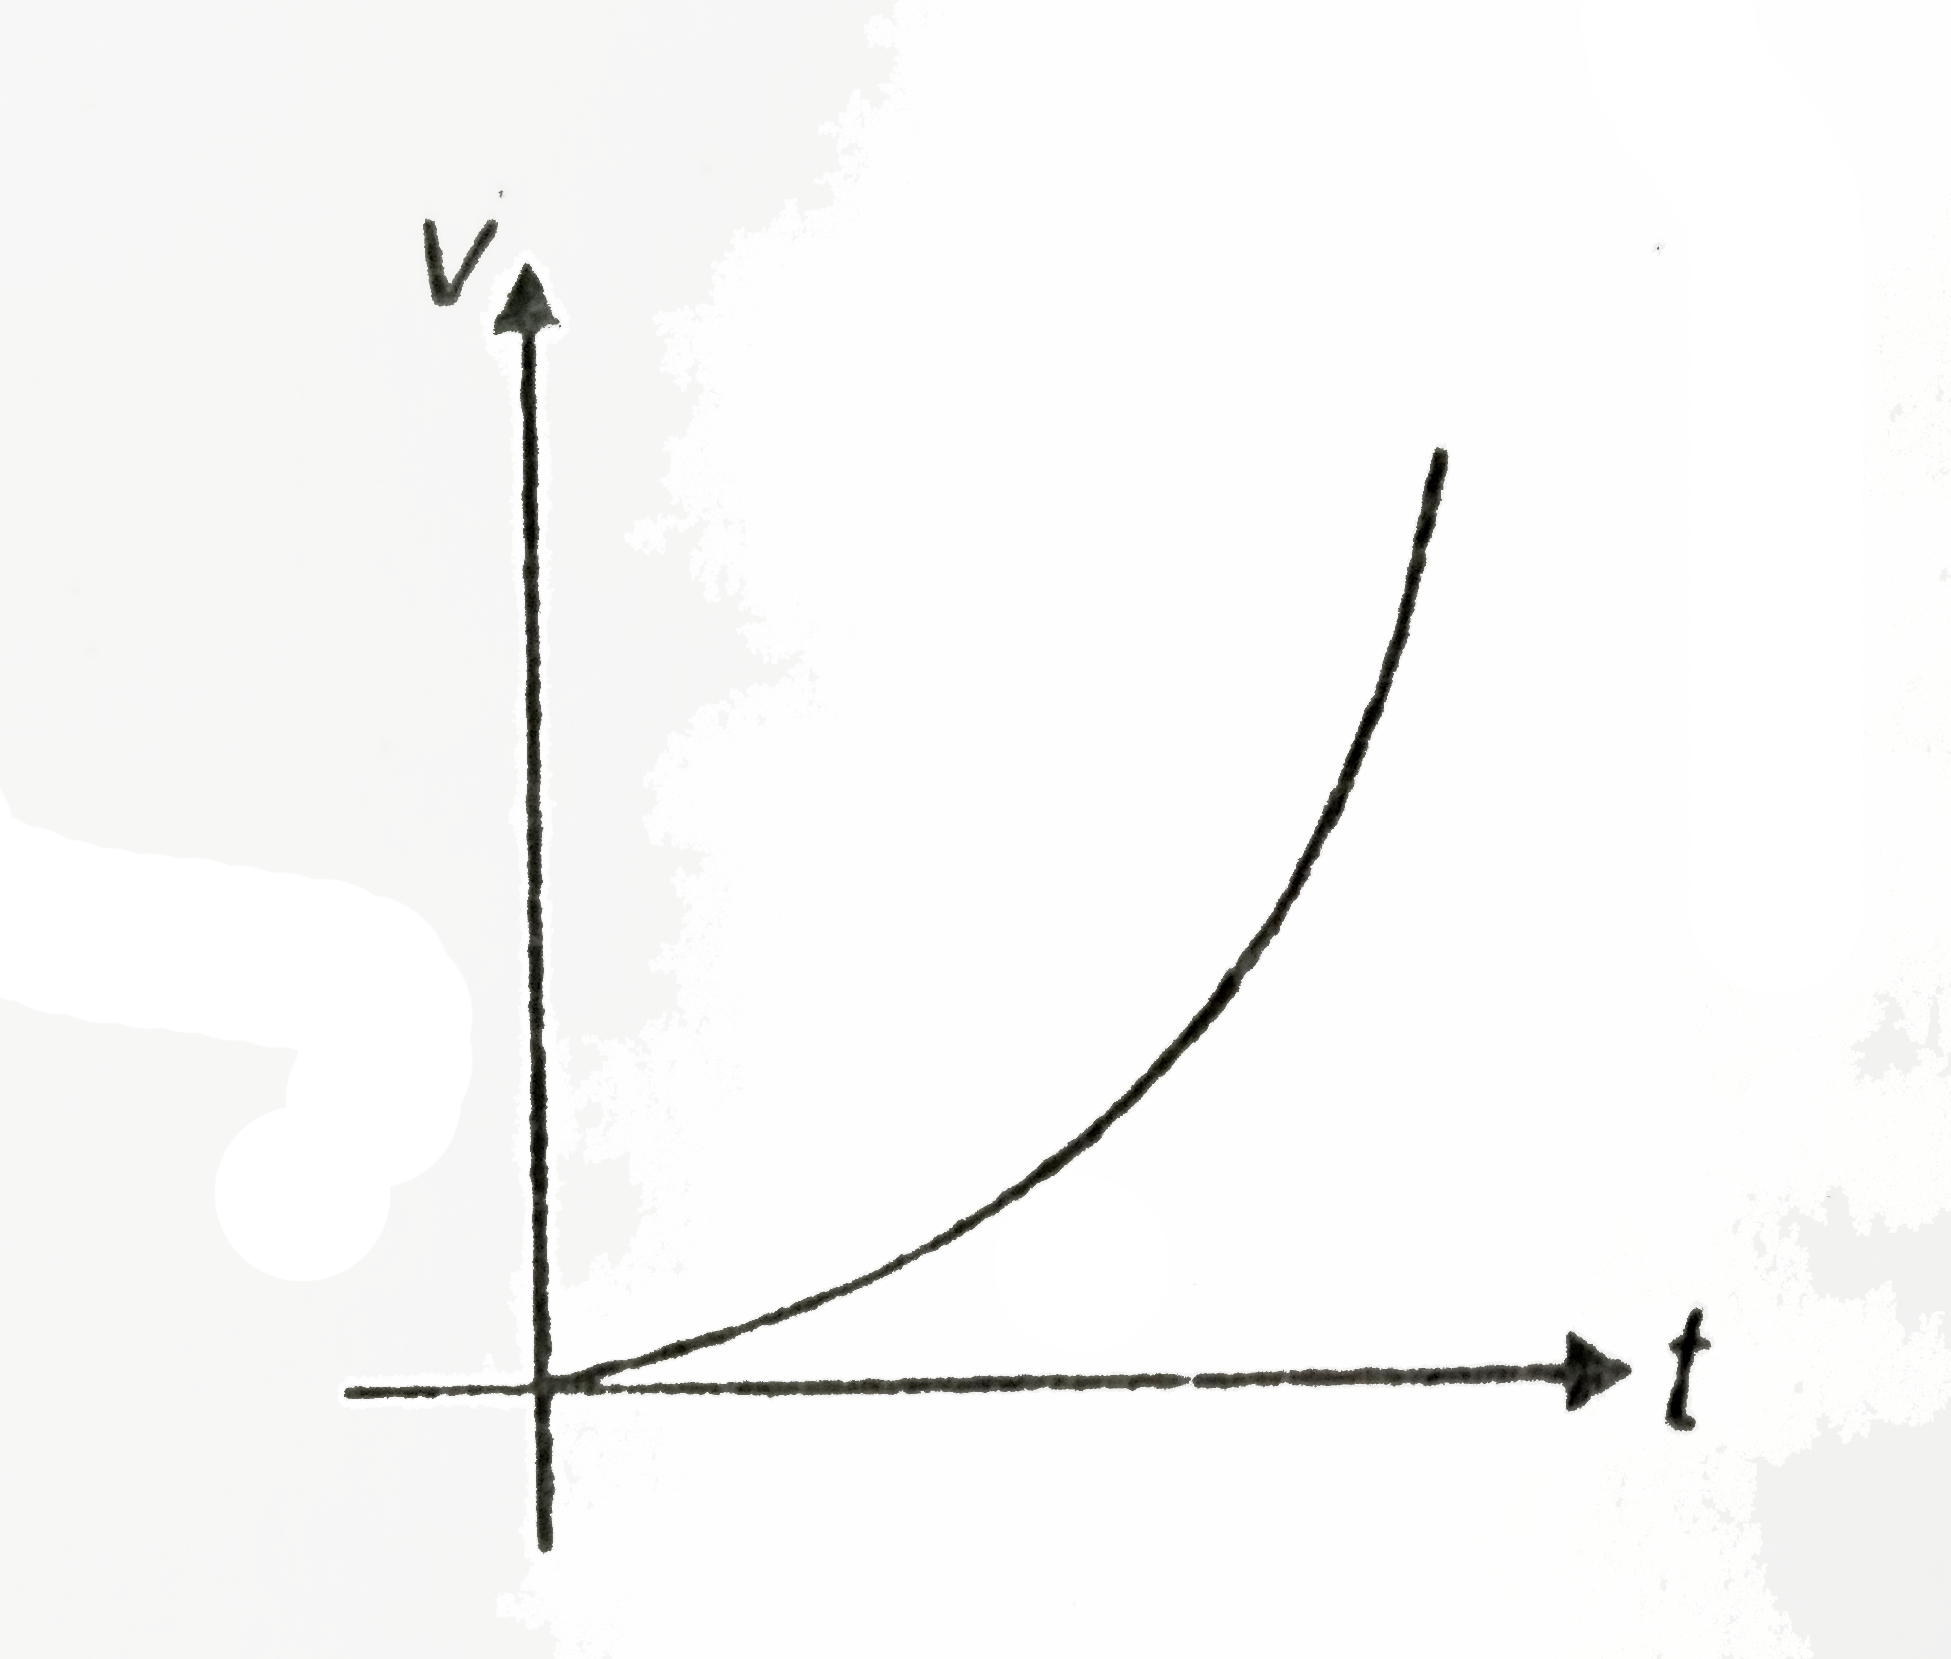
For a uniformly retarded motion, the velocity-time graph is :
a curve
a straight line parallel to the time axis
a straight line perpendicular to the time axis.
a straight line inclined to the time axis.
To determine the velocity-time graph for uniformly retarded motion, we can follow these steps:
1. Understanding Retarded Motion:
- Retarded motion refers to motion where the object is slowing down. This means that the acceleration (or retardation) is negative.
2. Identify the Characteristics of the Graph:
- In a velocity-time graph, the x-axis represents time, and the y-axis represents velocity.
- For uniformly retarded motion, the velocity decreases at a constant rate.
3. Determine the Slope:
- The slope of the velocity-time graph represents acceleration. Since we are dealing with uniformly retarded motion, the slope will be negative (indicating retardation).
- The slope will be a constant negative value.
4. Graph Representation:
- Start from a certain positive velocity on the y-axis (indicating the initial velocity).
- As time progresses (moving right along the x-axis), the velocity will decrease linearly.
- The graph will be a straight line that slopes downwards from left to right, indicating that the velocity is decreasing over time.
5. Final Graph Shape:
- The final shape of the graph will be a straight line inclined downwards towards the time axis, starting from a positive value on the velocity axis and approaching zero as time increases.
Final Graph:
- The velocity-time graph for uniformly retarded motion will look like a straight line sloping downwards from a positive velocity towards the time axis.
---
- Retarded motion refers to motion where the object is slowing down. This means that the acceleration (or retardation) is negative.
2. Identify the Characteristics of the Graph:
- In a velocity-time graph, the x-axis represents time, and the y-axis represents velocity.
- For uniformly retarded motion, the velocity decreases at a constant rate.
- The slope of the velocity-time graph represents acceleration. Since we are dealing with uniformly retarded motion, the slope will be negative (indicating retardation).
- The slope will be a constant negative value.
- Start from a certain positive velocity on the y-axis (indicating the initial velocity).
- As time progresses (moving right along the x-axis), the velocity will decrease linearly.
- The graph will be a straight line that slopes downwards from left to right, indicating that the velocity is decreasing over time.
- The final shape of the graph will be a straight line inclined downwards towards the time axis, starting from a positive value on the velocity axis and approaching zero as time increases.
- The velocity-time graph for uniformly retarded motion will look like a straight line sloping downwards from a positive velocity towards the time axis.
Topper's Solved these Questions
- MOTION IN ONE DIMENSION BOOK - ICSECHAPTER - MOTION IN ONE DIMENSION EXERCISE - EXERCISE -2 (B) ( Numericals )
12 Videos
- MOTION IN ONE DIMENSION BOOK - ICSECHAPTER - MOTION IN ONE DIMENSION EXERCISE - EXERCISE -2 (C)
3 Videos
- MOTION IN ONE DIMENSION BOOK - ICSECHAPTER - MOTION IN ONE DIMENSION EXERCISE - EXERCISE -2 (B)
19 Videos
- MEASUREMENTS AND EXPERIMENTATION BOOK - ICSECHAPTER - MEASUREMENTS AND EXPERIMENTATION EXERCISE - TOPIC 2 SIMPLE PENDULUM (4 Marks Questions )
1 Videos
- PRESSURE IN FLUIDS AND ATMOSPHERIC PRESSUREBOOK - ICSECHAPTER - PRESSURE IN FLUIDS AND ATMOSPHERIC PRESSUREEXERCISE - Exercise -4(B)Numericals
5 Videos
Similar Questions
Knowledge Check
Asserion : The acceleration of an object at a particular time is the slope of the velocity-time graph at that instant of time.
Reason : For uniform motion acceleration is zero.AIf both assertion and reason are trure and reason is the correct explanation of assertion.BIf both assertion and reason are true but reason is not the correct explanations of assertion.CIf assertion is true but reason is false.DIf both assertion and reason is false
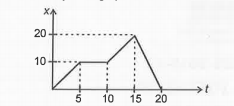
Graph of displacement (X) VS time (t) is given below for a particle moving in one-dimensional motion. The velocity time graph for this case would be
View SolutionA particle starts moving with initial velocity u=25ms−1 and retardation a=−2ms−2. Draw the velocity-time graph.
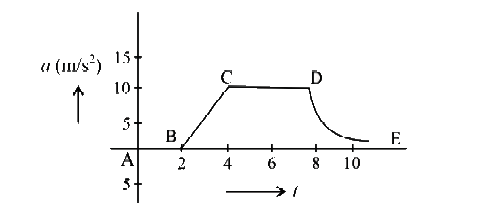
View SolutionThe uniform motion in the following acceleration-time graph is
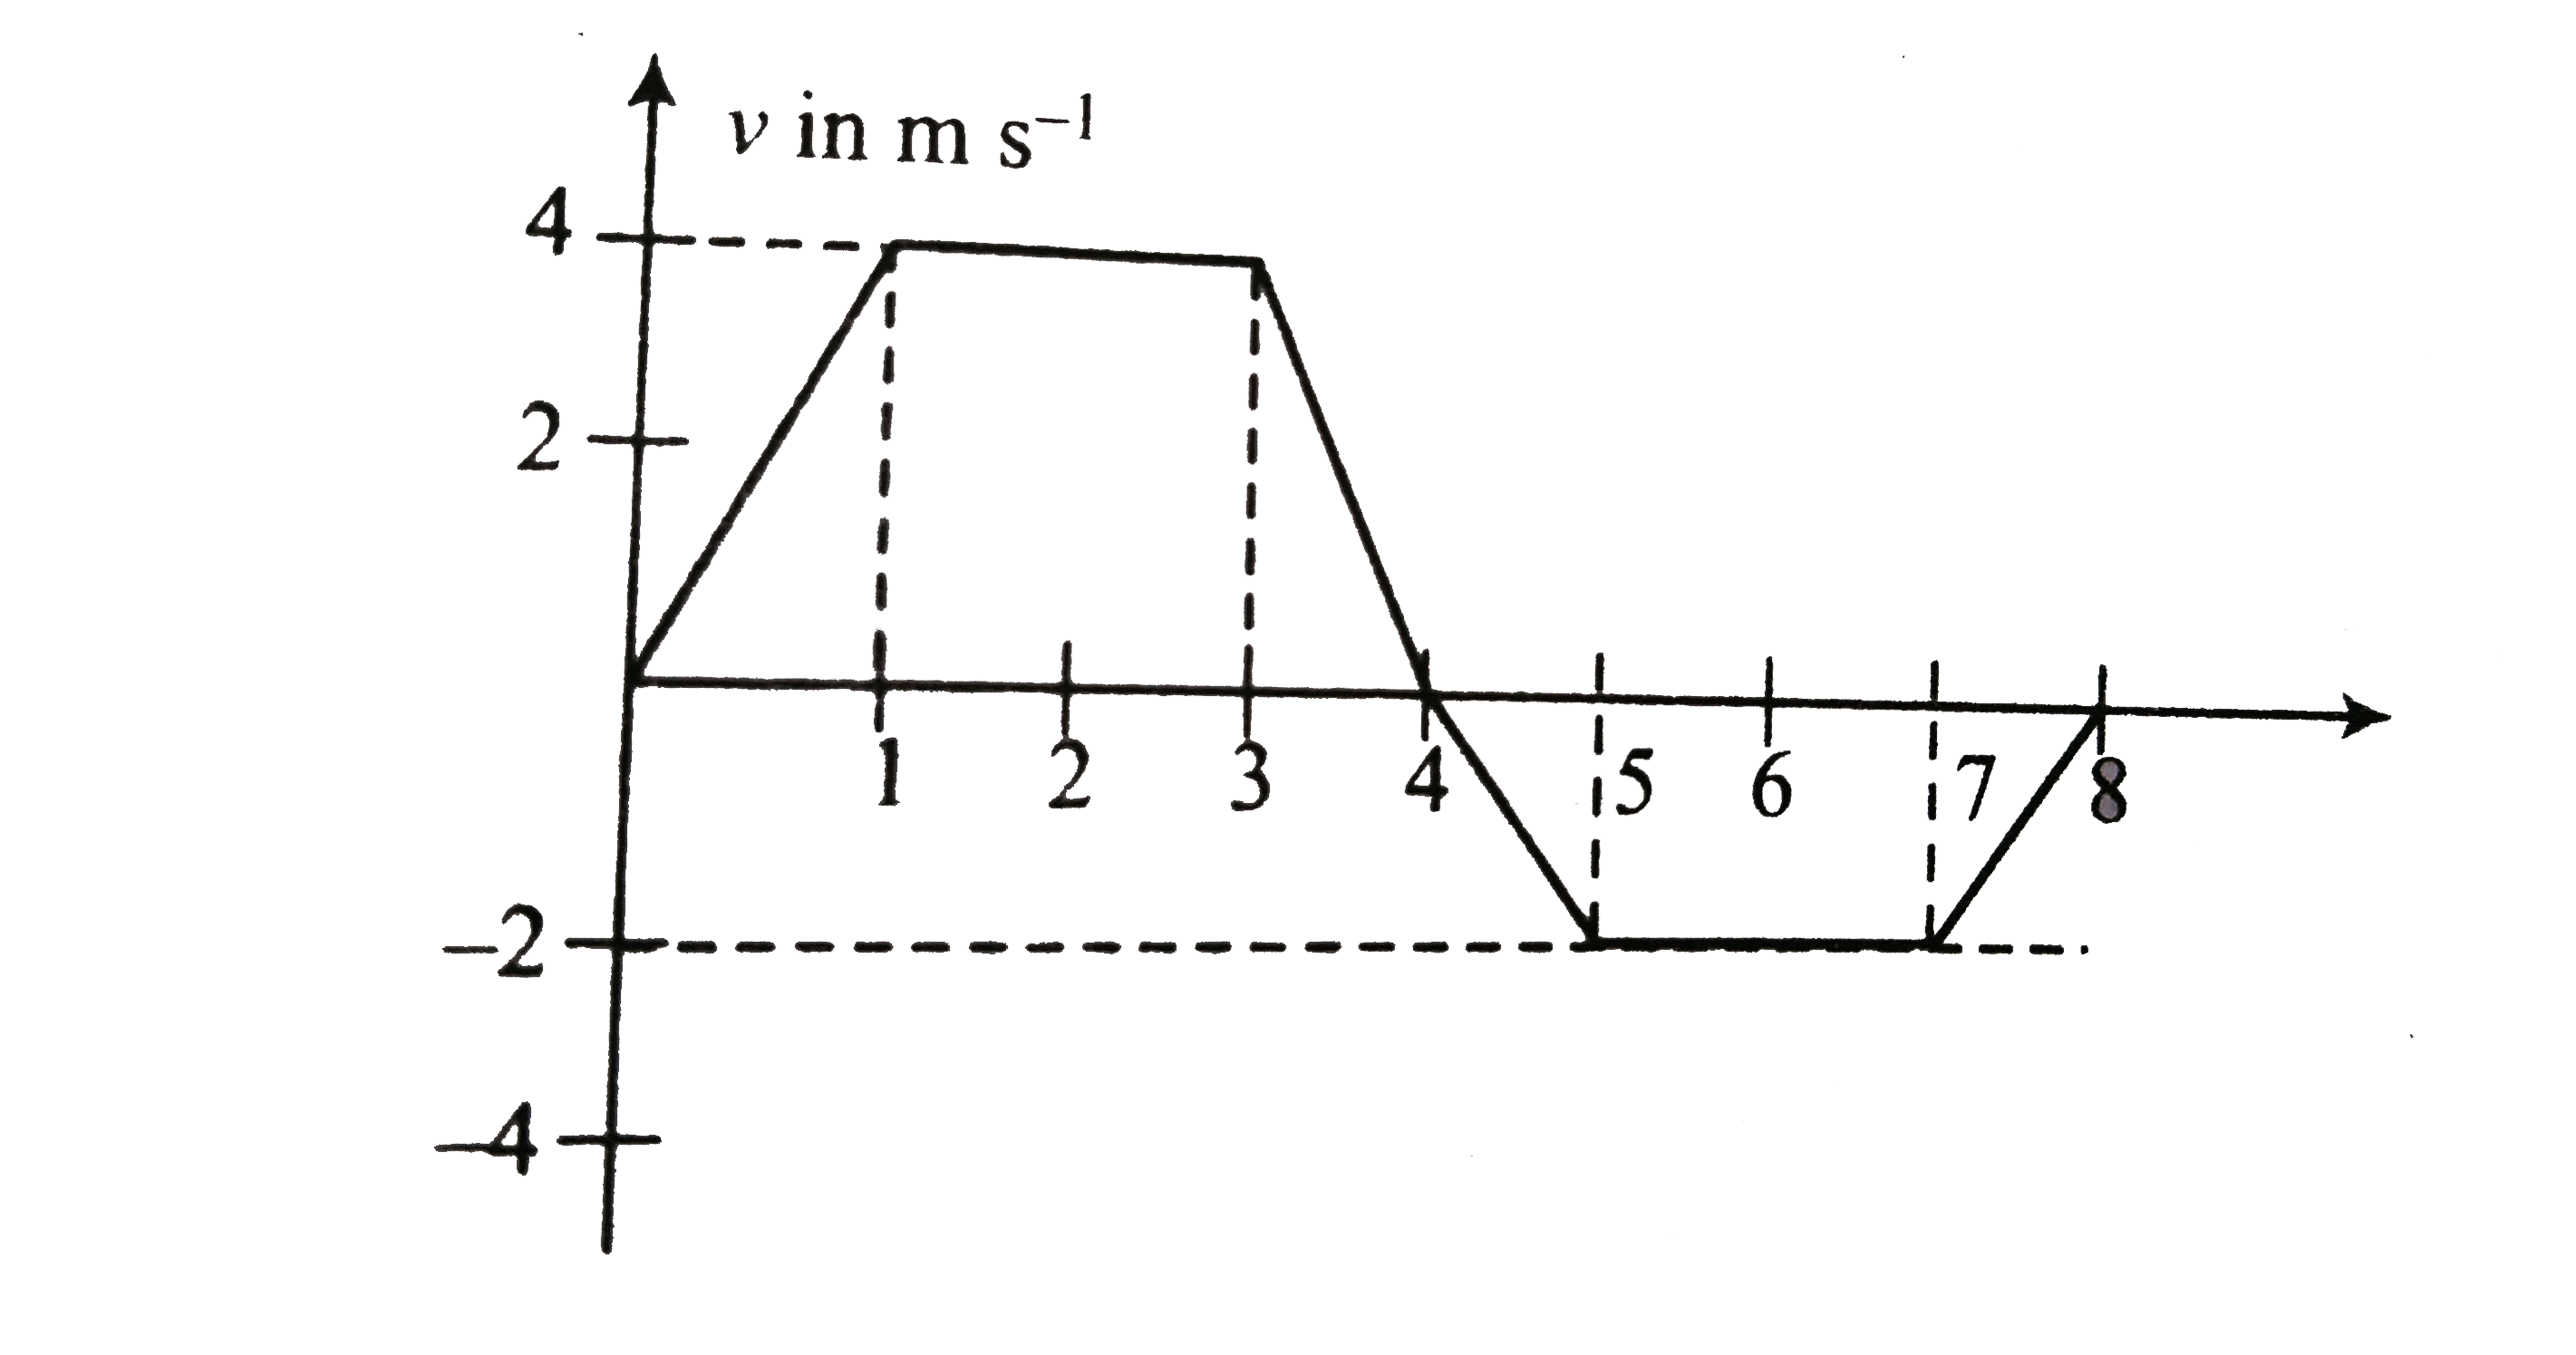
View SolutionThe velocity-time graph of a particle in straight line motion is velocity-time graph of a particle in straight line motion is shown in. The particle starts its motion from origin.
 .
.
The distance of the particle from the origin after 8s is .
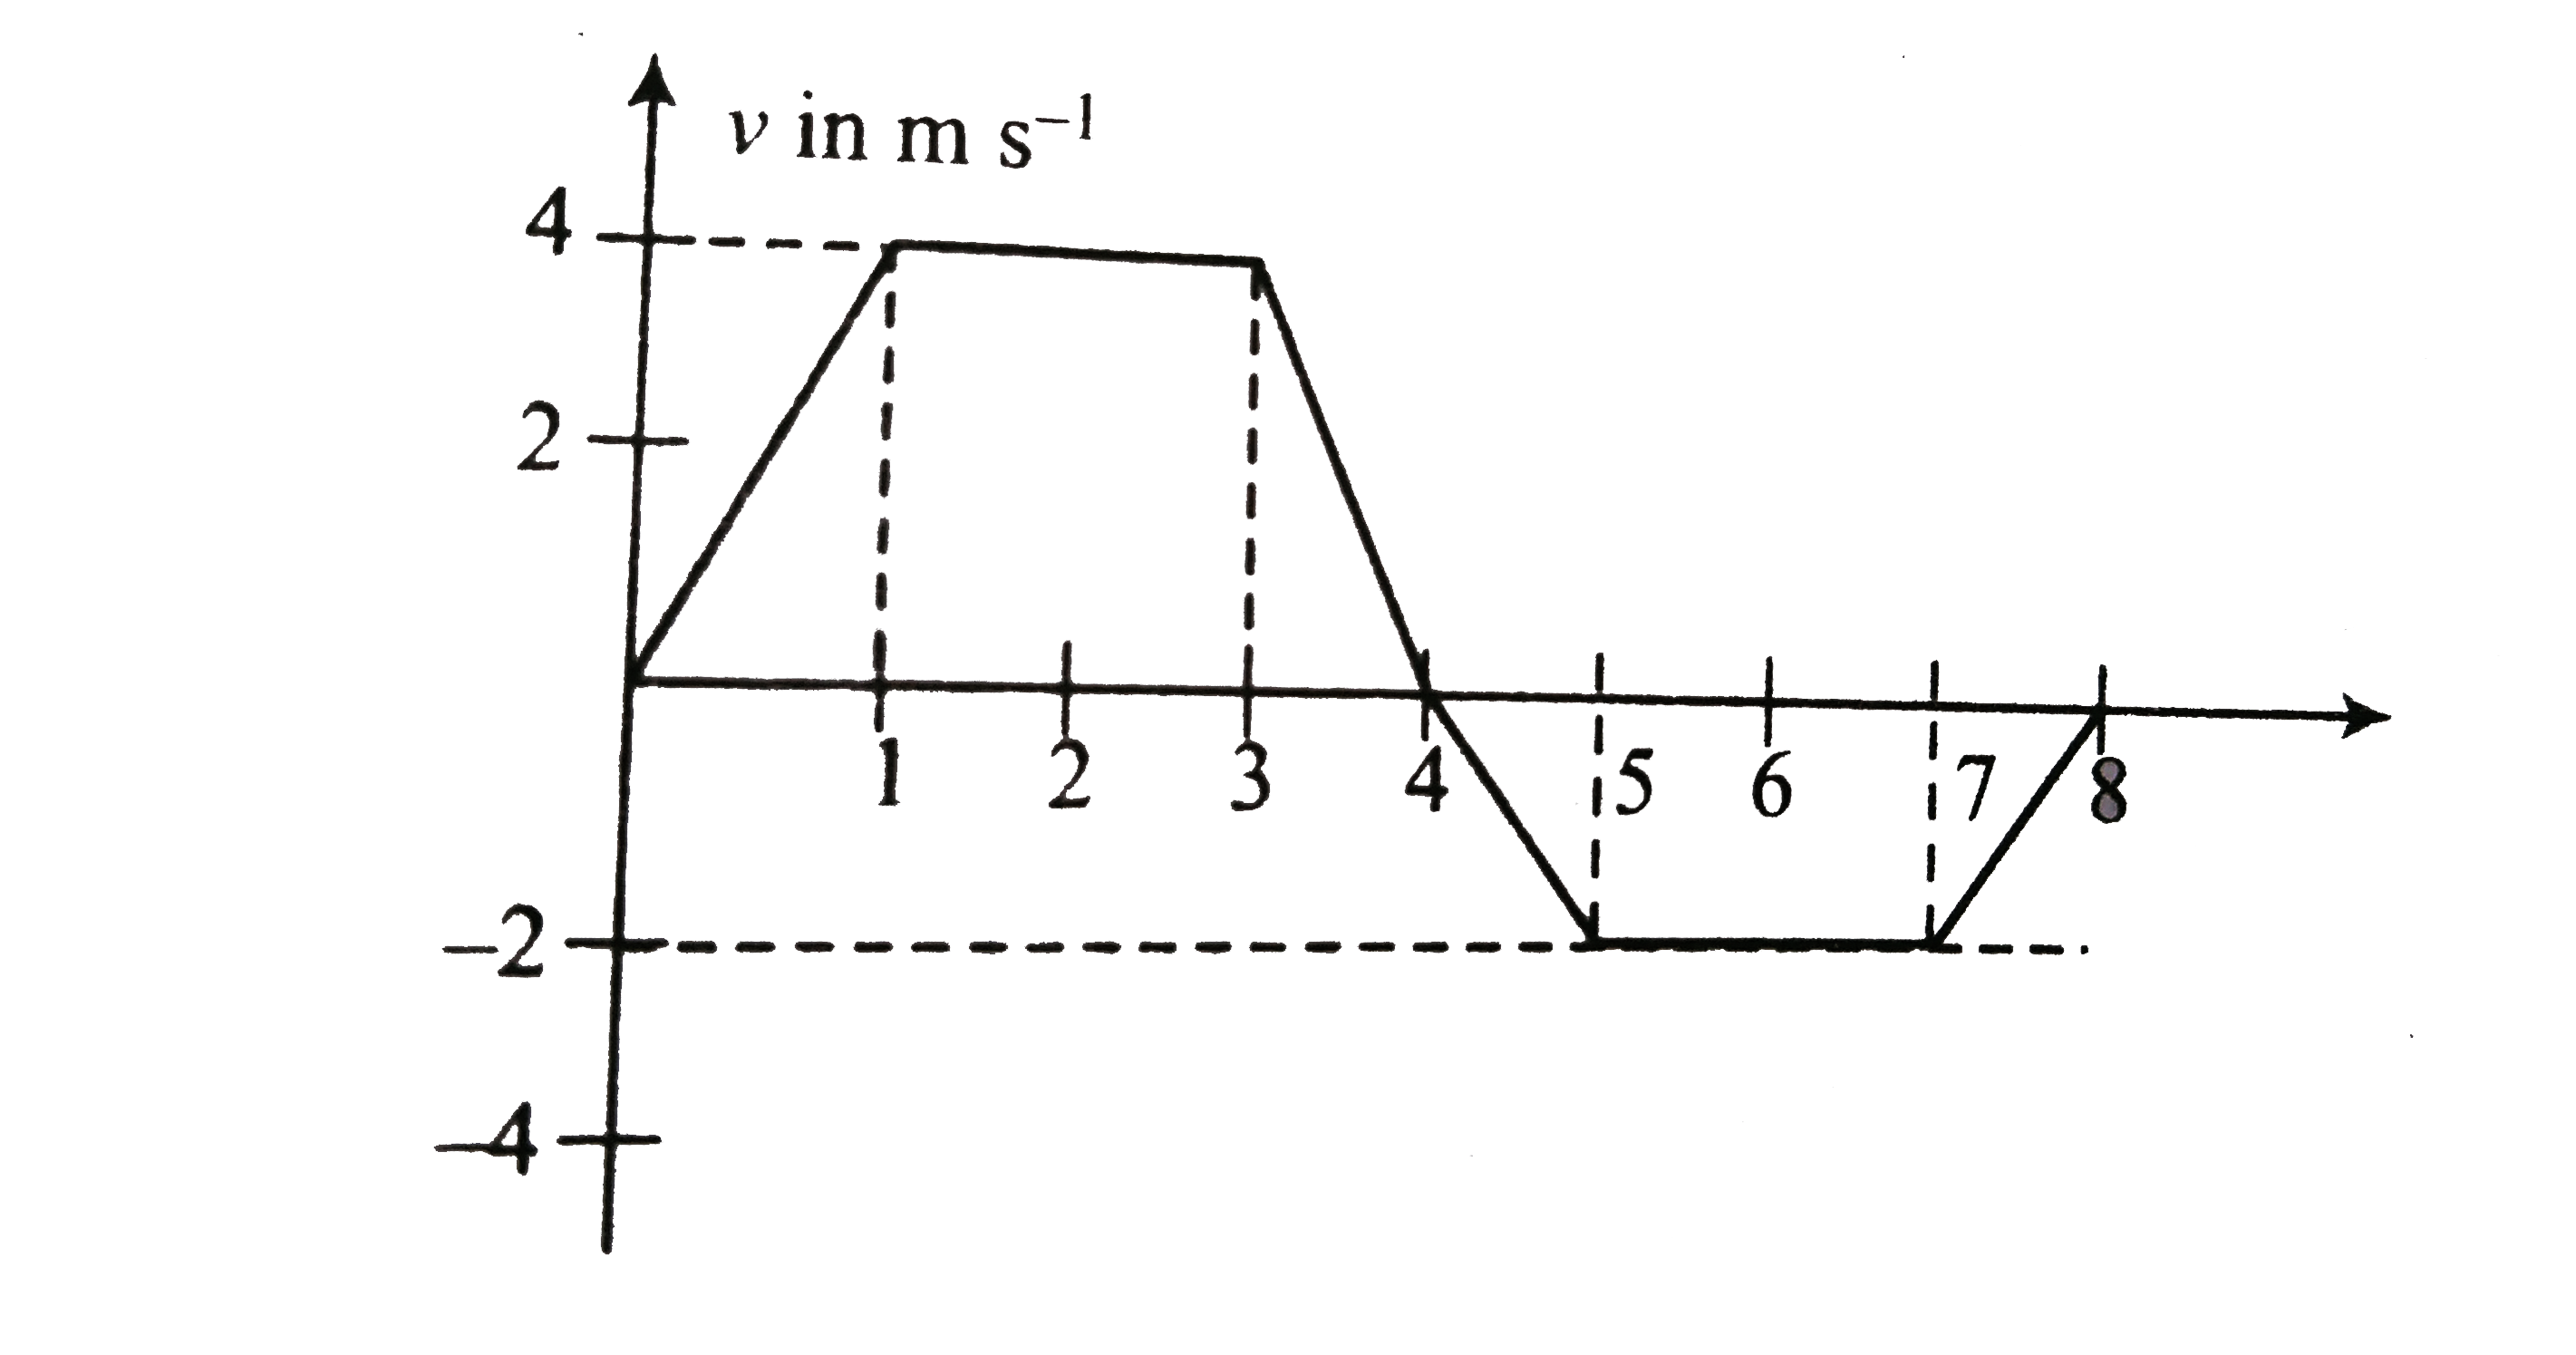
View SolutionThe velocity-time graph of a particle in straight line motion is veloity-time graph of a particle in straight line motion is shown in. The particle starts its motion from origin.
 .
.
Find the average acceleration from 2s to 6s.
View SolutionGraphs are very useful to represent a physical situation. Various quantities can be easily represented on graphs and other quantites can be determined from the graph. For example the slope of velocity-time graph represents instantaneous acceleration. For a motion with constant acceleration slope of velocity-time graph is constant. If acceleration is changing with time, slope with change and thus velocity-time graph will be a non-linear curve. Further the area of velocity-time graph gives displacement.
For the above situation let t1 be the time of accelerated motion and t2 be the time or retarded motion, then the correct relation is
View SolutionGraphs are very useful to represent a physical situation. Various quantities can be easily represented on graphs and other quantites can be determined from the graph. For example the slope of velocity-time graph represents instantaneous acceleration. For a motion with constant acceleration slope of velocity-time graph is constant. If acceleration is changing with time, slope will change and thus velocity-time graph will be a non-linear curve. Further the area of velocity-time graph gives displacement.
For the given velocity-time graph the possibly correct acceleration-time relationship is
View Solution
