Fig 2.26 shows the displacement-time graph for the motion of two boys A and B along a straight road in the same direction. Answer the following:
(i) When did B start after A ?
(ii) How far away was A from B when B started?
(iii) Which of the two has greater velocity ?
(iv) When and where did B overtake A ?
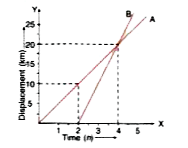
(i) B started his motion 2 h later from the start of A.
(ii) When B started, A was at distance 10 km away from B.
(iii) B has greater velocity than A since the straight line on graph for B has greater slope than that for A.
(iv) B overtook A at the instant when both were at the same place. This position is at the point where the two straight lines meet each other. For this point, distance from the starting point is 20 km and time is 4 h. Thus B overtook A when A has travelled for 4 h (or B has travelled for 4 - 2 = 2 h) at distance 20 km from the starting point
Topper's Solved these Questions
- MOTION IN ONE DIMENSION BOOK - ICSECHAPTER - MOTION IN ONE DIMENSION EXERCISE - EXERCISE -2 (A)
28 Videos
- MOTION IN ONE DIMENSION BOOK - ICSECHAPTER - MOTION IN ONE DIMENSION EXERCISE - EXERCISE -2 (A) ( Multiple choice type: )
5 Videos
- MEASUREMENTS AND EXPERIMENTATION BOOK - ICSECHAPTER - MEASUREMENTS AND EXPERIMENTATION EXERCISE - TOPIC 2 SIMPLE PENDULUM (4 Marks Questions )
1 Video
- PRESSURE IN FLUIDS AND ATMOSPHERIC PRESSUREBOOK - ICSECHAPTER - PRESSURE IN FLUIDS AND ATMOSPHERIC PRESSUREEXERCISE - Exercise -4(B)Numericals
5 Videos
Similar Questions
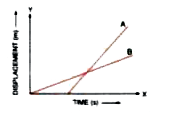
Fig. 2.33 shows displacement-time graph of two vehicles A and B moving along a straight road. Which vehicle is moving faster ? Give reason.
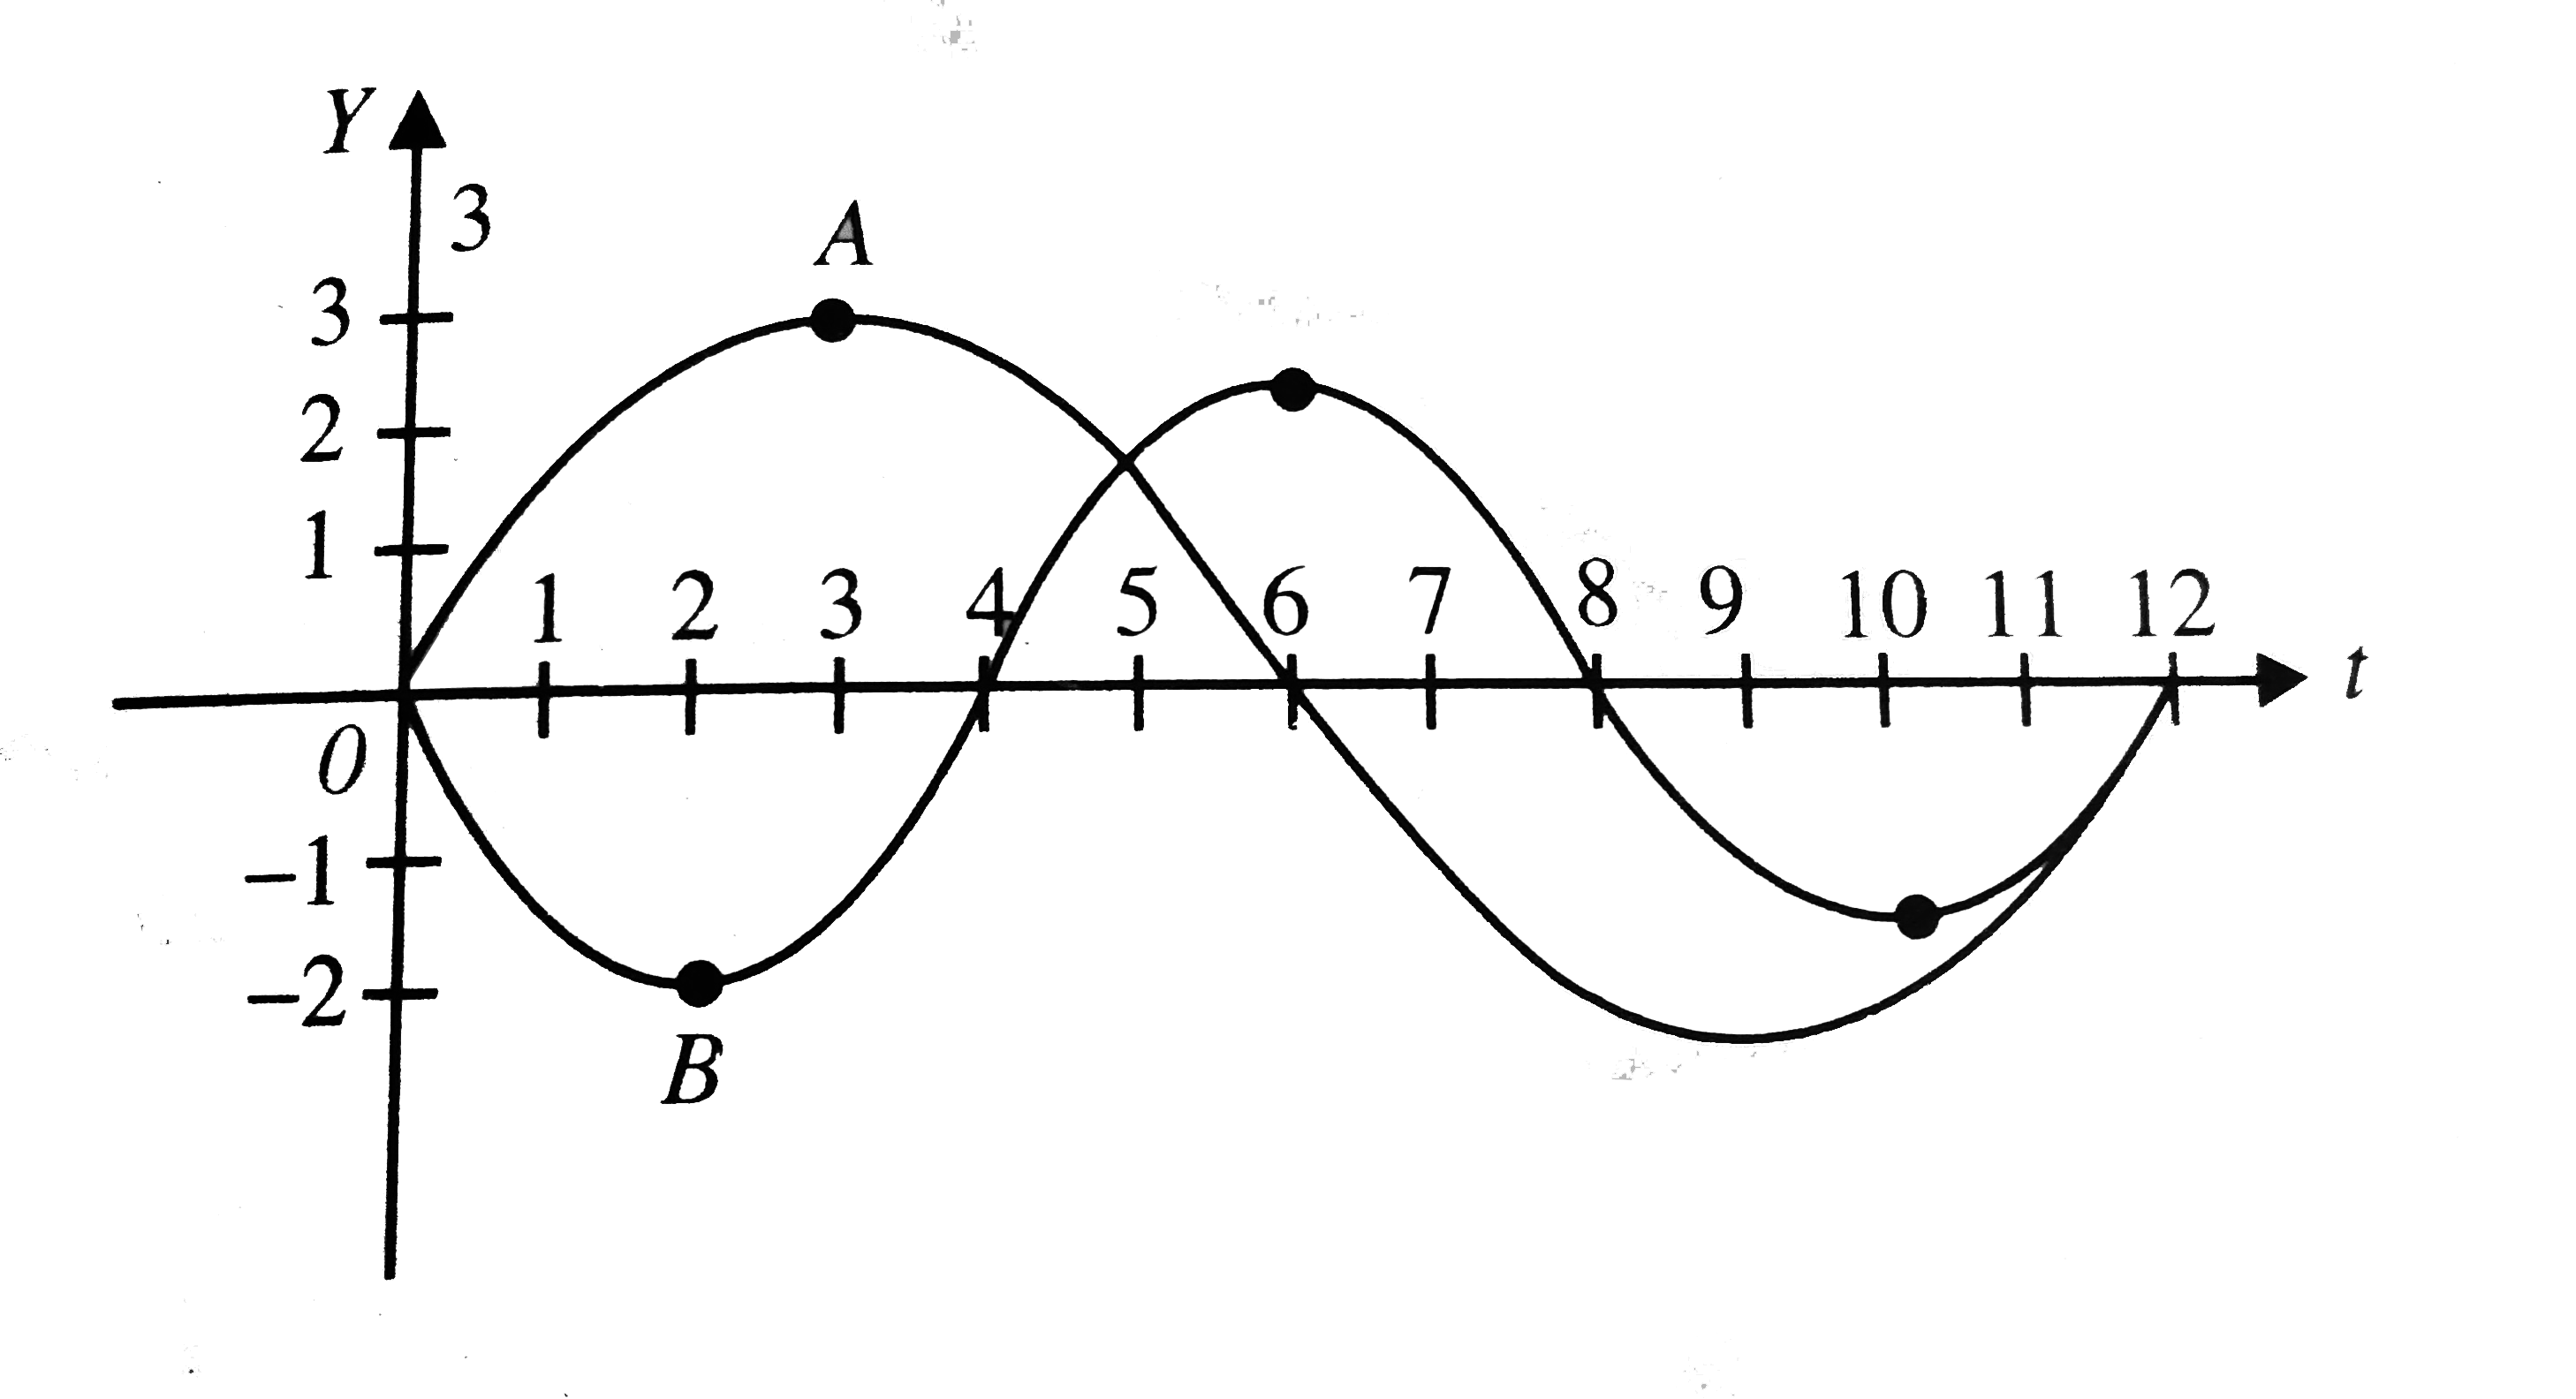
View SolutionThe displacement vs time graph for two waves A and B which travel along the same string arre shown in the figure. Their intensity ratio IA∣IB is
View Solution
Knowledge Check
Which one of the following represents displacement-time graph of two objects A and B moving with zero relative velocity?
A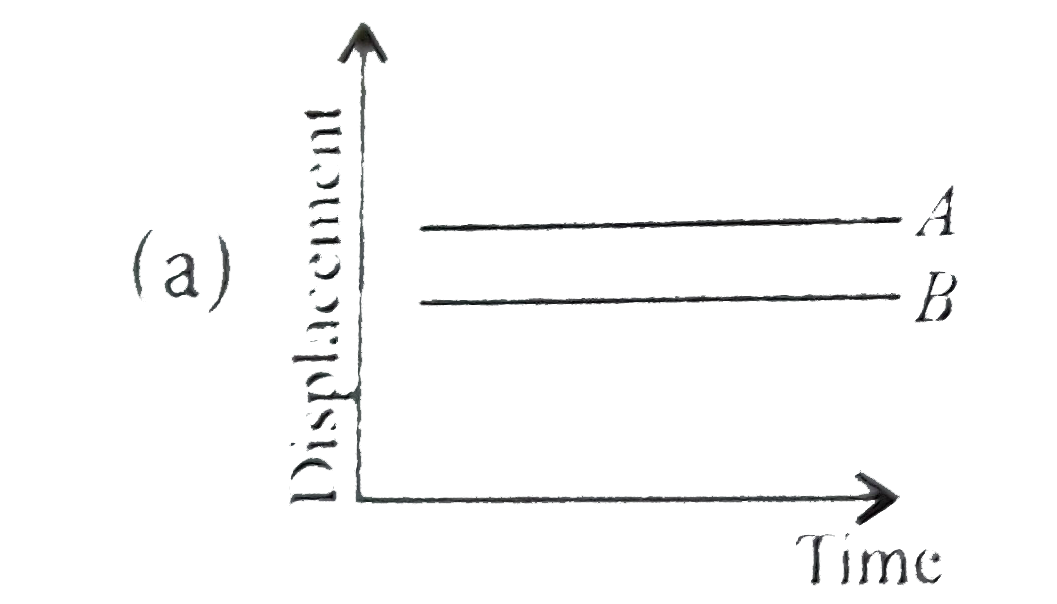 B
B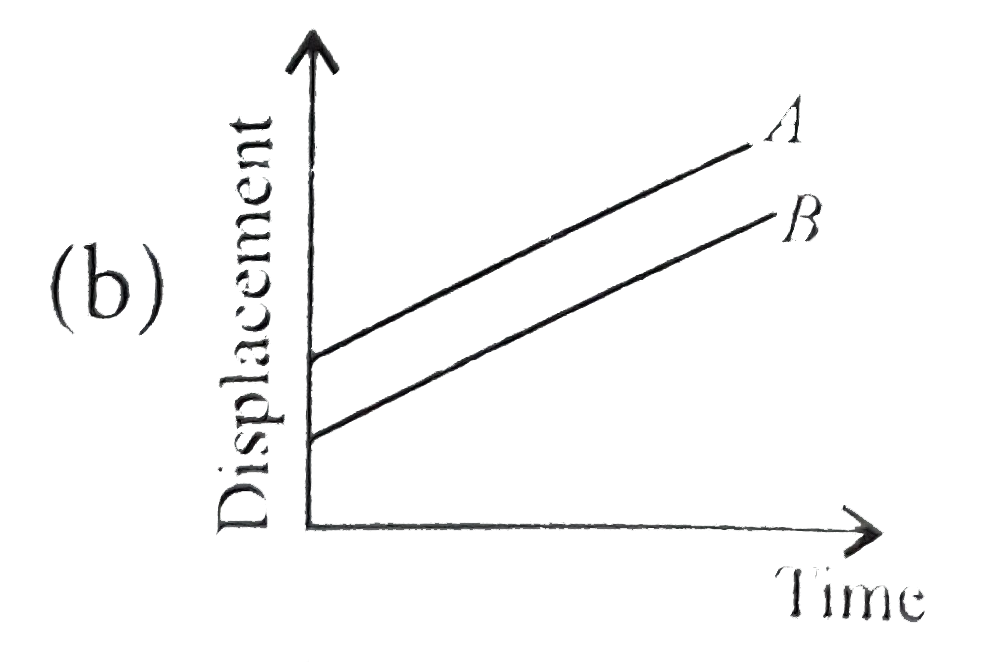 C
C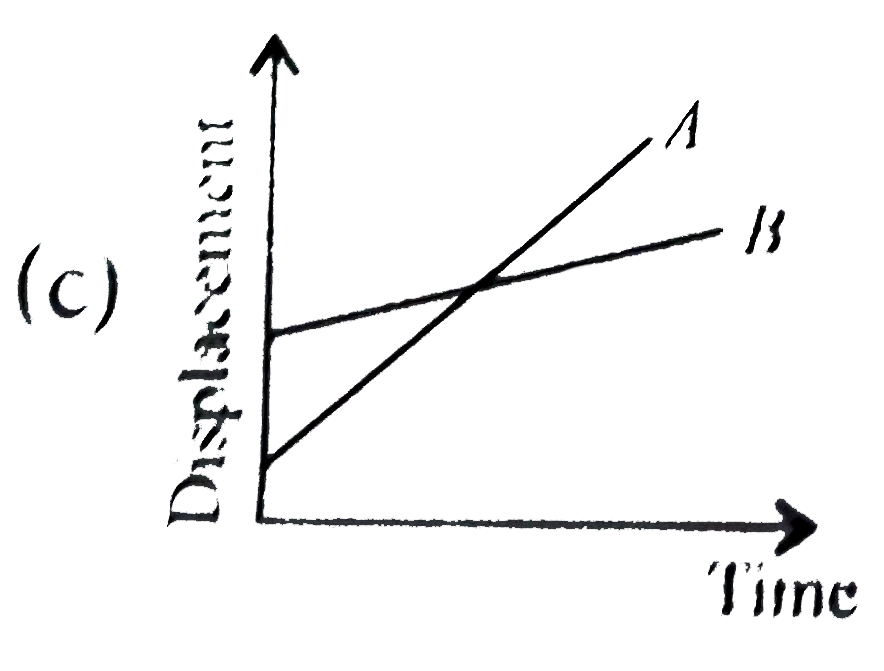 D
D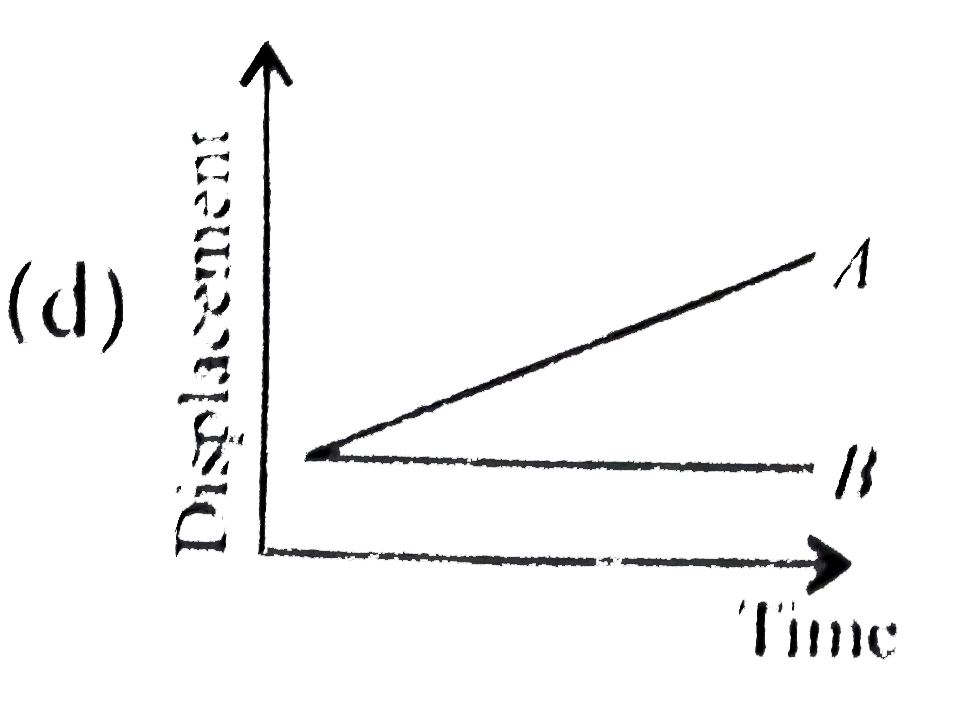
The displacement vs time graph for two waves A and B which travel along the same string arre shown in the figure. Their intensity ratio IA∣IB is

View SolutionFig. 2.37 (a) shows the displacement-time graph for the motion of a body. Use it to calculate the velocity of body at t = 1 s, 2 s and 3 s, then draw the velocitytime graph for it in Fig. (b).
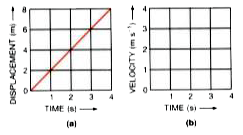
View SolutionThe transversal displacement Vs time graph for two waves A and B which travel along the same string are shown in the figure. Their average intensity ratio IA/IB is
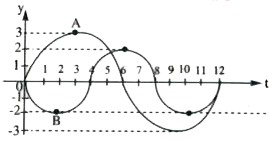
View Solution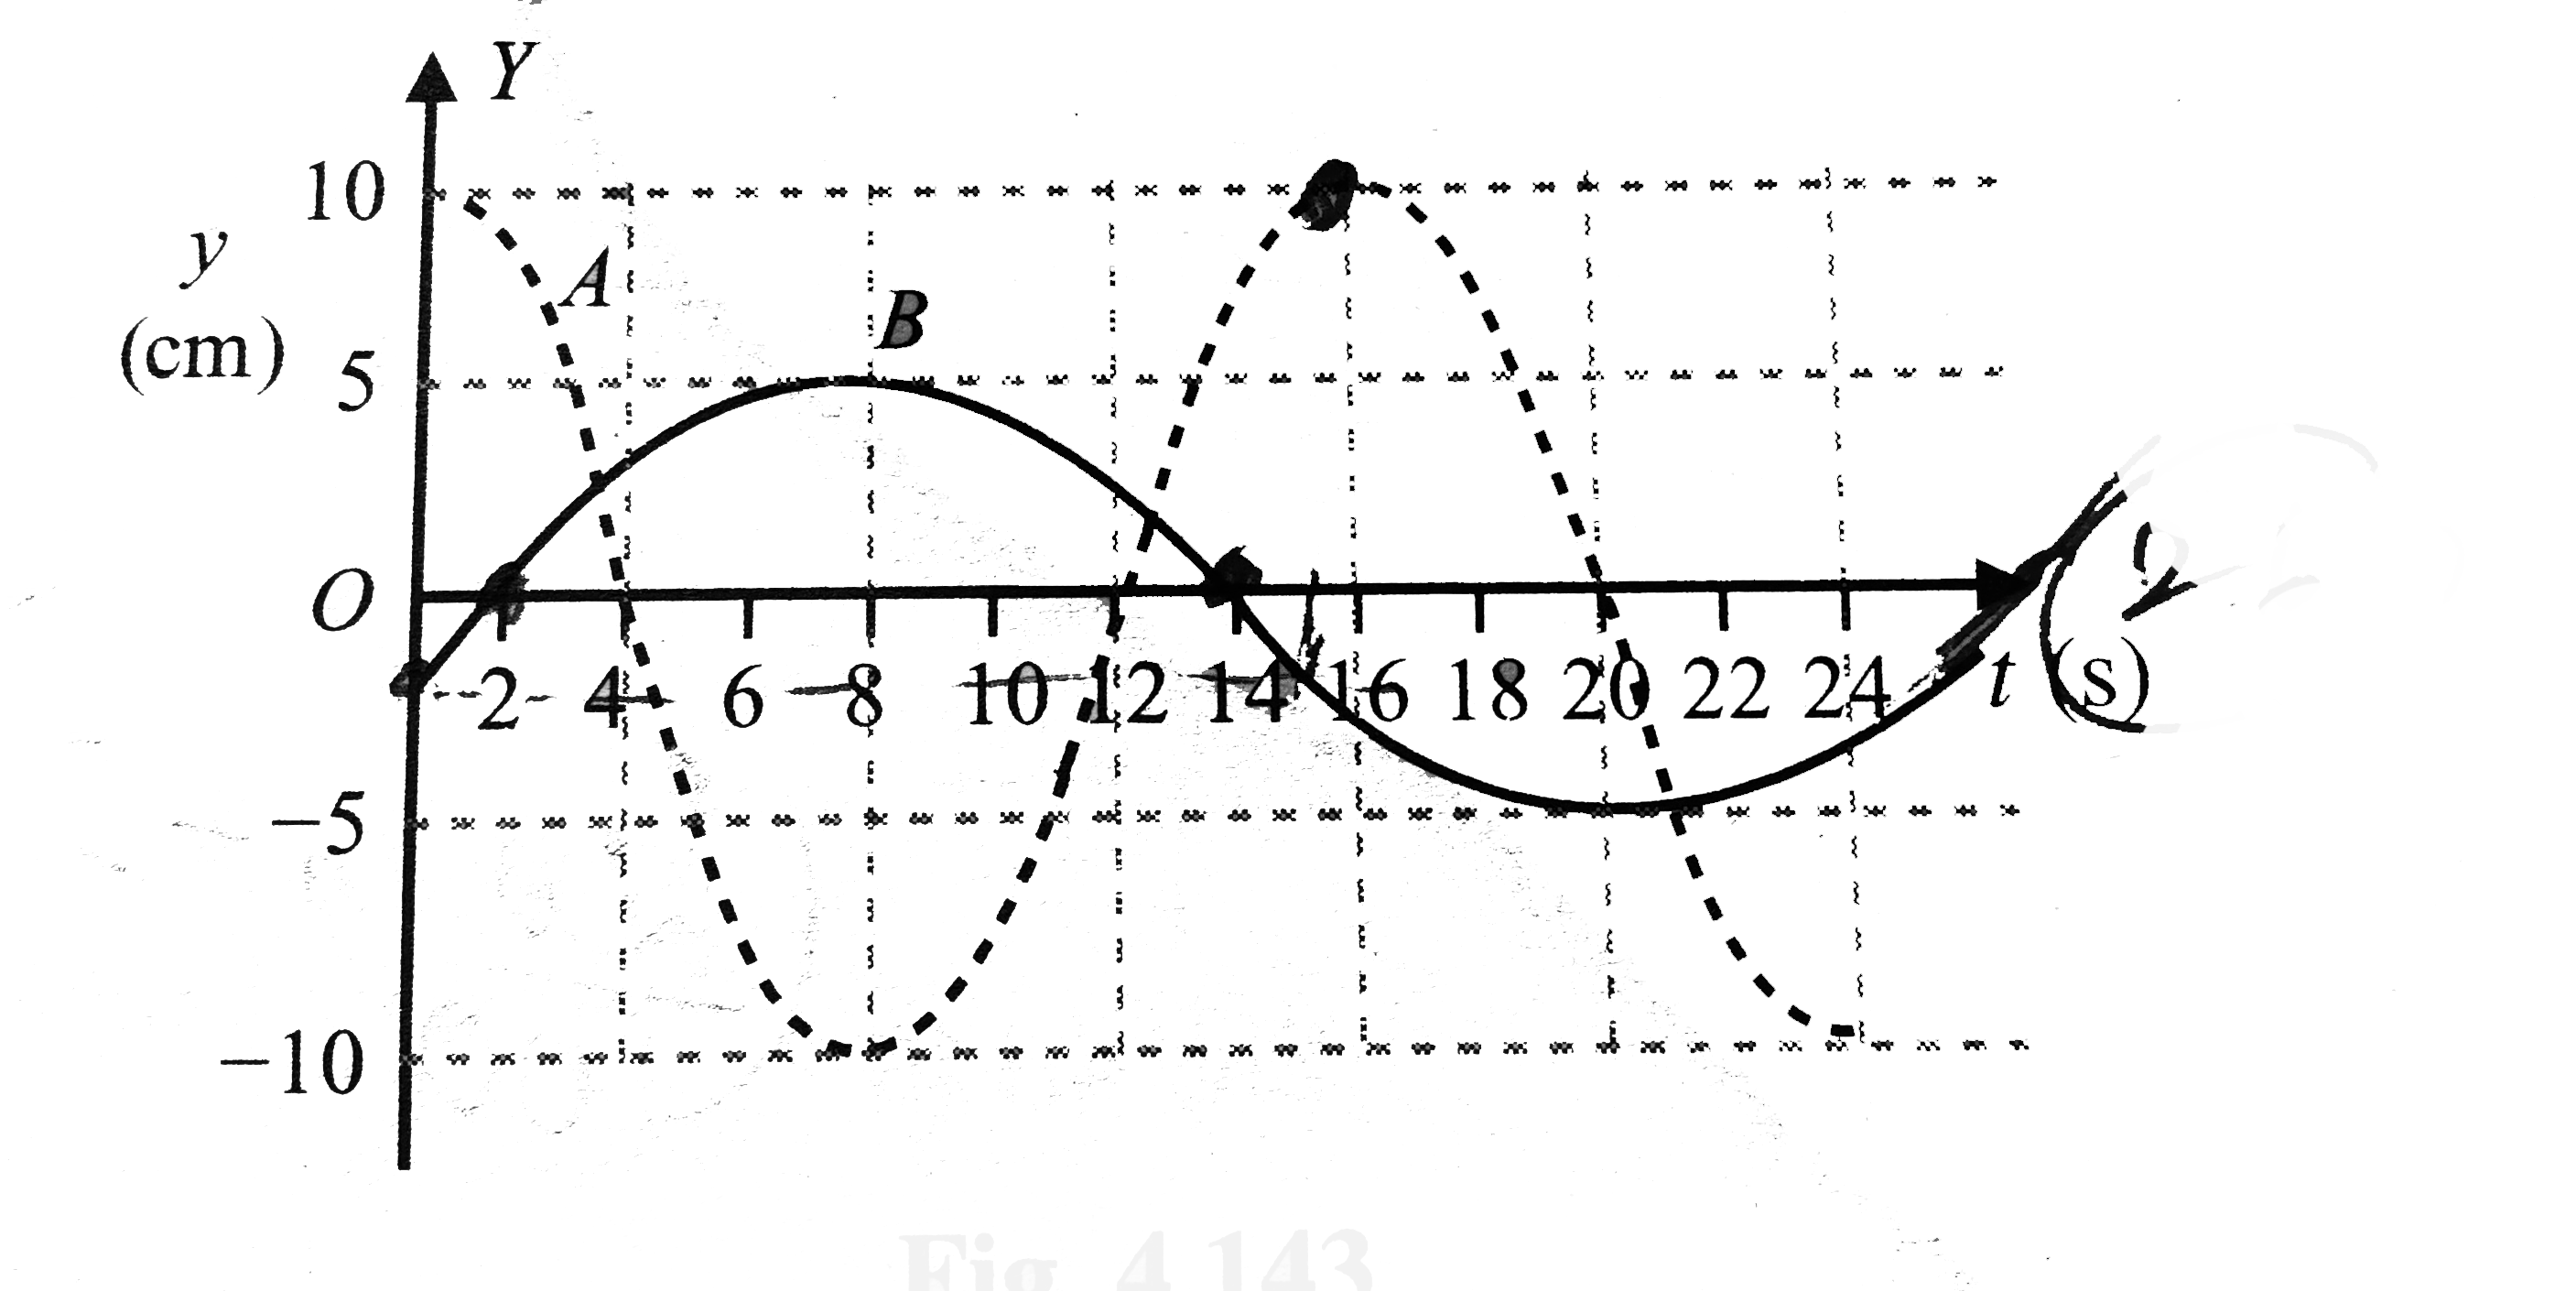
The following figure shows the displacement versus time graph for two particles A and B executing simple harmonic motions. The ratio of their maximum velocities is
View SolutionIn Fig. , A and B represent the displacement distance graphs for two sound waves when they pass through air.
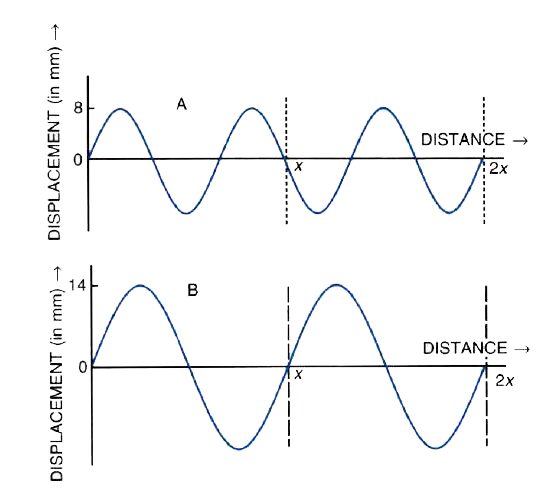
What is the relation between their
velocities
View SolutionIn Fig. , A and B represent the displacement distance graphs for two sound waves when they pass through air.
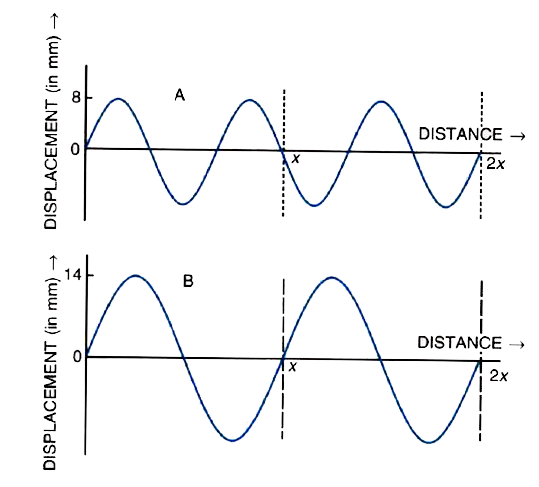
What is the relation between their
loudness
View SolutionIn Fig. , A and B represent the displacement distance graphs for two sound waves when they pass through air.
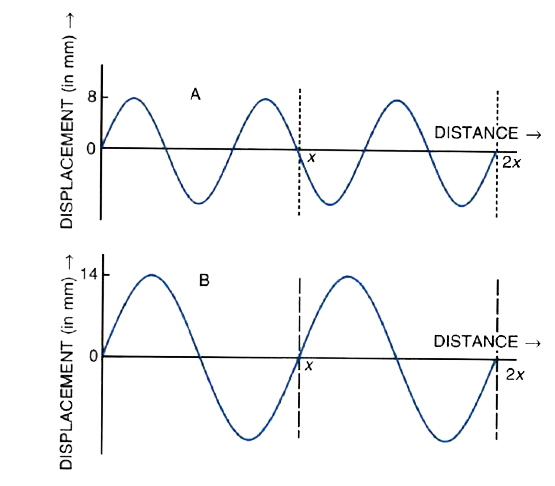
What is the relation between their
pitch
View Solution
