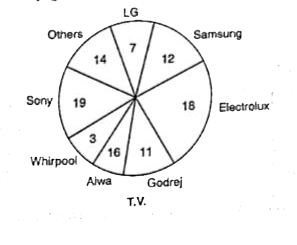
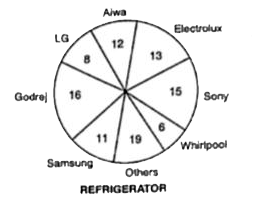
The two pie charts show the market share of different companies which produces TV and Refrigerator (noth) in the first quarter of 2005-06.
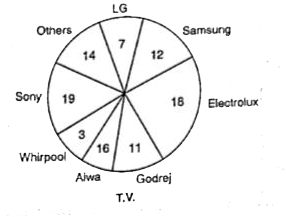
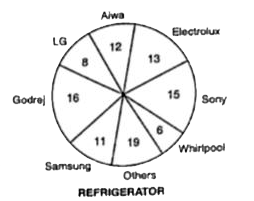
If the turnover in the first quarter of 2005-06 of Electrolux TV and Refrigerator is RS. 42 crores and Rs. 6 crores respectively, then what is the average annual turnover of Godrej and Aiwa in both the product categories together ?
₹ 304 crores
₹ 284 crores
₹ 178 crores
none of the above
The correct Answer is:A
Step by step video, text & image solution for The two pie charts show the market share of different companies which produces TV and Refrigerator (noth) in the first quarter of 2005-06. If the turnover in the first quarter of 2005-06 of Electrolux TV and Refrigerator is RS. 42 crores and Rs. 6 crores respectively, then what is the average annual turnover of Godrej and Aiwa in both the product categories together ? by Maths experts to help you in doubts & scoring excellent marks in Class 14 exams.
Updated on:21/07/2023Topper's Solved these Questions
Similar Questions
Two years ago, Madhu completed her degree in food technology. She worked for some time in a company manufacturing chutneys, pickels and murables. She was not happy in the company and decided to have her own orgainc food processing unit for the same. She set the objectives and the targets and formulated action plan to achieve the same.
One of her objective was to earn 10% profit on the amount invested in the first year. It was decided that raw materials like fruits, vegtables, spices etc. will be purchased on three months credit from framers cultivating organic crops only. She also decided to follow the steps required for marketing of the products through her own outlets. She appointed Mohan as Production Manager who decides the exact manner in which the production activites are to be carried out. Mohan also prepared a statement showing the number of workers that will be required in the factory throughout the year. Madhu informed Mohan about her sales target for different products, areawise for the forthcoming quarter. While Working on the production table a penalty of 100rs per day for not wearing the cap, gloves and apron was announced.
Quoting lines from the above para ideantify and explain the different types of plans discussed.
View SolutionRead the news report below and identify the following aspects :
• What is the case about ?
• Who has been the beneficiary in the case ?
• Who is the petitioner in the case ?
• Visualise what would have been the different arguments put forward by the company
• What arguments would the farmers have put forward ?
Supreme Court order REL to pay Rs. 300 crore to Dahanu farmers
Our Corporate Bureau 24 March 2005
Mumbai : The Supreme Court has ordered Reliance Energy to pay Rs. 300 crores to farmers who grow the chikoo fruit in the Dahanu area outside Mumbai. The order comes after the chikoo growers petitioned the court against the pollution caused by Reliance's thermal power plant.
Dahanu, which is 150 km from Mumbai, was a self - sustaining agricultural and horticultural economy agricultural and horticultural economy known for its fisheries and forests just over a decade ago, but was devastated in 1989 when a thermal power plant came into operation in the region. The nest year, this fertile belt saw its first crop failure. Now, 70 per cent of the crop of what wasonce the fruit bowl of Maharashtra is gone. The fisheries have shut and the forest cover has thinned. Farmers and environmentalists say that fly ash from the power plant entered ground water and polluted the entire eco - system. The Dahanu Taluka Environmenmnt Protecttion Authority ordered the thermal station to set up a pollution control unit to reduce sulphur emissions, and in spite of a Supreme Court order backing the order the pollution contrl plant was not set up even by 2002. In 2003, Reliance acquired the thermal station and re-submitted a schedule for for installation process in 2004. As the pollution control plant is still not set up, the Dahanu Taluka Environmental Protection Authority asked Reliance for a bank guarantee of Rs. 300 crores.
View Solution
Knowledge Check
The two pie charts show the market share of different companies which produces TV and Refrigerator (noth) in the first quarter of 2005-06.


If the turnover in the first quarter of 2005-06 of Electrolux TV and Refrigerator is RS. 42 crores and Rs. 6 crores respectively, then what is the average annual turnover of Godrej and Aiwa in both the product categories together ?A₹ 304 croresB₹ 284 croresC₹ 178 croresDnone of the aboveThe two pie charts show the market share of different companies which produces TV and Refrigerator (noth) in the first quarter of 2005-06.
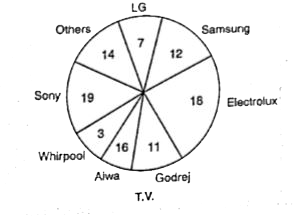
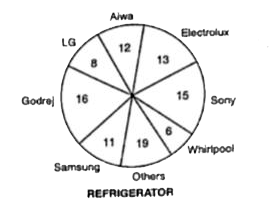
The difference is not shown to scale.A7.2∘B14.4∘C21.6∘Dnone of theseThe two pie charts show the market share of different companies which produces TV and Refrigerator (noth) in the first quarter of 2005-06.
Which of the following cann't be deduced from the given data :AThe angular difference between Samsung TV and Electrolux refrigerator is 3.6∘.BSony is the market leader in the TV and Refrigerator segment combined.CFor every Rs. 100 turnover of Whirlpool Refrigerator, the difference in the turnover of Electrolux and Samsung Refrigerator is Rs. 33.34 croreDnone of the above
GAIL India, which has had a monopoly in The gas transmission sector is set to see some tough competition in the coming days. While Reliance is poised to get into the trunk pipeline segment, British Gas is trying to get into the city gas distribution sector. GAIL's new chairman, shares his thoughts on how he plans to take the company ahead. What are GAIL's main priorities? Going by its business strategy, the focus areas are gas sourcing, transmission, marketing, processing, petrochemicals, globalisation and city gas distribution. We are focussing on sourcing of gas from indigenous finds and through LNG and cross border pipelines. We intend to develop the gas market by extending our gas grid from 5,600 km to 10,000 km. The city gas project is expected to rise from 6 to 45 by the end of the 11th five year Plan. What are GAIL's plans for acquiring an Exploration and Production (E&P) company abroad? GAIL has plans to strengthen its exploration and production activities. To become a formidable company, GAIL is exploring options - acquiring an E&P company is one such option. What are your Capex plans and how do you plan to fund it? GAIL's budgeted Capex plan for FY 06-07 is 2967.28 crore. This includes capital expenditure of 2579.58 crore on pipeline and other projects and 387.7 crore on petrochemical projects. This will be funded through internal reserves. What are your plans on city gas distribution? Will GAIL continue with its plans on fuel management? We have already established the business successfully in Mumbai, Delhi, Vadodara, Vijayawada, Agra, Lucknow, Kanpur. Till date GAIL has formed eight joint venture companies to implement city gas projects. The projects have had an impact on the pollution levels. GAIL is in the process of forming state-wise Joint Ventures with oil marketing companies to implement city gas projects in Rajasthan. What are GAIL's plans to diversify into telecom and what is the current status? Gailtel, the telecom service arm of GAIL, offers telecom services commercially to lead telecom operators across India. Gailtel owns and operates approximately 13,000 route km of fibre optic network, GAIL is evaluating various options to work out its future growth plans
State two features of planning reflected in the above case
View SolutionSpeed Post Leads the Race in Express Mail
Speed Post has emerged as a market leader in the express mall category with a 27.55% volume share, a study commissioned by the Department of Post (DoP) and government of India shows. According to the study, almost 46.67% crore articles were sent by express mail in 05−06. The study values the express mail industry alone (excluding logistics and cargo which account for almost 35−40% of private firm's turnover) at around 1500rs crore. In volue terms, while Speed Post is the leader, Blue Dart is a close second with a 20% market share, followed by DTDC with a 11.91% share and First Flight with a 10.89% share. "This has been possible because of our competitive pricing. We are offering the same services as other private couriers do, with the same efficiency but at half the rates", added Mr. Samuel. In fact, Speed Post claims that its volumes have increased by almost 30−40% after the introduction of the One India One Rate scheme. Express companies are hope ful that the market is going to groq further with the setting up of SEZs and greater economic activity in the country fuelled by the increasing through out from the manufacturing sector.
Mention the type of product provided by Speed Post.
View SolutionSpeed Post Leads the Race in Express Mail
Speed Post has emerged as a market leader in the express mall category with a 27.55% volume share, a study commissioned by the Department of Post (DoP) and government of India shows. According to the study, almost 46.67% crore articles were sent by express mail in 05−06. The study values the express mail industry alone (excluding logistics and cargo which account for almost 35−40% of private firm's turnover) at around 1500rs crore. In volue terms, while Speed Post is the leader, Blue Dart is a close second with a 20% market share, followed by DTDC with a 11.91% share and First Flight with a 10.89% share. "This has been possible because of our competitive pricing. We are offering the same services as other private couriers do, with the same efficiency but at half the rates", added Mr. Samuel. In fact, Speed Post claims that its volumes have increased by almost 30−40% after the introduction of the One India One Rate scheme. Express companies are hope ful that the market is going to groq further with the setting up of SEZs and greater economic activity in the country fuelled by the increasing through out from the manufacturing sector.
What are its main features ?
View SolutionThe two pie charts show the market share of different companies which produces TV and Refrigerator (noth) in the first quarter of 2005-06.
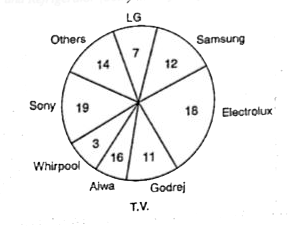
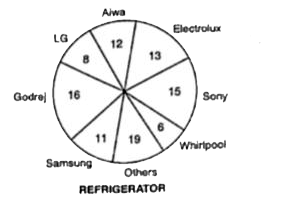
If the turn over of Samsung TV is Rs. 31 crores and of Samsung refrigerator is Rs. 9 crore, then what is the overall market share of electrolux TV and refrigerator combined ?
View SolutionThe two pie charts show the market share of different companies which produces TV and Refrigerator (noth) in the first quarter of 2005-06.


If the turn over of Samsung TV is Rs. 31 crores and of Samsung refrigerator is Rs. 9 crore, then what is the overall market share of electrolux TV and refrigerator combined ?
View Solution
