Answer the question based on the following information. The following table gives the traiff (in paise per kilo-litre) levied by the Lucknow jal Nigam in 2003-04 in four sector and the region within them. (Each sector is divided in 5 regions). The table gives the percentage change in the tariff as compared to 2000-01.

What was the approximate average tariff in region 2 in 2000-01 ?
450
675
575
525
The correct Answer is:C
Step by step video, text & image solution for Answer the question based on the following information. The following table gives the traiff (in paise per kilo-litre) levied by the Lucknow jal Nigam in 2003-04 in four sector and the region within them. (Each sector is divided in 5 regions). The table gives the percentage change in the tariff as compared to 2000-01. What was the approximate average tariff in region 2 in 2000-01 ? by Maths experts to help you in doubts & scoring excellent marks in Class 14 exams.
Updated on:21/07/2023Topper's Solved these Questions
Similar Questions
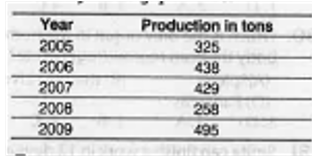
The below table gives rice production in each year. Read and answer the following questions.

What is the increased percentage of production in 2009 compared to year 2005?
38.1 %
29.2%
52.3%
46.3%
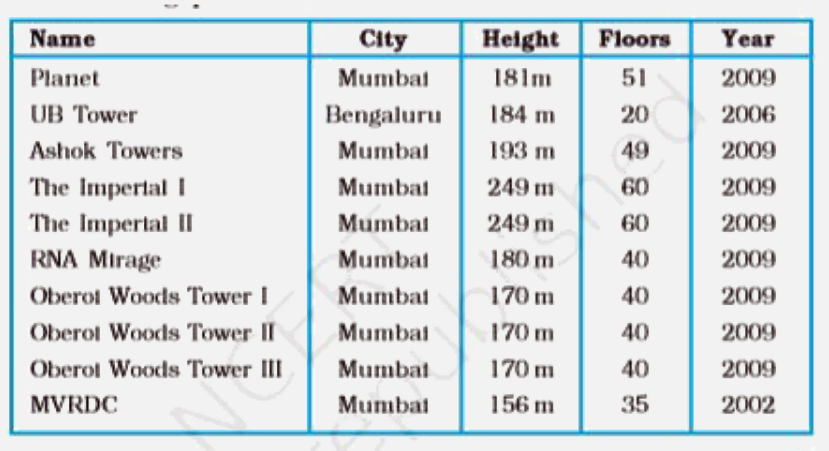
View SolutionBelow is a list of 10 tallest buildings in India.
This list ranks buildings in India that stand at least 150m (492 ft.) tall, based on standard height measurement. This includes spires and architectural details but does not include antenna marks. Following data is given as per the available information till 2009. Since new buildings are always under construction, go on-line to check new taller buildings.
Use the information given in the table about sky scrapers to answer the following questions:

(a) Find the height of each storey of the three tallest buildings and write them in the following table:

(b) The average height of one storey for the buildings given in (a) is
(c) Which city in this list has the largest percentage of skyscrappers? What is the percentage?
(d) What is the range of data?
(e) Find the median of the data.
(f) Draw a bar graph for given data.
View Solution
Knowledge Check
Answer the question based on the following information. The following table gives the traiff (in paise per kilo-litre) levied by the Lucknow jal Nigam in 2003-04 in four sector and the region within them. (Each sector is divided in 5 regions). The table gives the percentage change in the tariff as compared to 2000-01.

If the amount of water consumed by the various regions in sector 1 is the same, then as compared to 2000-01 the net tariff in 2003-04 :Aincreased by 20%Bincreased by 13%Cdecreased by 12%Ddecreased by 20%Answer the question based on the following information. The following table gives the traiff (in paise per kilo-litre) levied by the Lucknow jal Nigam in 2003-04 in four sector and the region within them. (Each sector is divided in 5 regions). The table gives the percentage change in the tariff as compared to 2000-01.

The Lucknow Jal Nigam supplies the water under four categories : urban (25%) rural (15%) domestic (40%) industrial (20%). In 2003-04, the total water supplied by the Lucknow Jal Nigam was 20,000 kilo-litres.
In the given two years, what is the total tariff paid by the Urban sector ?ARs. 16,000BRs. 48,000CRS. 23,000Dcan't be determinedAnswer the question based on the following information. The following table gives the traiff (in paise per kilo-litre) levied by the Lucknow jal Nigam in 2003-04 in four sector and the region within them. (Each sector is divided in 5 regions). The table gives the percentage change in the tariff as compared to 2000-01.

What was the approximate average tariff in region 2 in 2000-01 ?AThe average tariff in region 2 is 625BThe average tariff in region 4 is greater than the average tariff in region 5CIn 2000-01 the industrial sector contributed about 30% of the total revenue from water supplyDnone of the above
Directions: study the following information and answer the question that follow:
There is an eight-member committee heading a housing society. There are four sectors — I, II, III and IV. Two members represent each sector. The members are — M, N, O, P, R, S, T and U. The names of the members are not necessarily in the same order as the names of the sector. The members are from different professions. Those professions are — Nurse, Doctor, Author, Teacher, Editor, Housewife, Engineer and Professor. During a conference the members sat around a table facing towards centre of the table. Now study some additional clues before answering the question.
(i) No two representatives of the same sector are sitting adjacent to each other except those of sector II, Representatives of sector I are sitting opposite each other.
(ii) The Teacher is sitting on the immediate left of the Professor. R is neither the Professor nor the Author.
(iii) U, the Housewife, represents sector III. She is sitting on the immediate left of N, who represents sector II. Mrs N is not the Author.
(iv) Editor S is neither from sector I nor from III or IV. He is sitting opposite T. Only Doctor M is sitting between Teacher T and the Engineer.
Both the representatives of sector IV are sitting
Who is the Nurse?
1) N
2) P
3) O
4) Data inadequate
5) None of these
View SolutionDirections: study the following information and answer the question that follow:
There is an eight-member committee heading a housing society. There are four sectors — I, II, III and IV. Two members represent each sector. The members are — M, N, O, P, R, S, T and U. The names of the members are not necessarily in the same order as the names of the sector. The members are from different professions. Those professions are — Nurse, Doctor, Author, Teacher, Editor, Housewife, Engineer and Professor. During a conference the members sat around a table facing towards centre of the table. Now study some additional clues before answering the question.
(i) No two representatives of the same sector are sitting adjacent to each other except those of sector II, Representatives of sector I are sitting opposite each other.
(ii) The Teacher is sitting on the immediate left of the Professor. R is neither the Professor nor the Author.
(iii) U, the Housewife, represents sector III. She is sitting on the immediate left of N, who represents sector II. Mrs N is not the Author.
(iv) Editor S is neither from sector I nor from III nor IV. He is sitting opposite T. Only Doctor M is sitting between Teacher T and the Engineer.
Both the representatives of sector IV are sitting
Who among the- following represent sector I?
1) O and P
2) R and U
3) M and S
4) Data inadequate
5) None of these
View SolutionAnswer the question based on the following information. The following table gives the traiff (in paise per kilo-litre) levied by the Lucknow jal Nigam in 2003-04 in four sector and the region within them. (Each sector is divided in 5 regions). The table gives the percentage change in the tariff as compared to 2000-01.

What was the approximate average tariff in region 2 in 2000-01 ?
View SolutionAnswer the question based on the following information. The following table gives the traiff (in paise per kilo-litre) levied by the Lucknow jal Nigam in 2003-04 in four sector and the region within them. (Each sector is divided in 5 regions). The table gives the percentage change in the tariff as compared to 2000-01.

If the amount of water consumed by the various regions in sector 1 is the same, then as compared to 2000-01 the net tariff in 2003-04 :
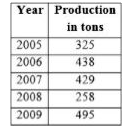
View SolutionThe below table gives rice production in each year. Read and answer the following questions

What is the increased percentage of production in 2009 compared to year 2005 ?
A 38.1% B 29.2% C 52.3% D 46.3%
View Solution
