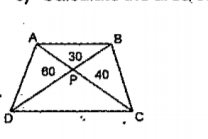
In the figure the diagonals AC and BD intersect at P. The area of PAB is 30cm2 , area of PDA is 60cm2 and area of PBC is 40cm2.
What is the area of PDC
 Solution in Malayalam
Step by step video & image solution for In the figure the diagonals AC and BD intersect at P. The area of PAB is 30 cm^2 , area of PDA is 60 cm^2 and area of PBC is 40 cm^2. What is the area of PDC by Maths experts to help you in doubts & scoring excellent marks in Class 9 exams.
Topper's Solved these Questions
Similar Questions
Sum of two numbers is 25. The difference is 10. Find the numbers.
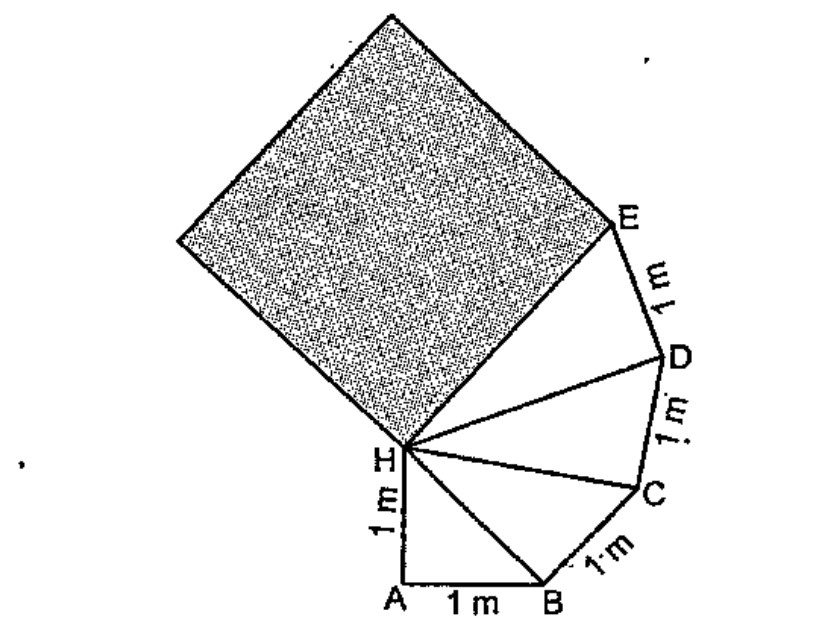
02:11View SolutionIn the picture, the square on the hypotenuse of the top most right triangle Is drawn. Calculate the area and the length of a side of the square.
 .03:53View Solution
Determine the point of symmetry of a regular hexagon.
02:45View SolutionFind the area of the shaded region, given that the radius of each circle is equal to 5 cm.
02:17View SolutionMatch the following Column A to Column B
 05:41View Solution
Match the following Column A to Column B
 03:28View Solution
Match the following Column A to Column B
 04:08View Solution
Find the area of figure given below.
 02:21View Solution
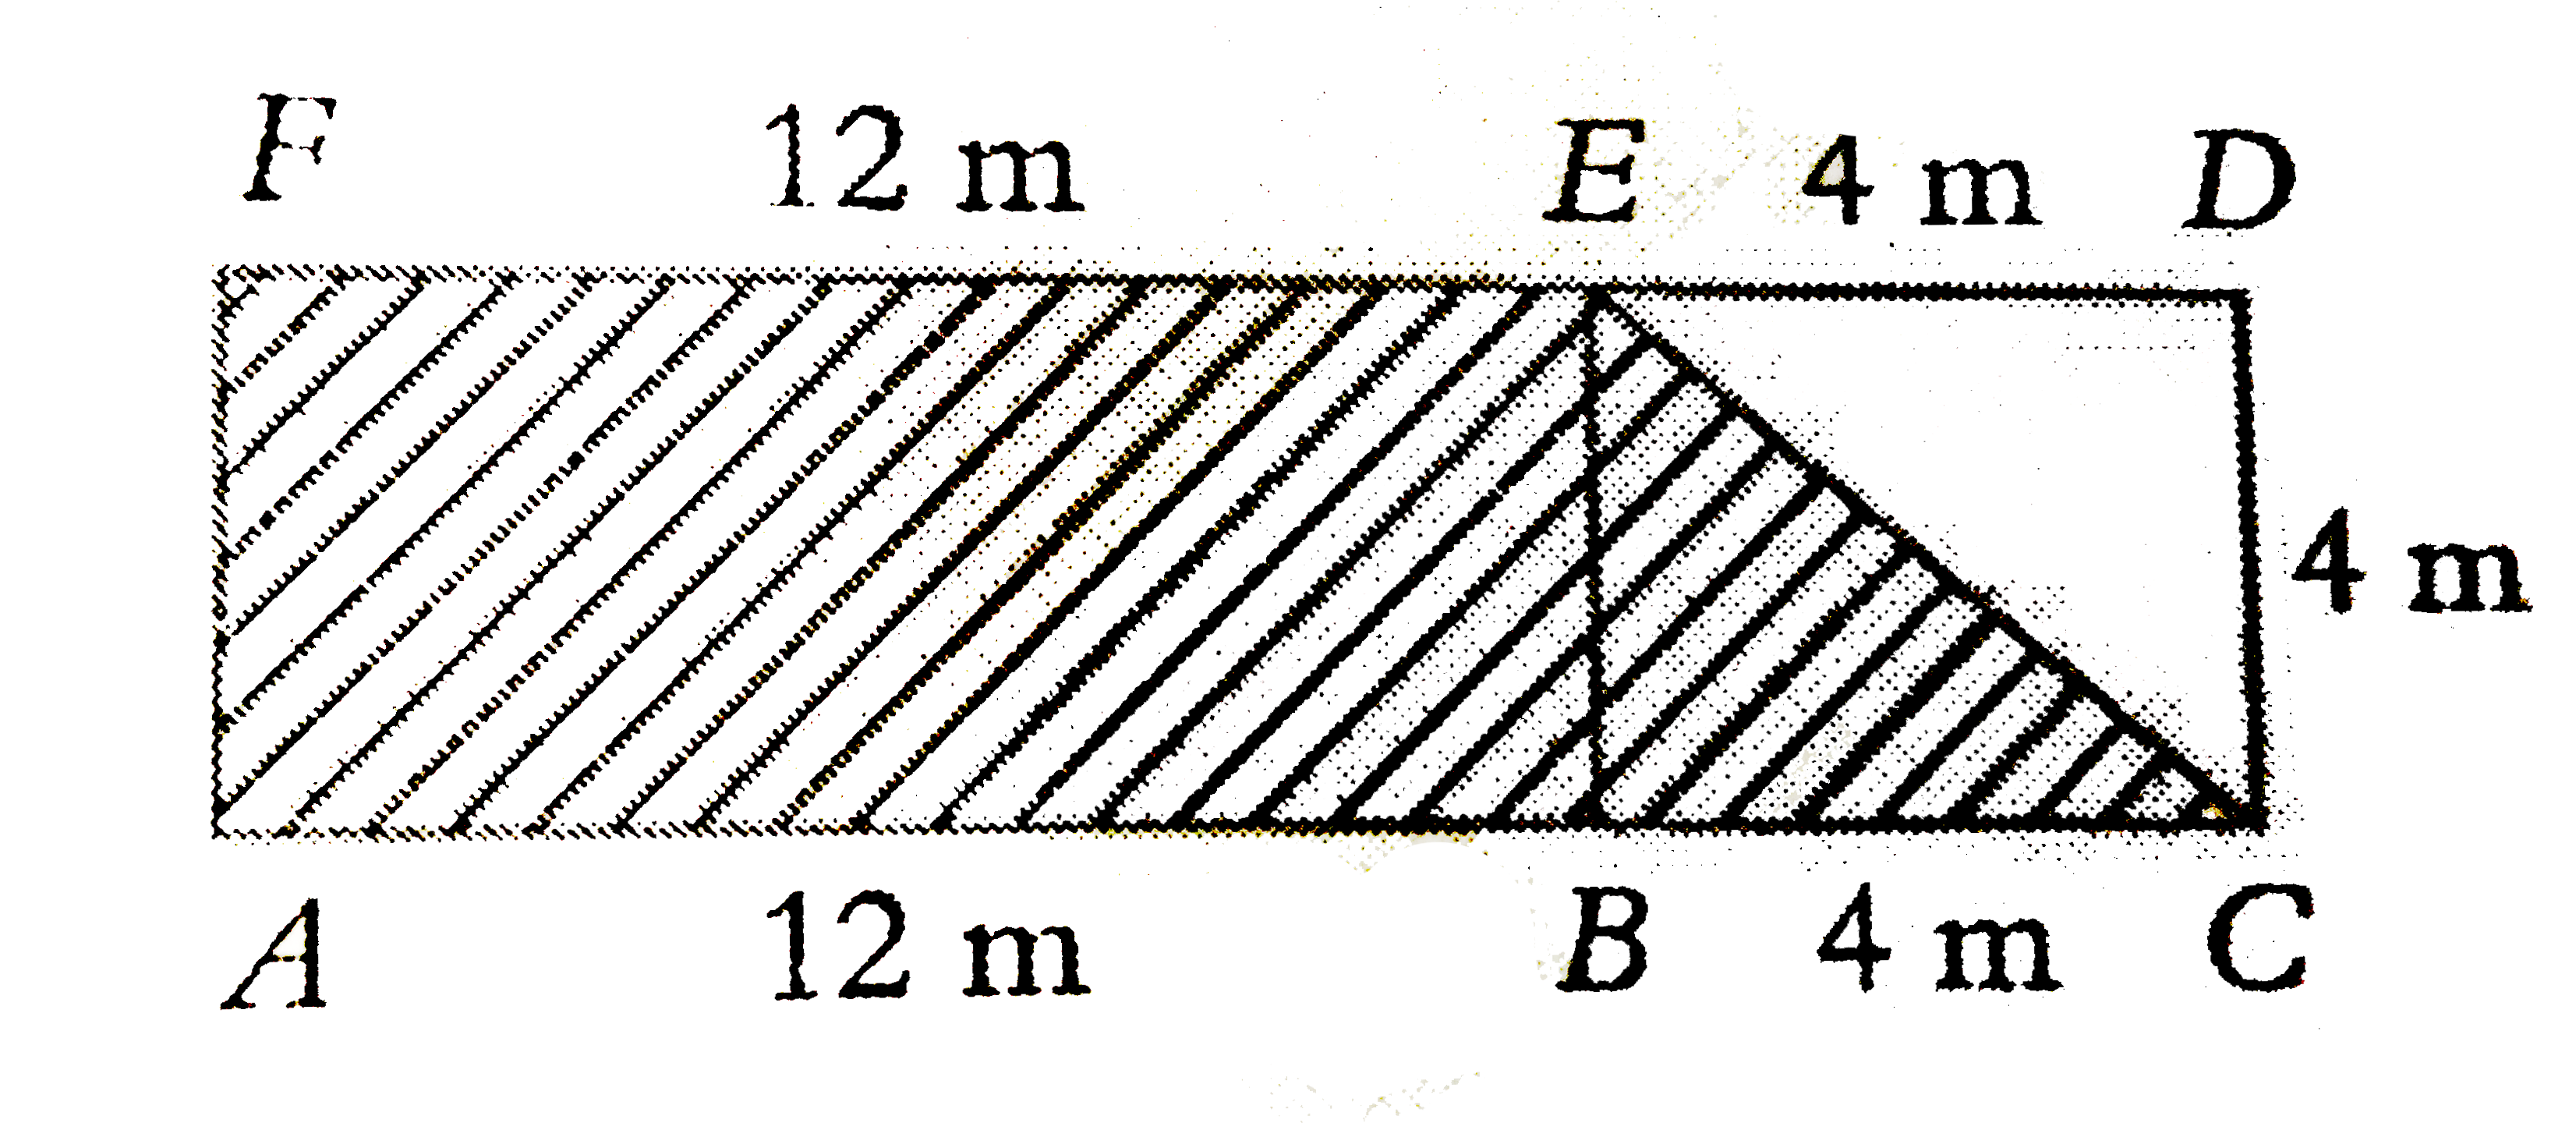
Find the area of the paths each having a uniform width in the following rectangular field.
ltimg src="https://d10lpgp6xz60nq.cloudfront.net/physics_images/PS_MATH_VII_C06_S01_002_Q01.png" width="80%"gt02:03View SolutionFind the area of the figure given below.
 02:12View Solution
The area of the shaded part in the figure given below is ______.
 10:13View Solution
Find the area of the shaded part in the figure given above.02:10View Solution
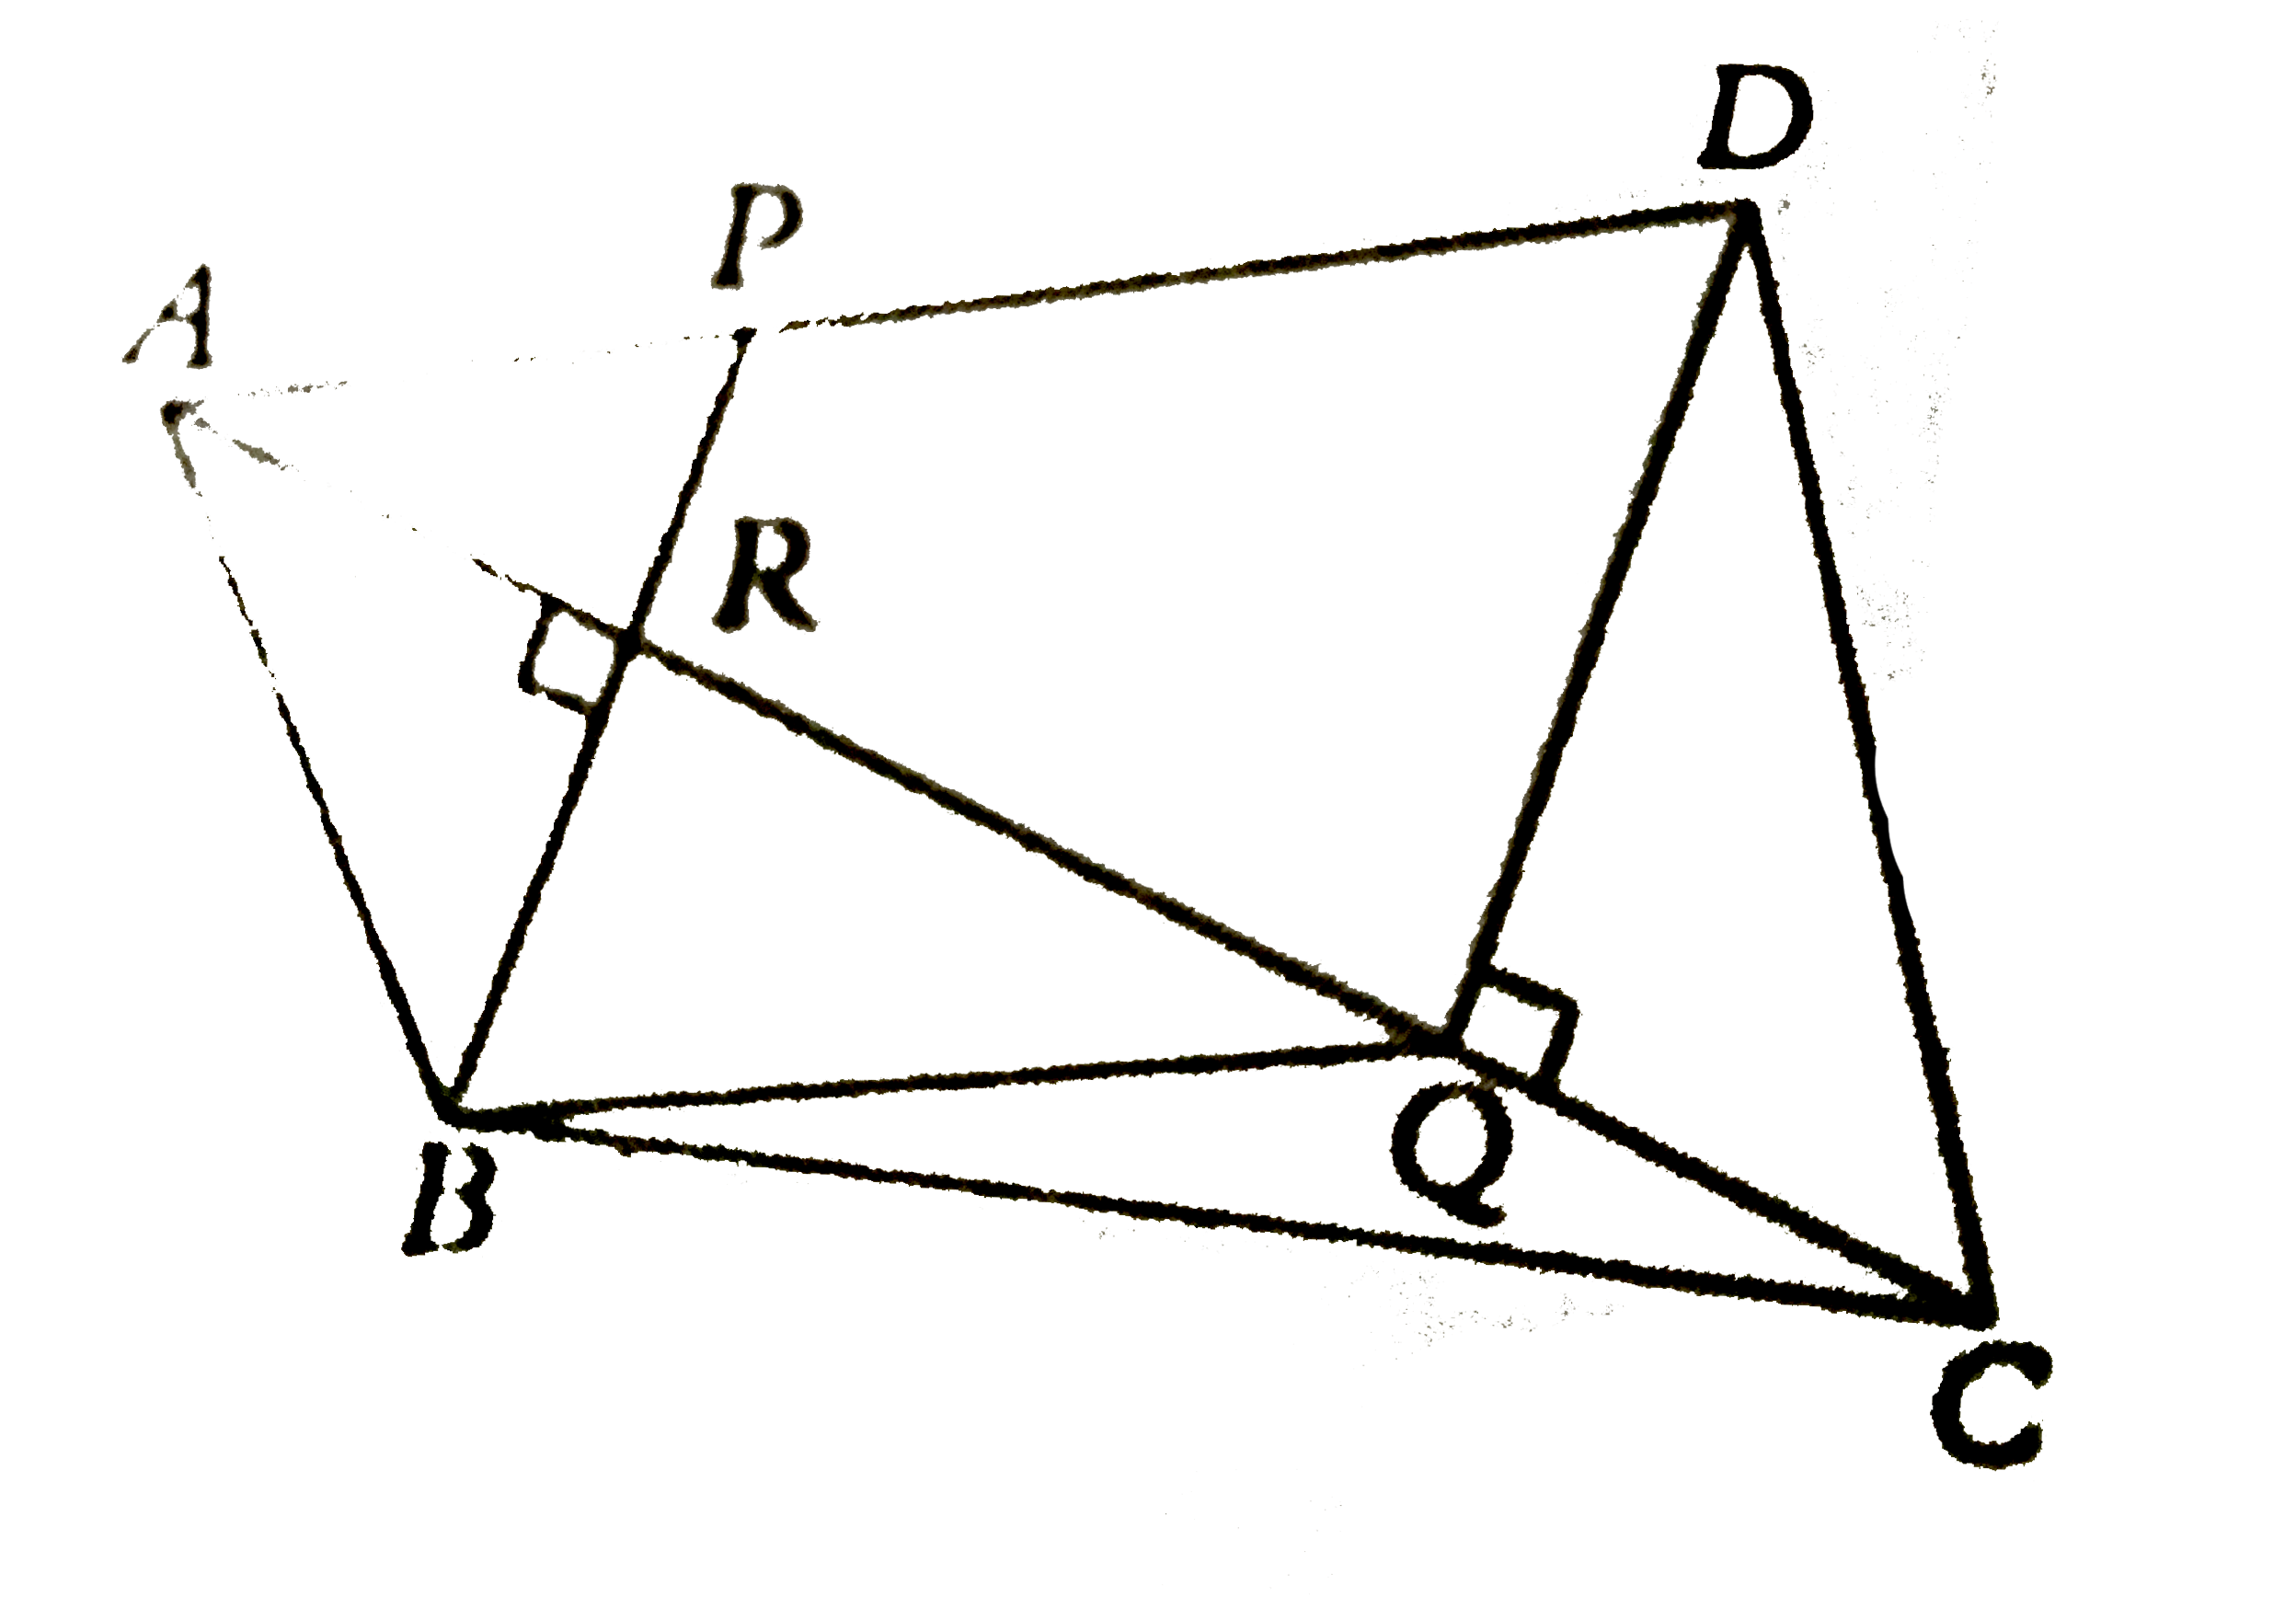
In the figure given above, ABCD is a quadrilateral and BPDQ is parallelogram. AR = 50 cm, CQ = 70 cm, BR = 60, and PR = 40 cm. If the area of the quadrilateral ABCD is 15,600cm2, then find the area of then find the area of the parallelogram BPDQ (in cm2).02:17View SolutionThe inequation represented by the graph given below is :
02:10View SolutionThe inequation that best describes the graph given below is _________
01:57View SolutionThe inequation that best describes the following graph is _________
01:52View Solution

