Assertion Any straight line on V-T diagram represents iisobaric process.
Reason In isobaric process, if V is doubled, then T will also become two times.
If both Assertion and Reason are correct and Reason is the correct explanation of Assertion.
If both Assertion and Reason are correct but Reason is not the correct explation os Assertion.
If Assertionis true bur Reason is false.
If Assertion is false but Reason is true.
The correct Answer is:D
To solve the question, we need to analyze both the assertion and the reason provided.
Step 1: Understand the Assertion
The assertion states that "Any straight line on the V-T (Volume-Temperature) diagram represents an isobaric process."
- In an isobaric process, the pressure (P) remains constant. According to the ideal gas law (PV = nRT), if pressure is constant, we can express volume (V) as a function of temperature (T):
V=nRPT
- This equation shows that volume is directly proportional to temperature when pressure is constant. Therefore, if we plot volume (V) on the x-axis and temperature (T) on the y-axis, the graph will be a straight line passing through the origin.
Step 2: Analyze the Reason
The reason states that "In an isobaric process, if V is doubled, then T will also become two times."
- From the relationship derived above, since V∝T in an isobaric process, if the volume is doubled, the temperature must also double to maintain the proportional relationship. This statement is true.
Step 3: Conclusion
- The assertion is false because not every straight line on the V-T diagram represents an isobaric process; only the straight lines that pass through the origin do.
- The reason is true as it correctly describes the relationship between volume and temperature in an isobaric process.
Final Answer
- Assertion: False
- Reason: True
Thus, the correct answer is that the assertion is false, and the reason is true.
---
The assertion states that "Any straight line on the V-T (Volume-Temperature) diagram represents an isobaric process."
V=nRPT
The reason states that "In an isobaric process, if V is doubled, then T will also become two times."
- The assertion is false because not every straight line on the V-T diagram represents an isobaric process; only the straight lines that pass through the origin do.
- The reason is true as it correctly describes the relationship between volume and temperature in an isobaric process.
- Assertion: False
- Reason: True
Topper's Solved these Questions
- THERMOMETRY THERMAL EXPANSION AND KINETIC THEORY OF GASESBOOK - DC PANDEY ENGLISHCHAPTER - THERMOMETRY THERMAL EXPANSION AND KINETIC THEORY OF GASESEXERCISE - Match the columns
5 Videos
- THERMOMETRY THERMAL EXPANSION AND KINETIC THEORY OF GASESBOOK - DC PANDEY ENGLISHCHAPTER - THERMOMETRY THERMAL EXPANSION AND KINETIC THEORY OF GASESEXERCISE - Medical entrance gallary
30 Videos
- THERMOMETRY THERMAL EXPANSION AND KINETIC THEORY OF GASESBOOK - DC PANDEY ENGLISHCHAPTER - THERMOMETRY THERMAL EXPANSION AND KINETIC THEORY OF GASESEXERCISE - A Tacking it together
55 Videos
- SUPERPOSITION OF WAVESBOOK - DC PANDEY ENGLISHCHAPTER - SUPERPOSITION OF WAVESEXERCISE - Level 2 Subjective
8 Videos
- THERMOMETRY,THERMAL EXPANSION & KINETIC THEORY OF GASESBOOK - DC PANDEY ENGLISHCHAPTER - THERMOMETRY,THERMAL EXPANSION & KINETIC THEORY OF GASESEXERCISE - Level 2 Subjective
9 Videos
Similar Questions
Knowledge Check
Which of the following P-V diagram represent the graph of isometric process?
A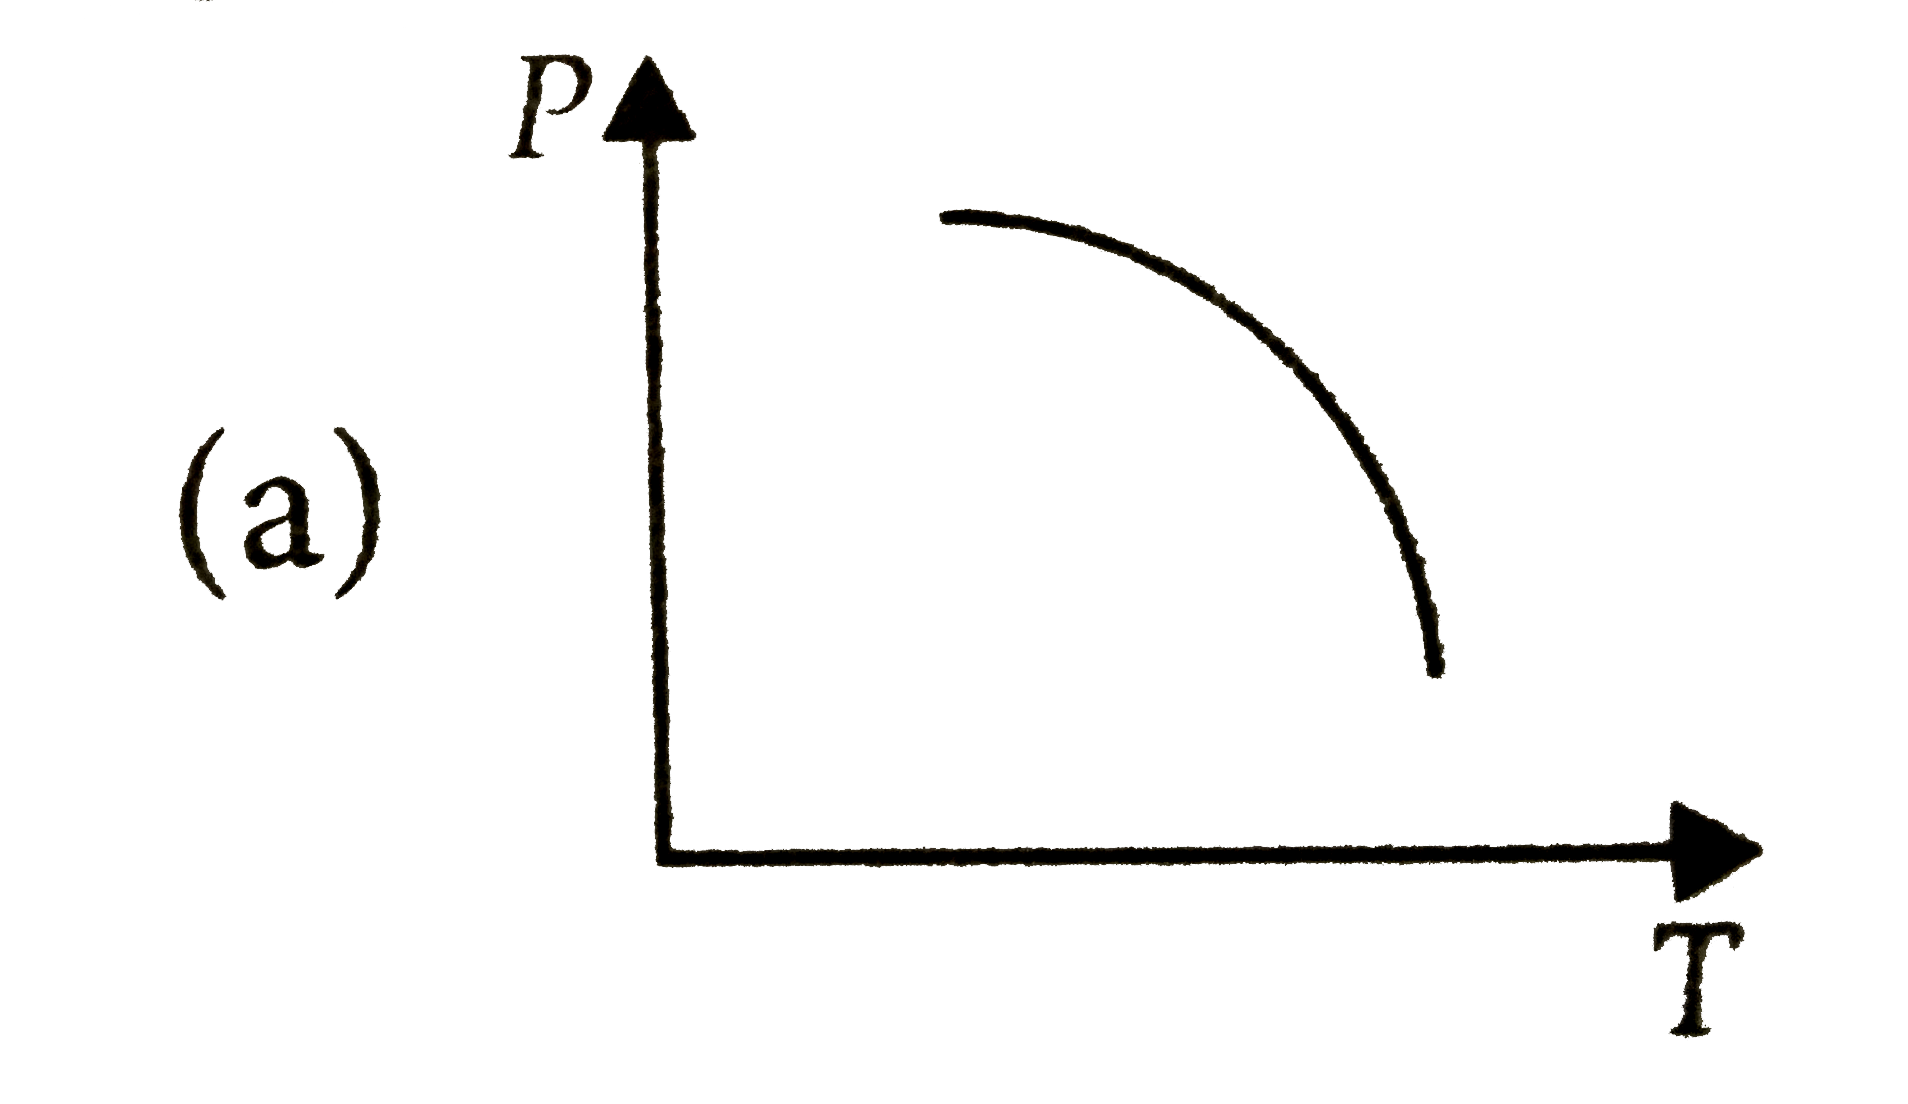 B
B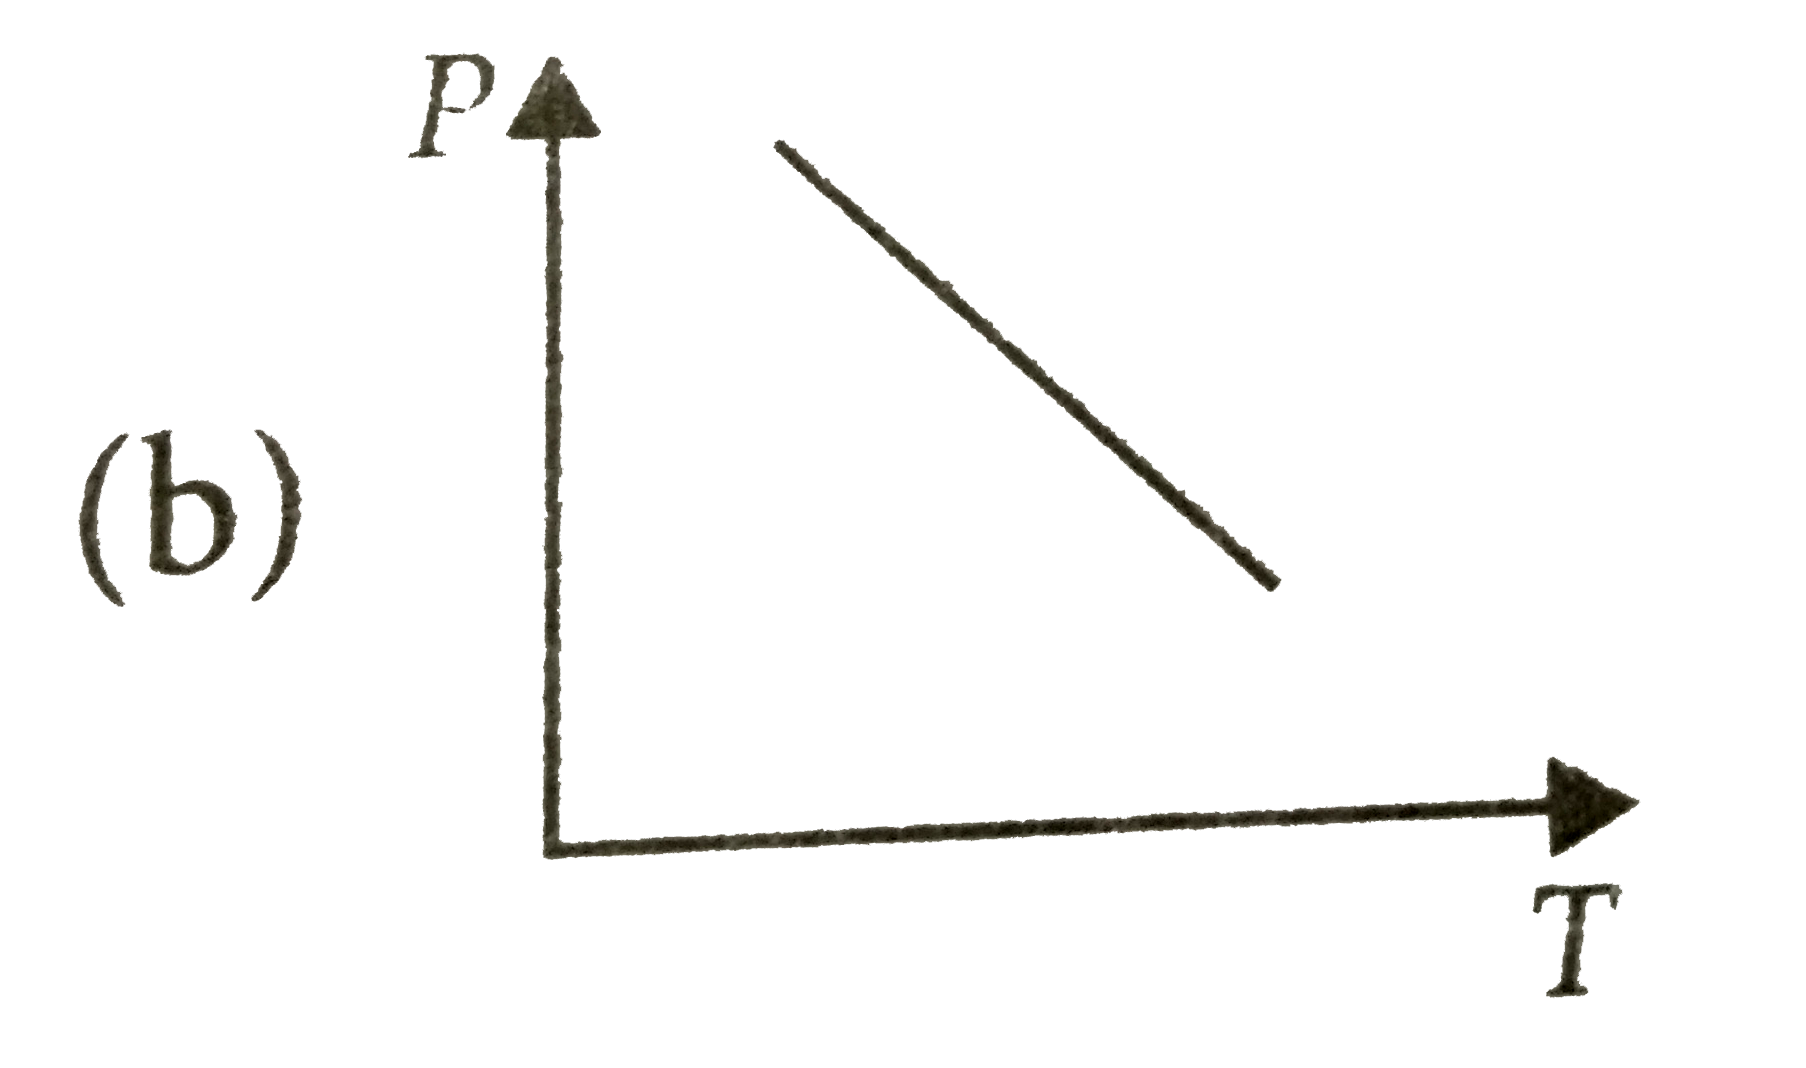 C
C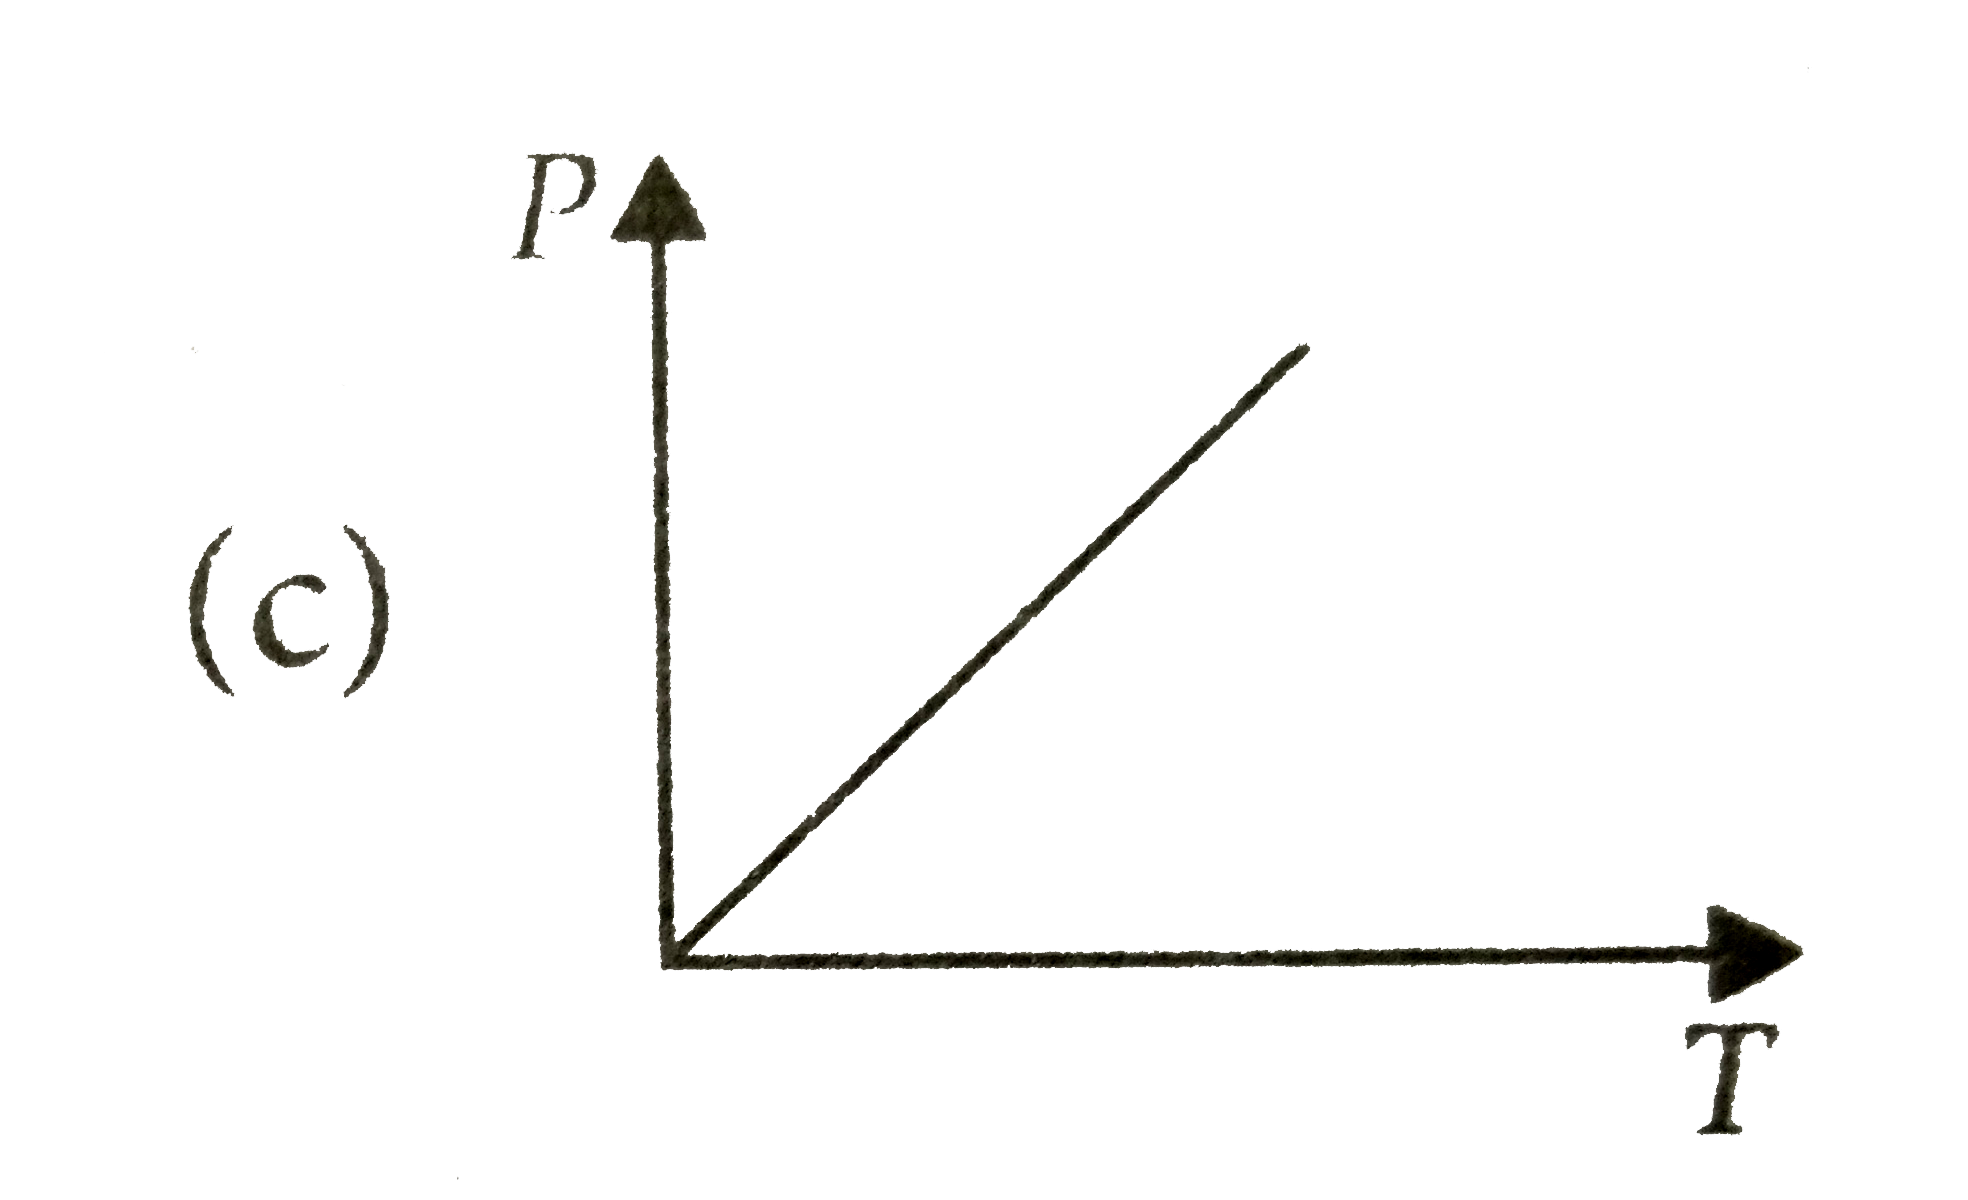 D
D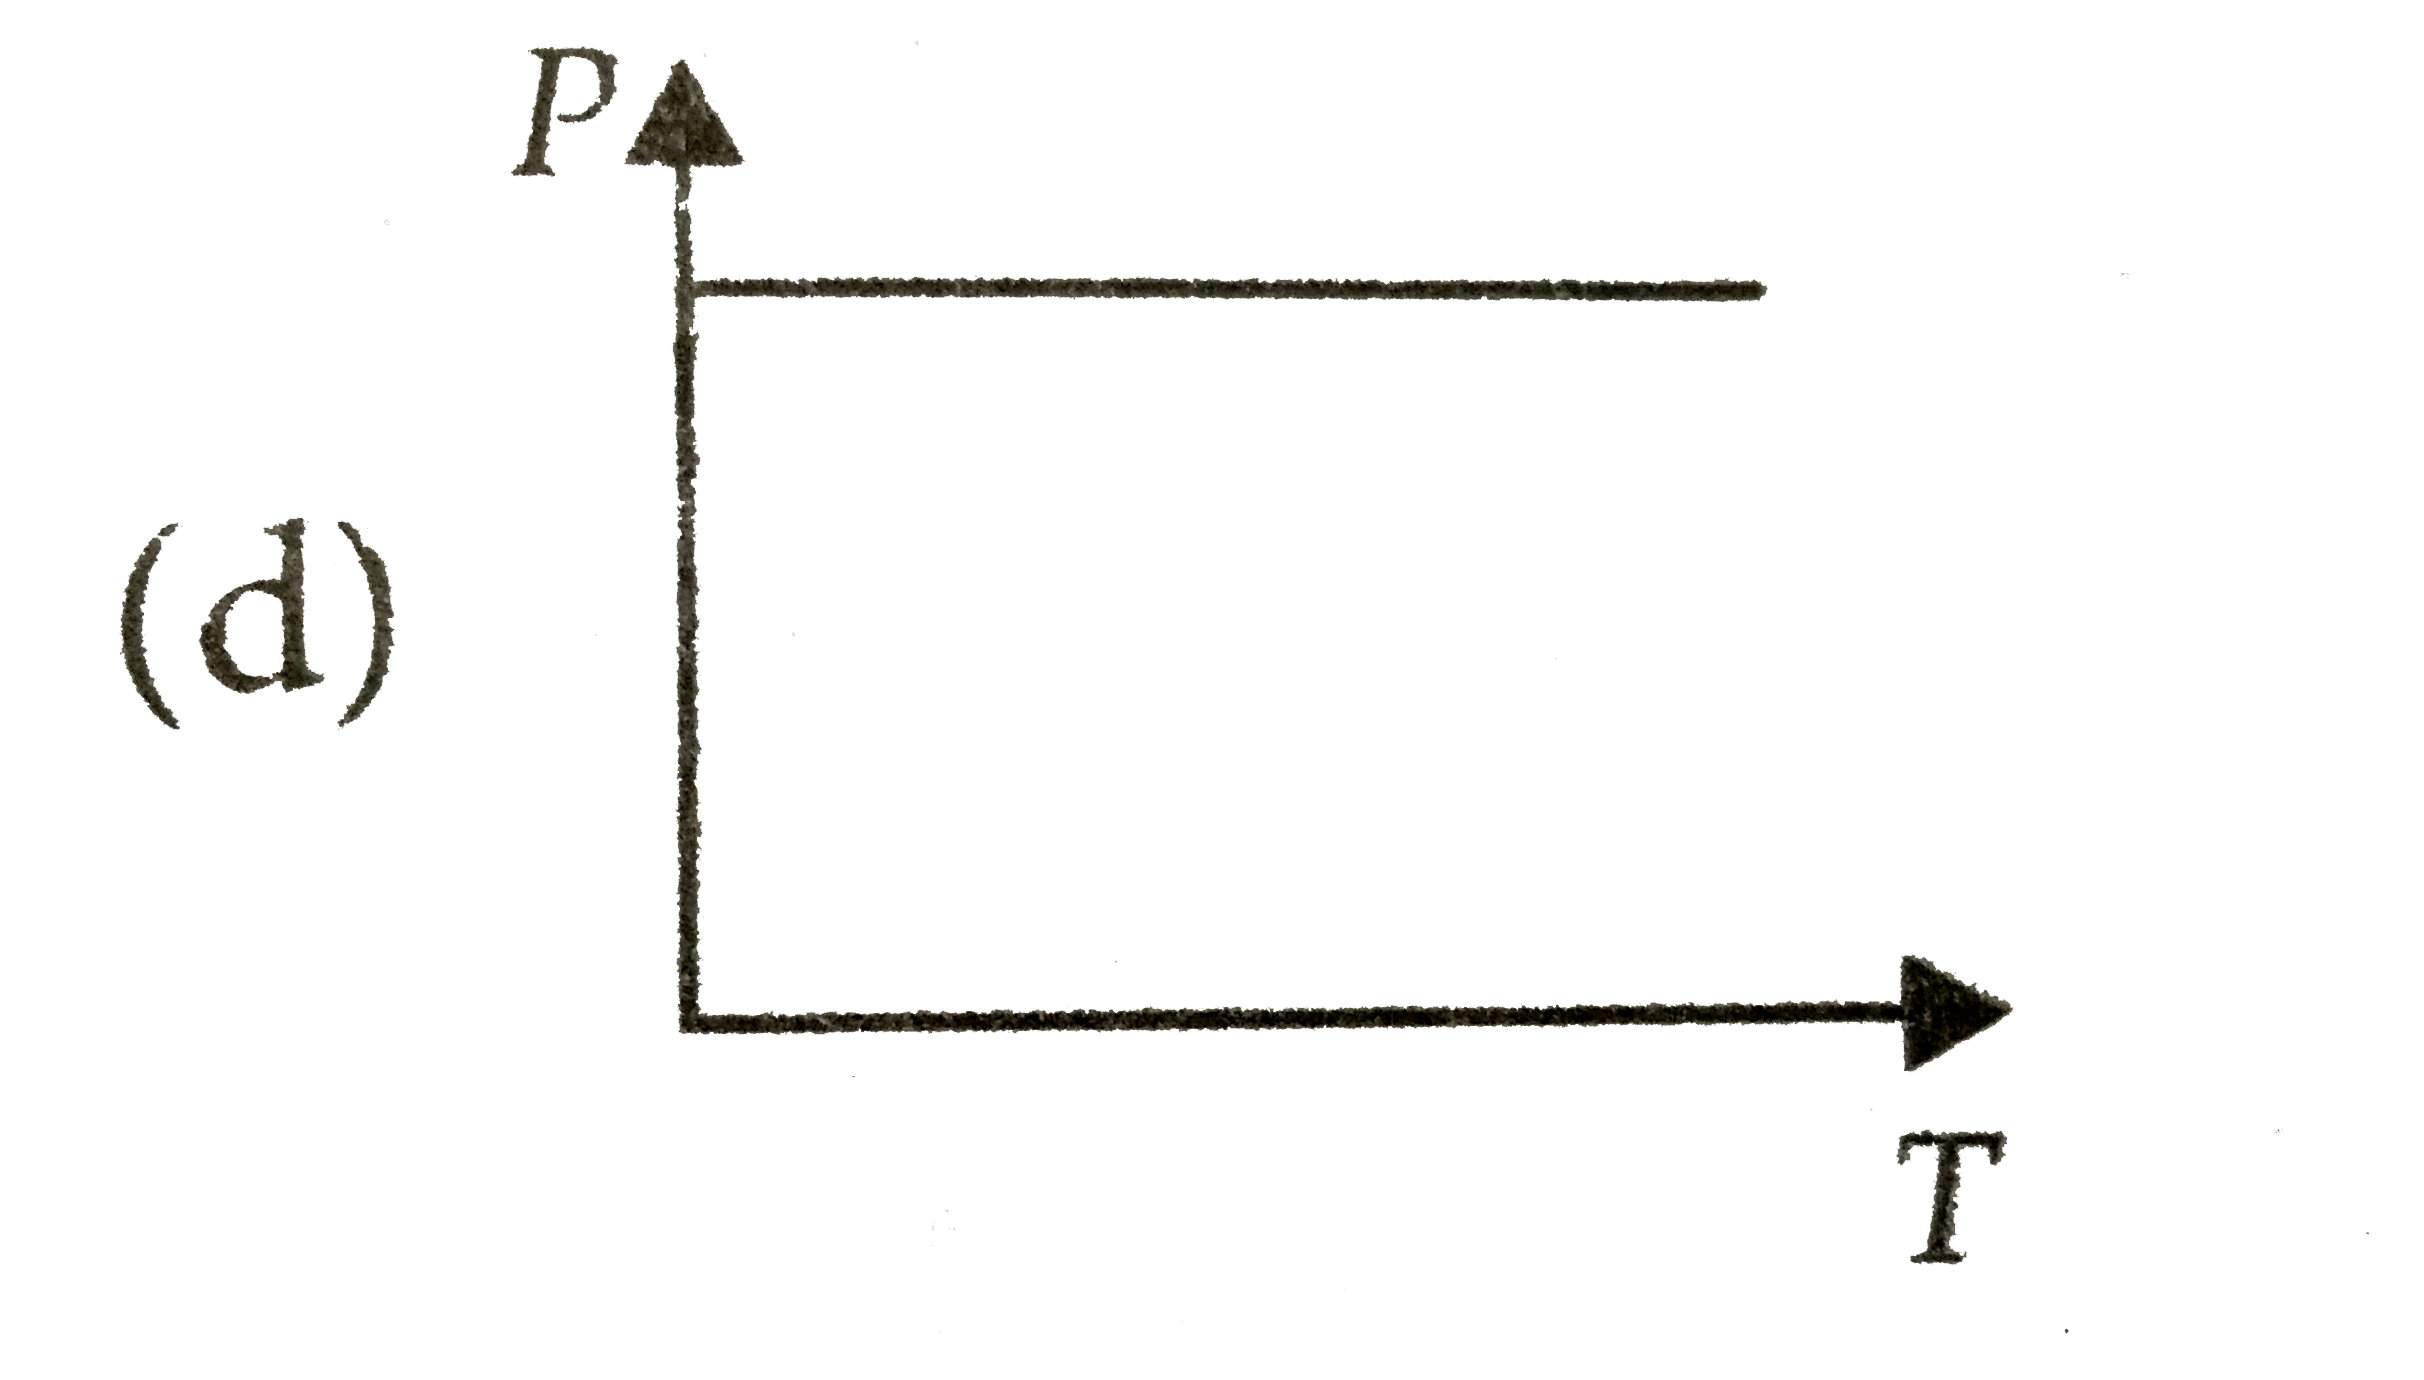
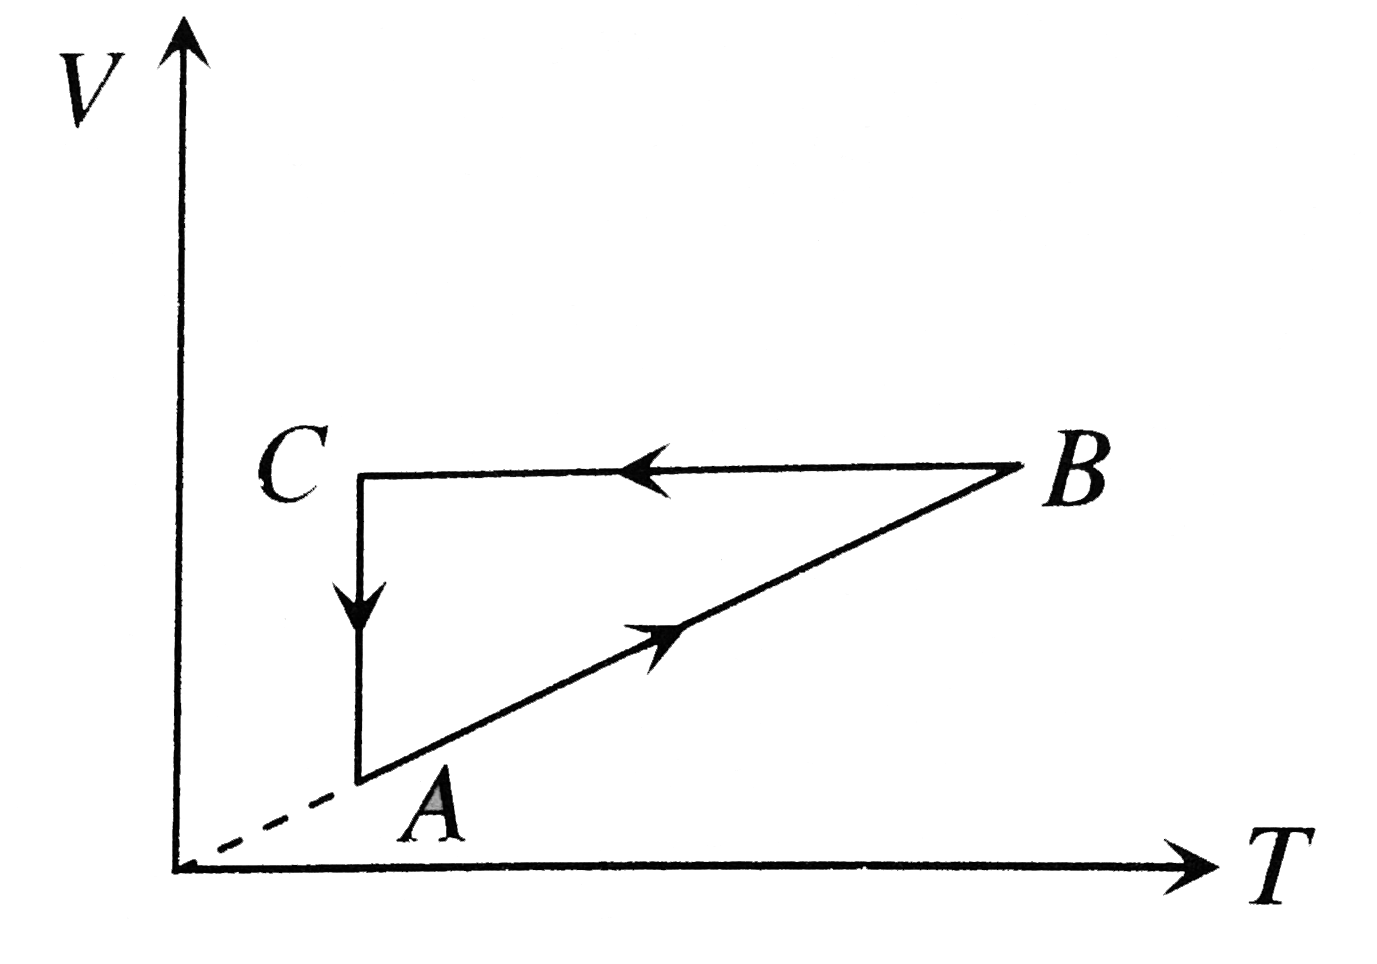
A cyclic process ABCA is shown in the V−T diagram process on the P−V
 A
A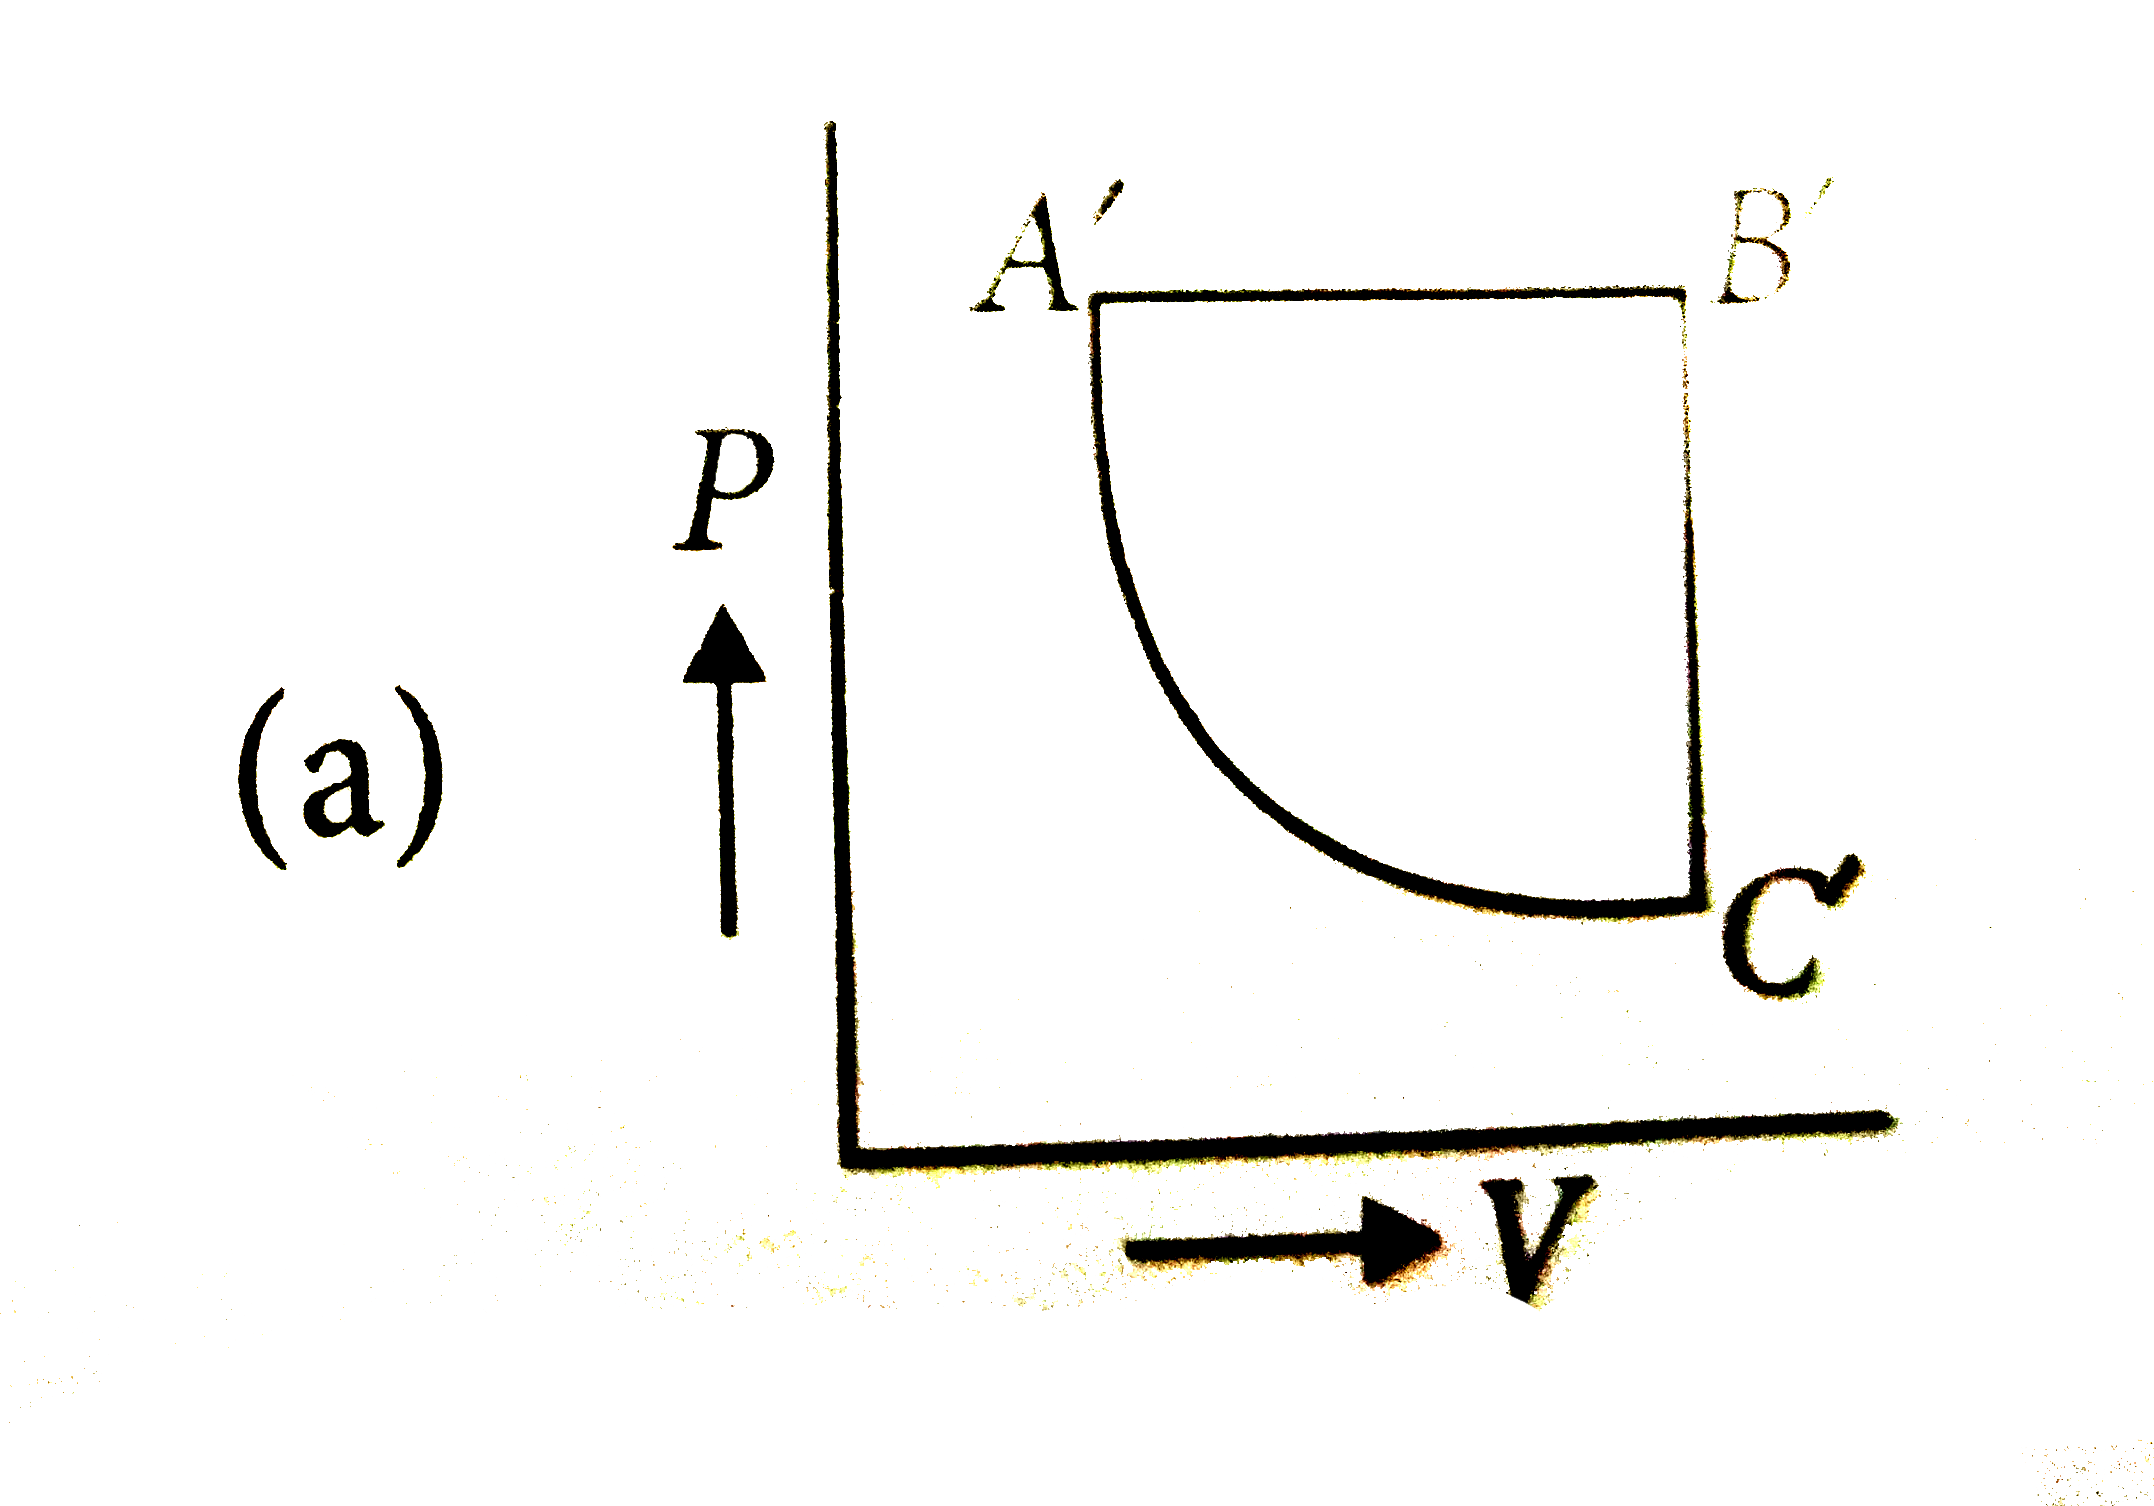 B
B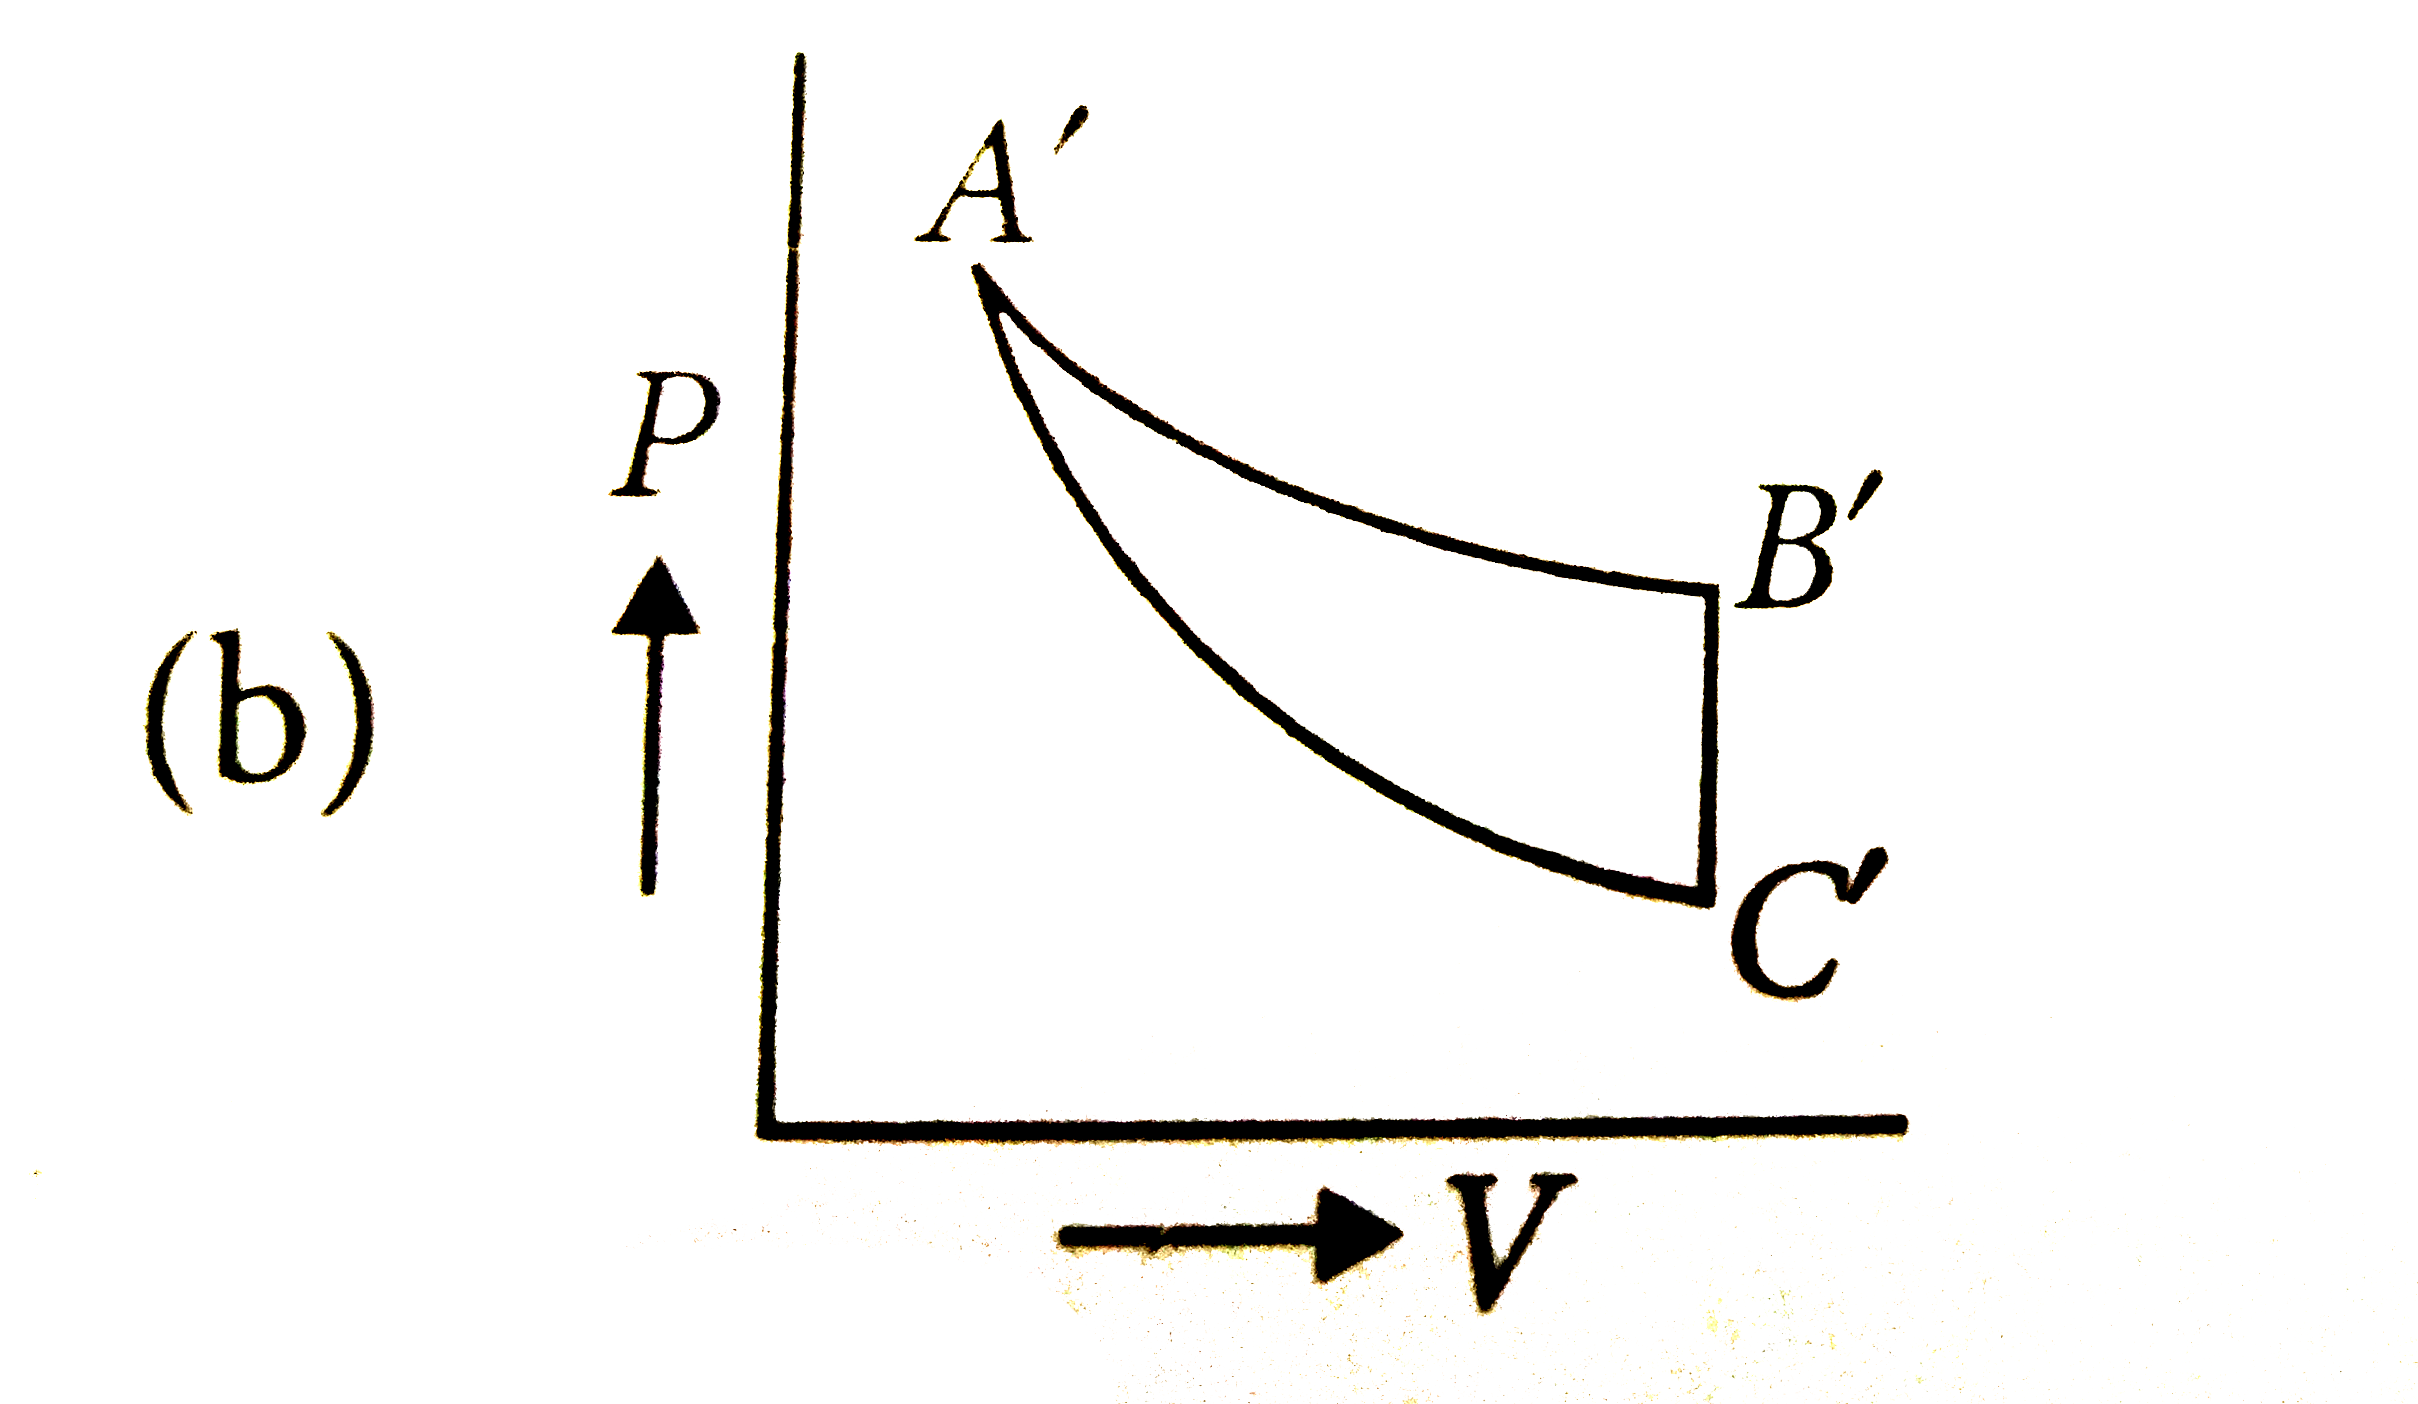 C
C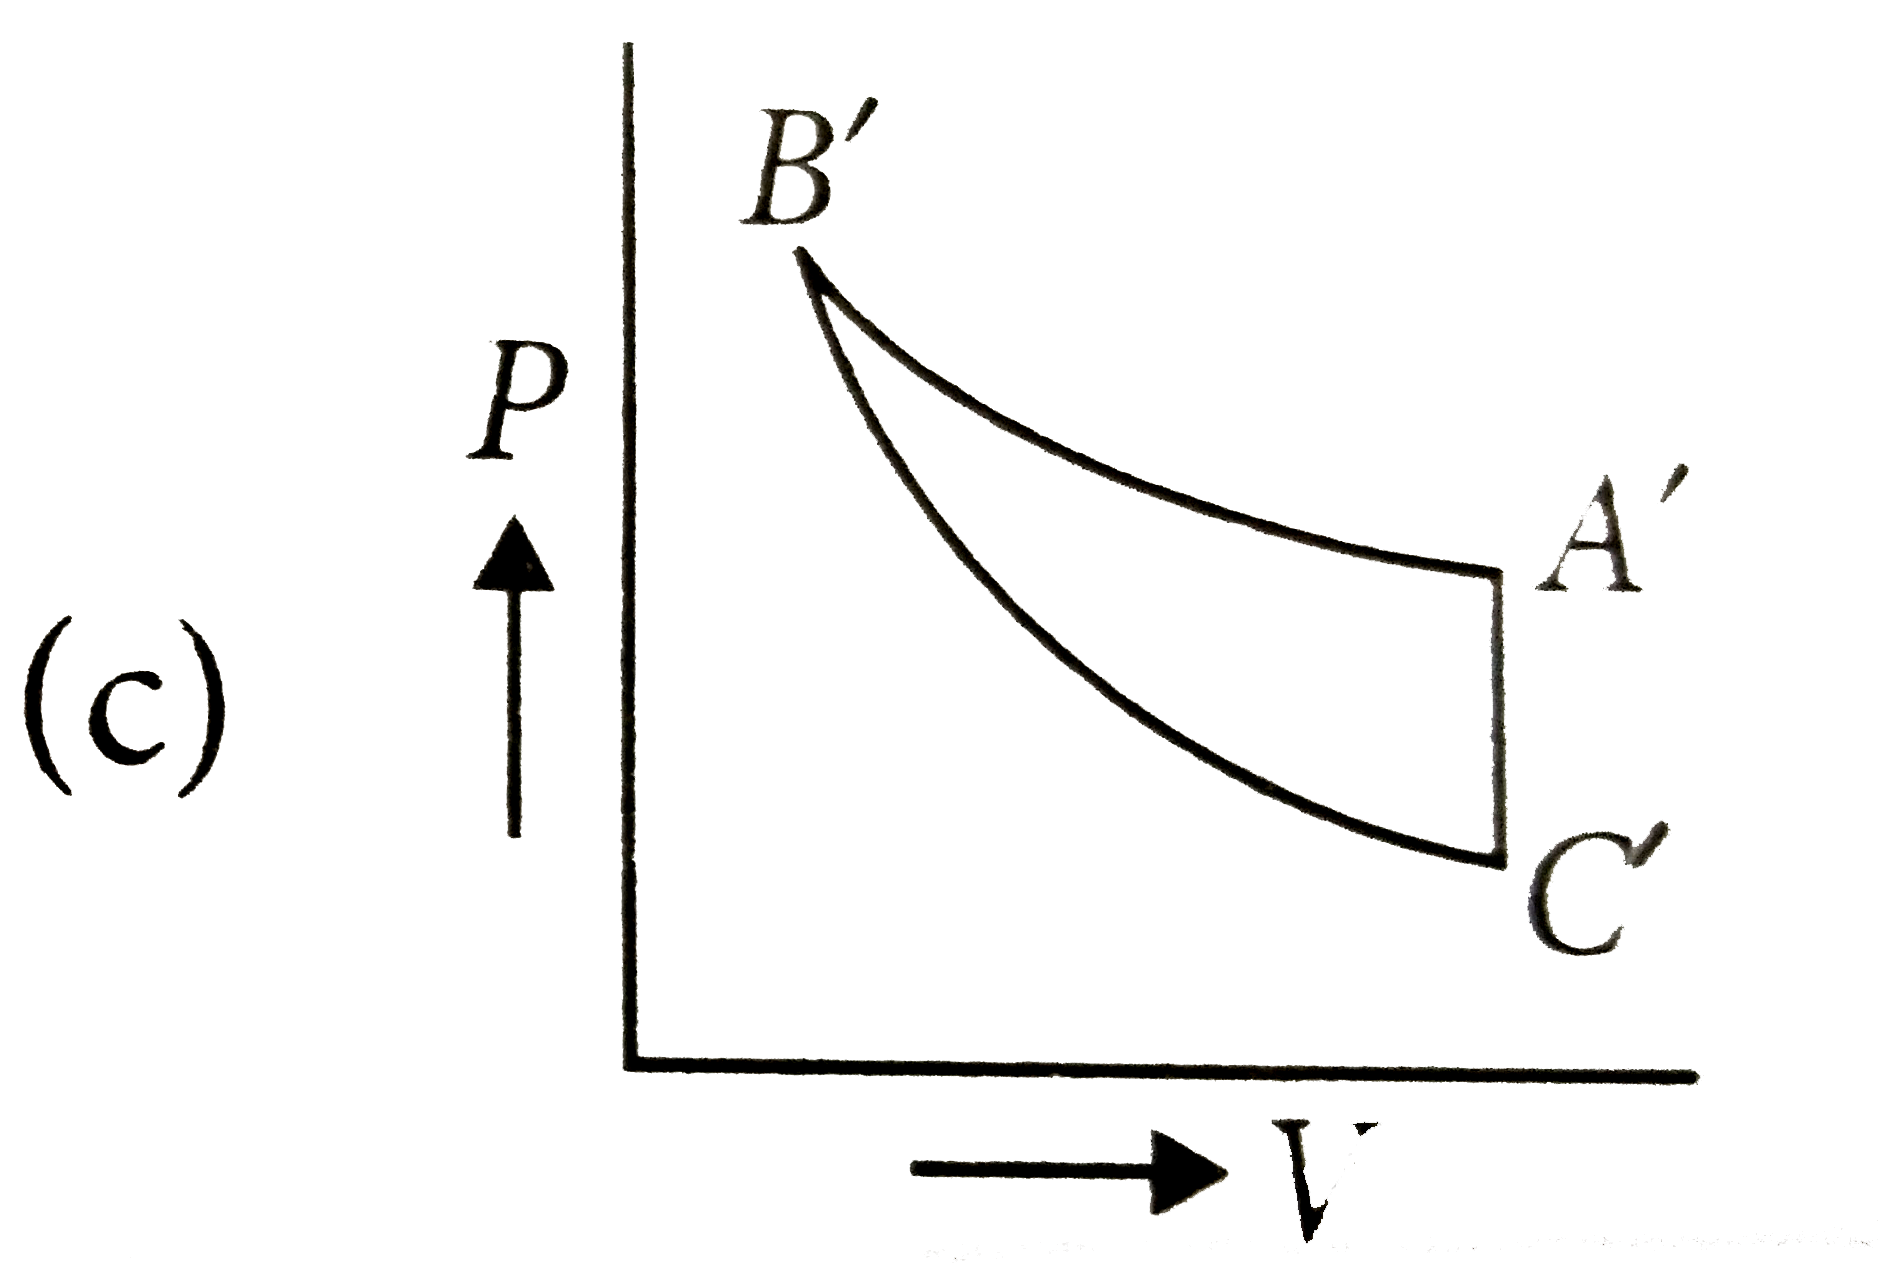 D
D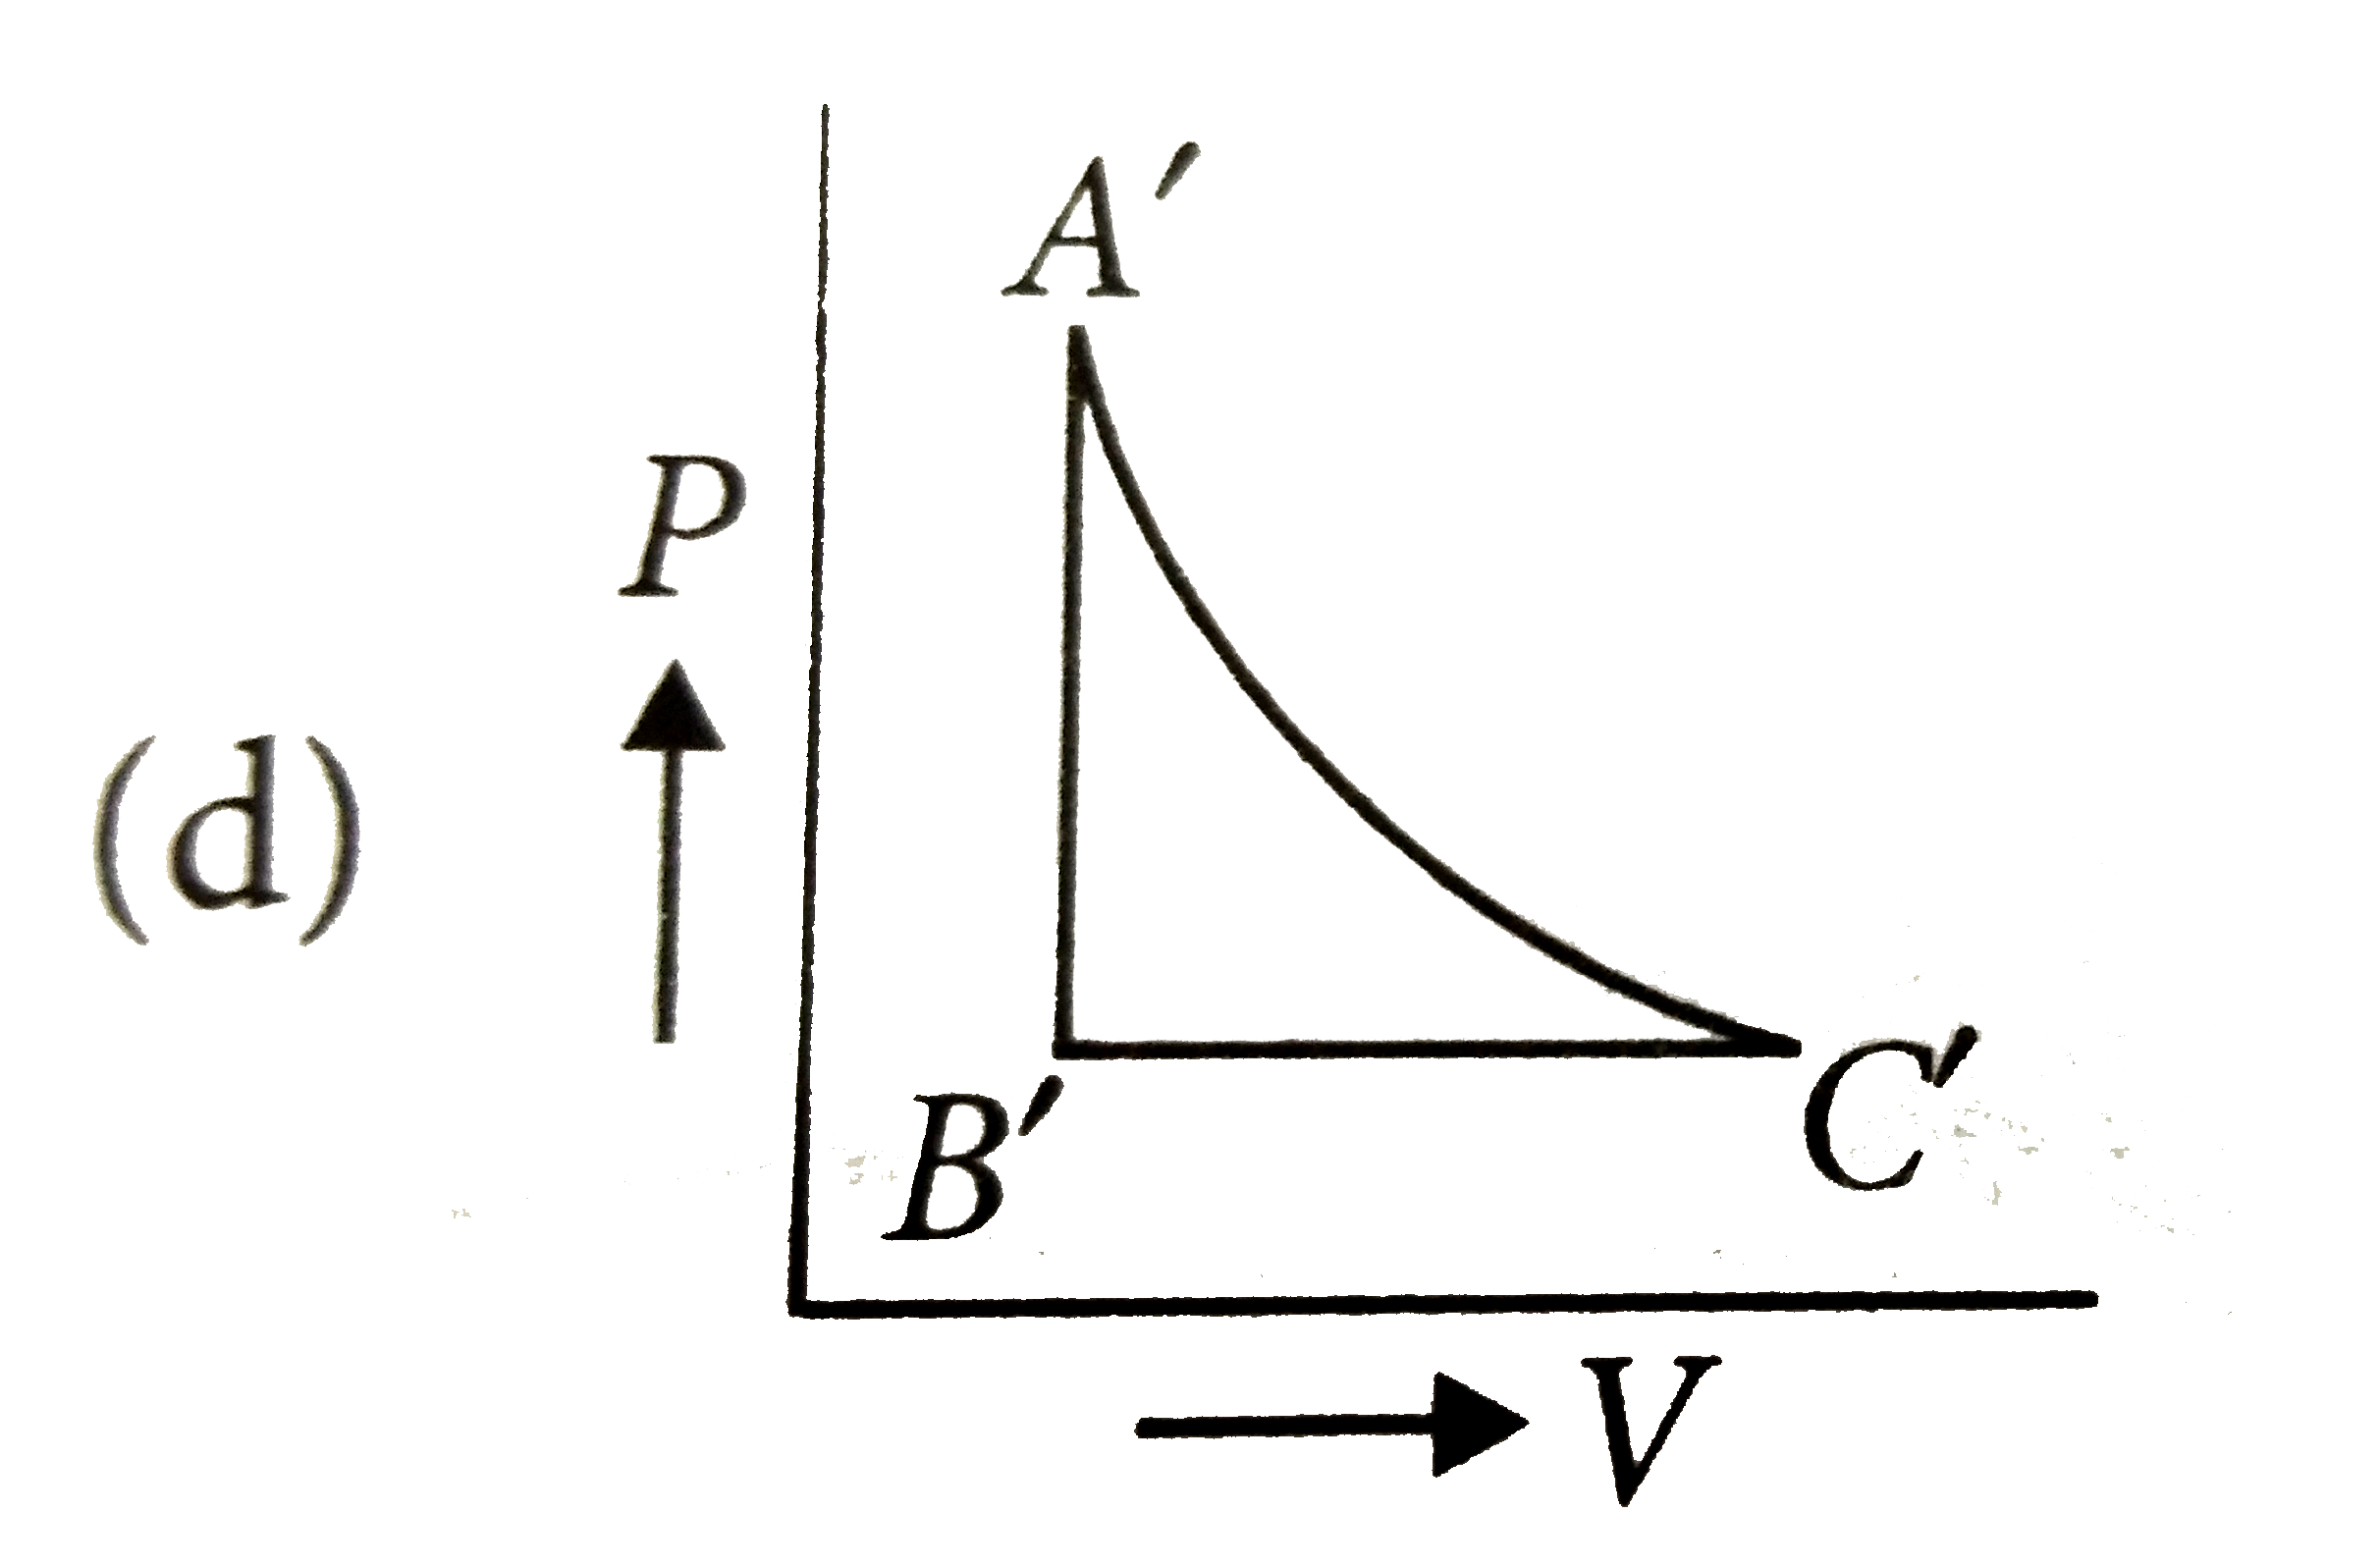
Assertion: Straight line on (p - T) graph for an ideal gas represents isochoric process.
Reason: If p∝T,V=constant.
View SolutionStraight line on (p - T) graph for an ideal gas represents isochoric process.
If p∝T,V=constant.
View SolutionAssertion: P v/s 1V graph is straight line for adiabatic process.
Reason: PV=constant for adiabatic process.
View Solution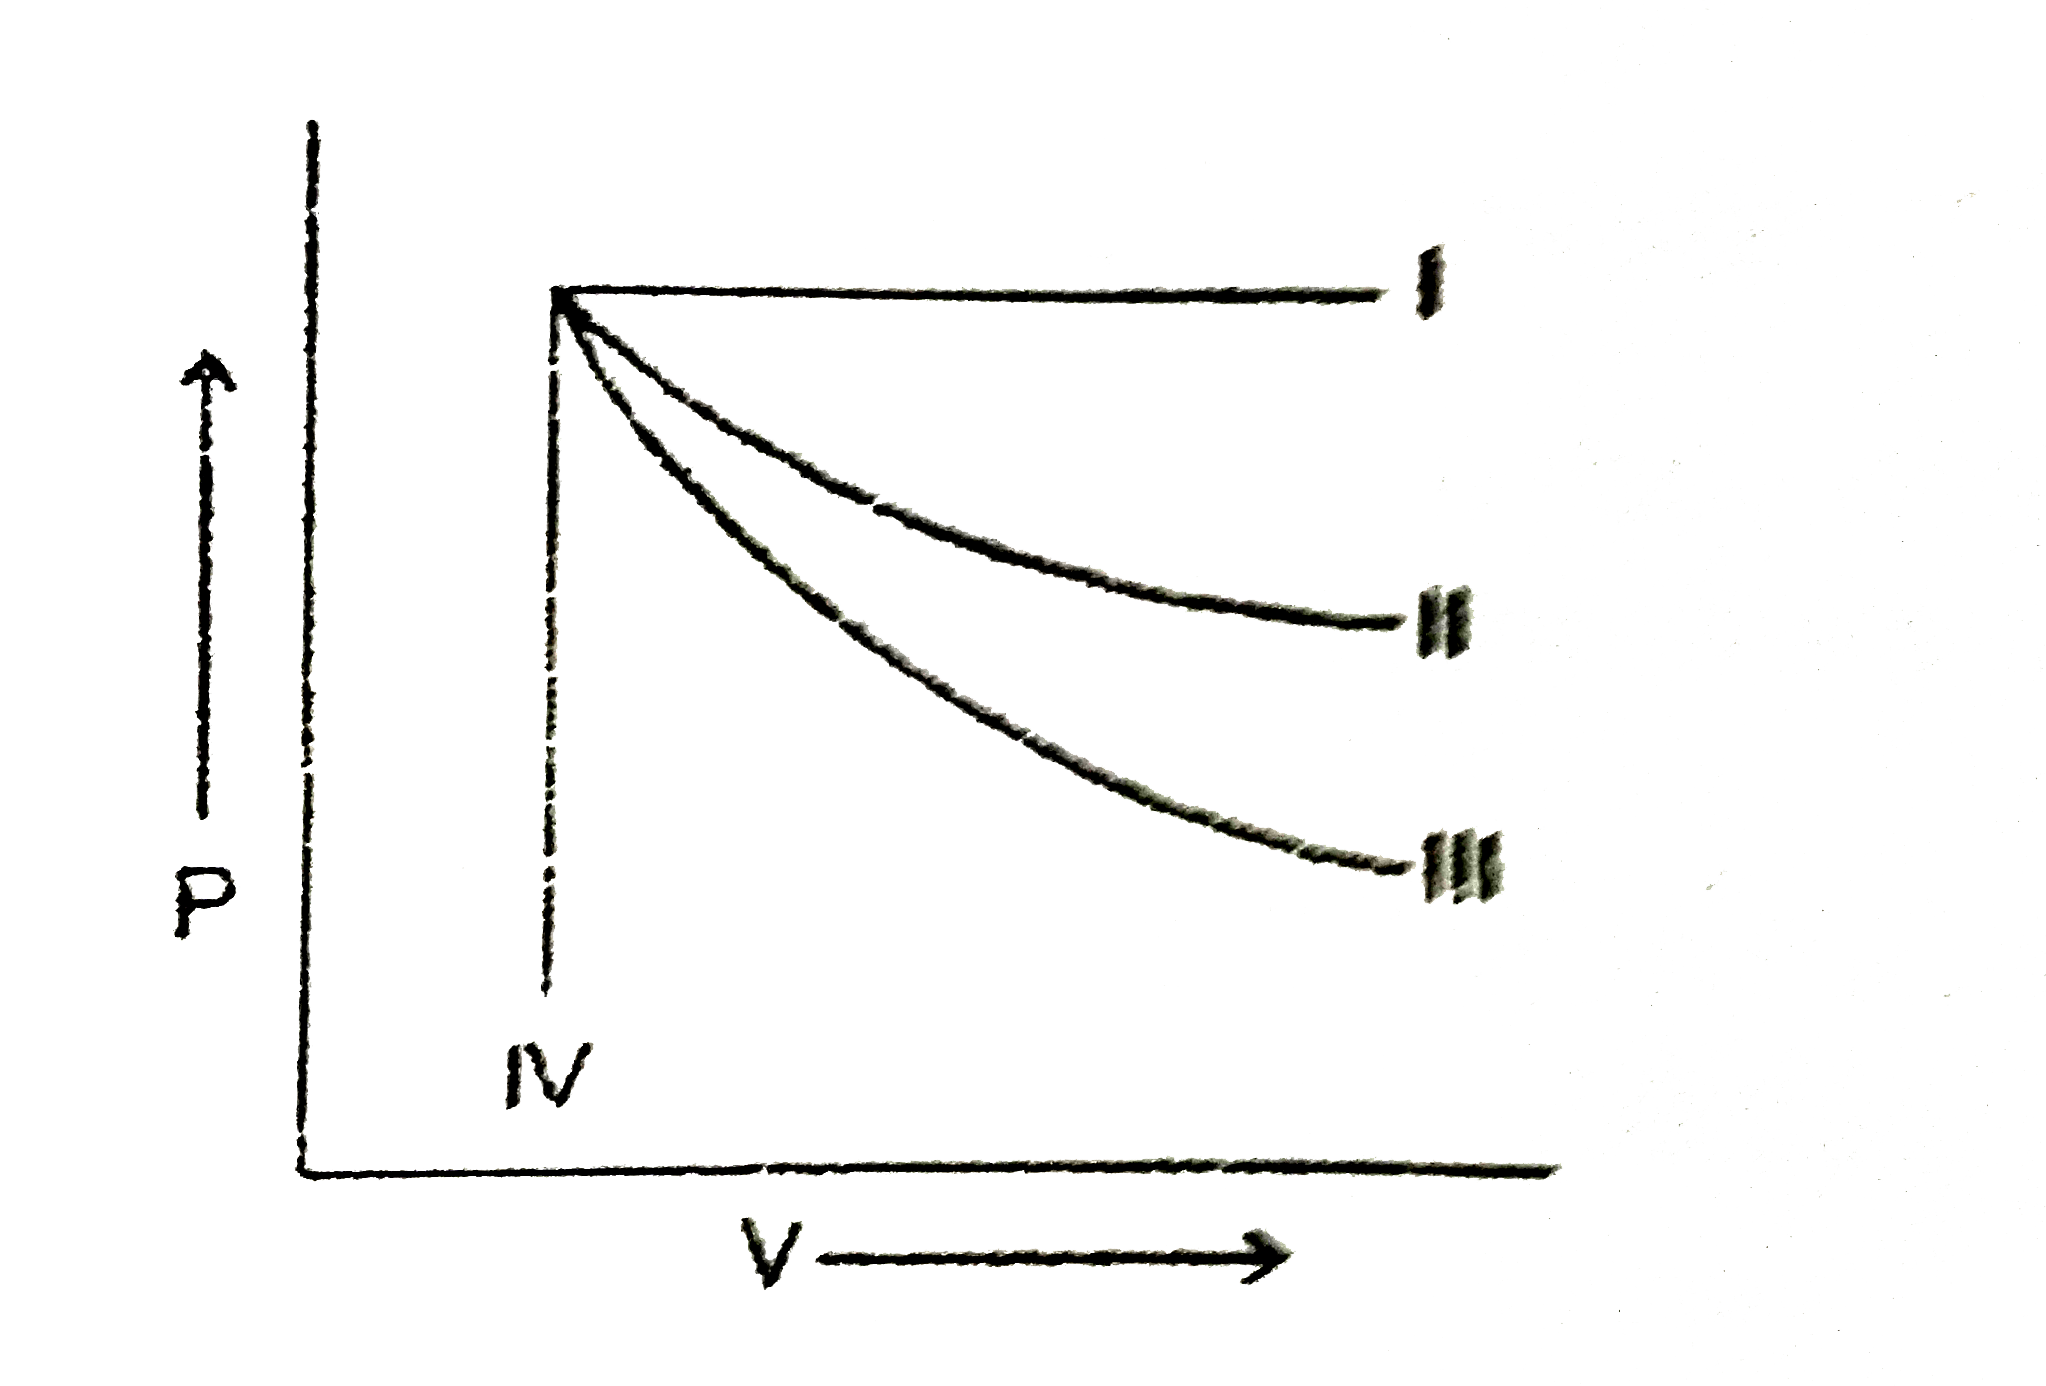
The plots between P and V which represent isochoric and isobaric process respectively:
View SolutionWhich of the following is a V-T curve for isobaric process?
View SolutionAssertion Molar heat capacity cannot be defined for isothermal process.
Reason In isothermal prcess p-V versus T graph is a dot.
View Solution
