Assertion Straight line on V-T graph represents isobaric process.
Reason If V ∝ T, then p= constant i.e., orocess is isobaric.
If both Assertion and Reason are correct and Reason is the correct explanation of Assertion.
If both Assertion and Reason are correct but Reason is not the correct explation os Assertion.
If Assertionis true bur Reason is false.
If Assertion is false but Reason is true.
The correct Answer is:D
To solve the question, we need to analyze the assertion and reason provided:
Assertion: A straight line on the V-T graph represents an isobaric process.
Reason: If V is proportional to T, then P = constant, i.e., the process is isobaric.
1. Understanding the V-T Graph:
- The V-T graph plots volume (V) on the y-axis and temperature (T) on the x-axis.
- For an isobaric process (constant pressure), the relationship between volume and temperature can be derived from the ideal gas law, PV=nRT.
2. Analyzing the Assertion:
- A straight line on the V-T graph indicates a linear relationship between volume and temperature.
- For a process to be isobaric, the equation V=nRPT must hold true, where n and R are constants.
- If pressure (P) is constant, then the equation represents a straight line that passes through the origin (0,0).
3. Checking if the Straight Line Passes Through the Origin:
- If the straight line does not pass through the origin, it indicates that the pressure is not constant throughout the process.
- Therefore, the assertion that a straight line on the V-T graph represents an isobaric process is false unless it passes through the origin.
4. Analyzing the Reason:
- The reason states that if V∝T, then P must be constant.
- This is derived from the relationship V=nRPT. If n and R are constants, and V is proportional to T, then P must indeed be constant.
- Thus, the reason is true.
5. Conclusion:
- Since the assertion is false and the reason is true, we conclude that the correct option is that the assertion is false, and the reason is true.
Final Answer:
- Assertion: False
- Reason: True
- The V-T graph plots volume (V) on the y-axis and temperature (T) on the x-axis.
- For an isobaric process (constant pressure), the relationship between volume and temperature can be derived from the ideal gas law, PV=nRT.
- A straight line on the V-T graph indicates a linear relationship between volume and temperature.
- For a process to be isobaric, the equation V=nRPT must hold true, where n and R are constants.
- If pressure (P) is constant, then the equation represents a straight line that passes through the origin (0,0).
- If the straight line does not pass through the origin, it indicates that the pressure is not constant throughout the process.
- Therefore, the assertion that a straight line on the V-T graph represents an isobaric process is false unless it passes through the origin.
- The reason states that if V∝T, then P must be constant.
- This is derived from the relationship V=nRPT. If n and R are constants, and V is proportional to T, then P must indeed be constant.
- Thus, the reason is true.
- Since the assertion is false and the reason is true, we conclude that the correct option is that the assertion is false, and the reason is true.
- Assertion: False
- Reason: True
Topper's Solved these Questions
- THERMOMETRY THERMAL EXPANSION AND KINETIC THEORY OF GASESBOOK - DC PANDEY ENGLISHCHAPTER - THERMOMETRY THERMAL EXPANSION AND KINETIC THEORY OF GASESEXERCISE - Match the columns
5 Videos
- THERMOMETRY THERMAL EXPANSION AND KINETIC THEORY OF GASESBOOK - DC PANDEY ENGLISHCHAPTER - THERMOMETRY THERMAL EXPANSION AND KINETIC THEORY OF GASESEXERCISE - Medical entrance gallary
30 Videos
- THERMOMETRY THERMAL EXPANSION AND KINETIC THEORY OF GASESBOOK - DC PANDEY ENGLISHCHAPTER - THERMOMETRY THERMAL EXPANSION AND KINETIC THEORY OF GASESEXERCISE - A Tacking it together
55 Videos
- SUPERPOSITION OF WAVESBOOK - DC PANDEY ENGLISHCHAPTER - SUPERPOSITION OF WAVESEXERCISE - Level 2 Subjective
8 Videos
- THERMOMETRY,THERMAL EXPANSION & KINETIC THEORY OF GASESBOOK - DC PANDEY ENGLISHCHAPTER - THERMOMETRY,THERMAL EXPANSION & KINETIC THEORY OF GASESEXERCISE - Level 2 Subjective
9 Videos
Similar Questions
Knowledge Check
Slope of PV and V for an isobaric process will be
A−1BzeroC+1Dn R TWhich of the following P-V diagram represent the graph of isometric process?
A B
B C
C D
D
Assertion Any straight line on V-T diagram represents iisobaric process.
Reason In isobaric process, if V is doubled, then T will also become two times.
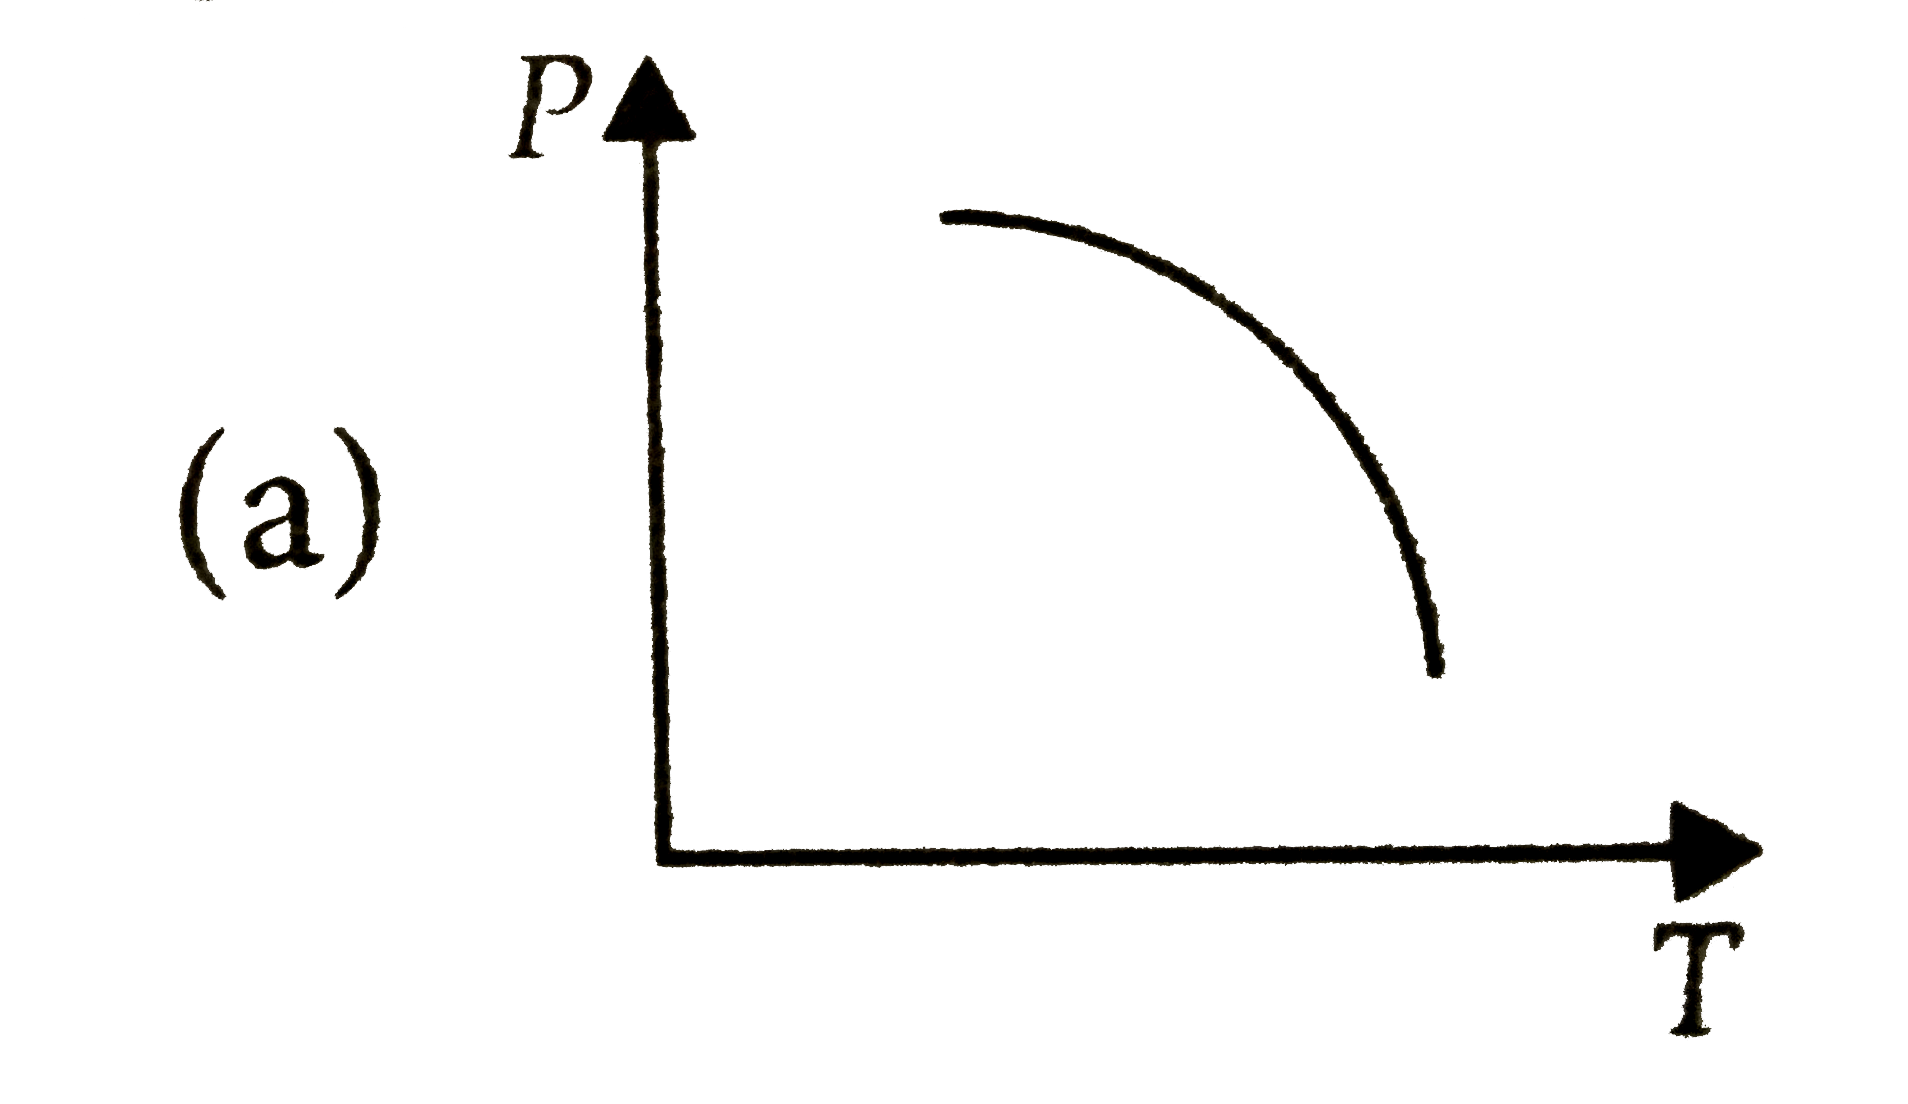
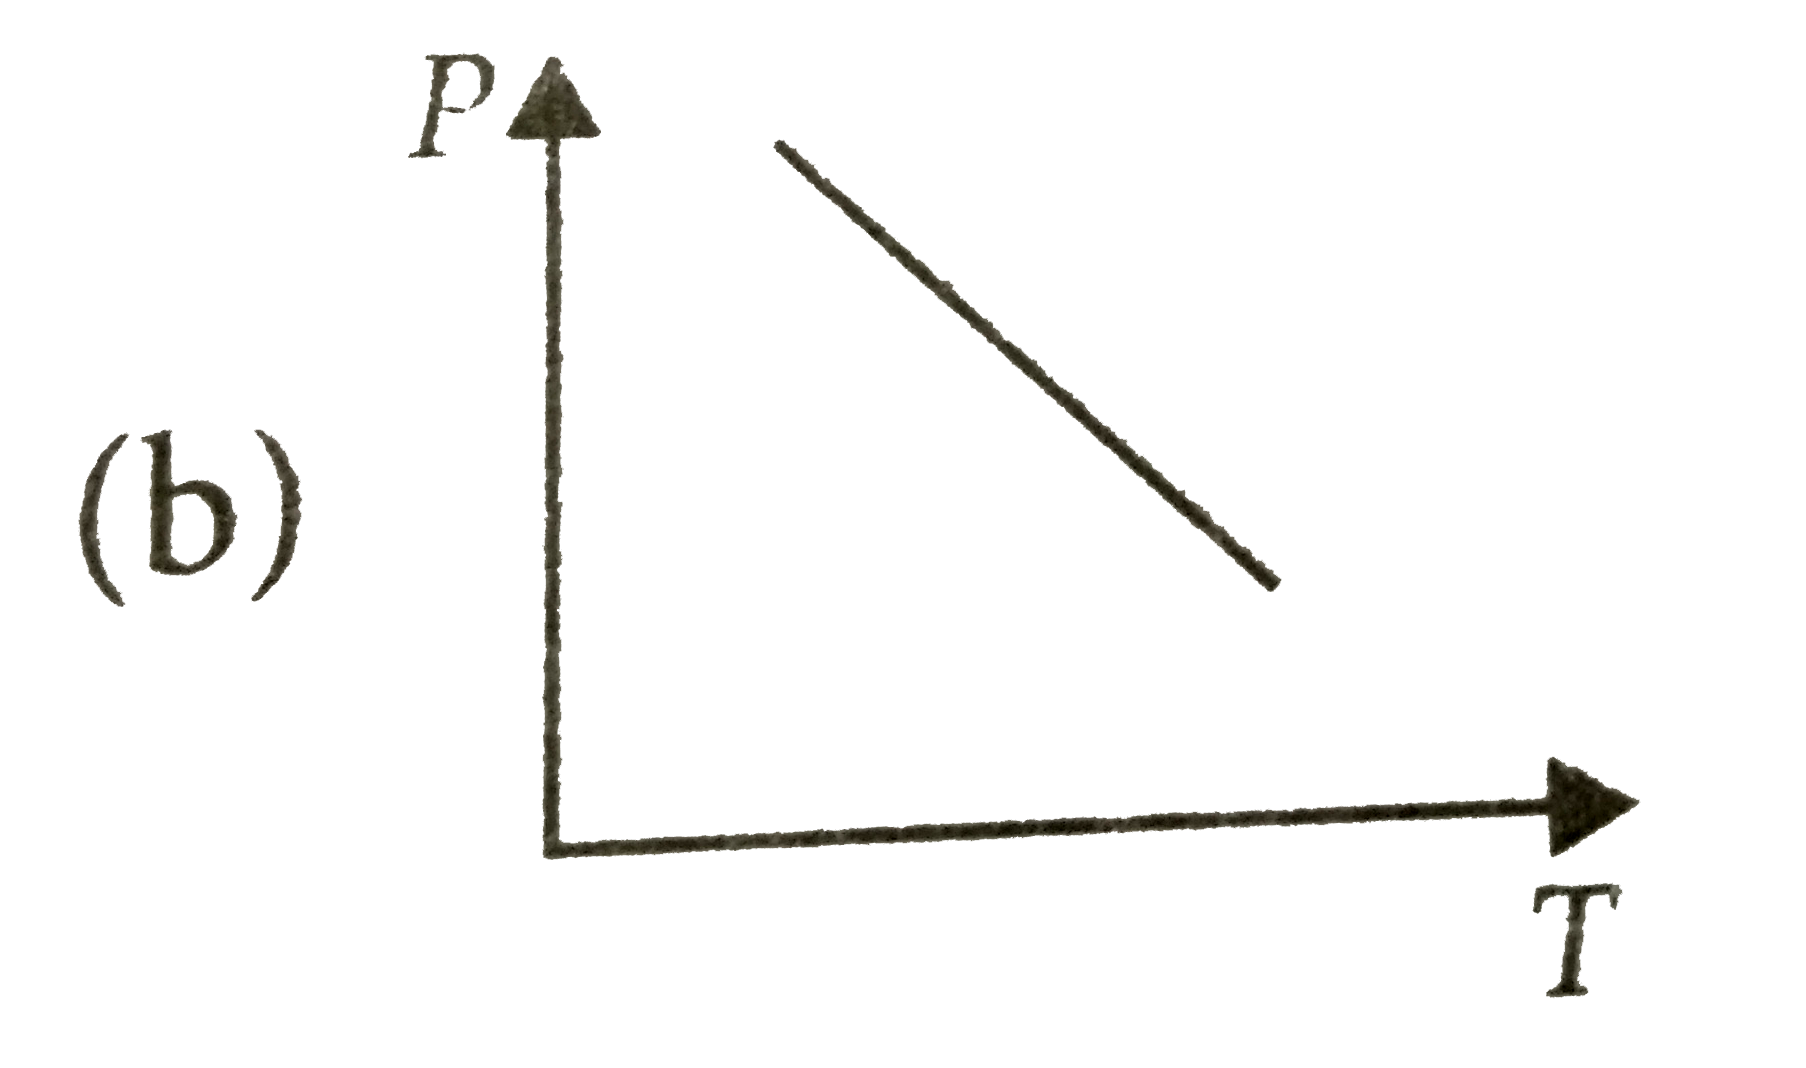
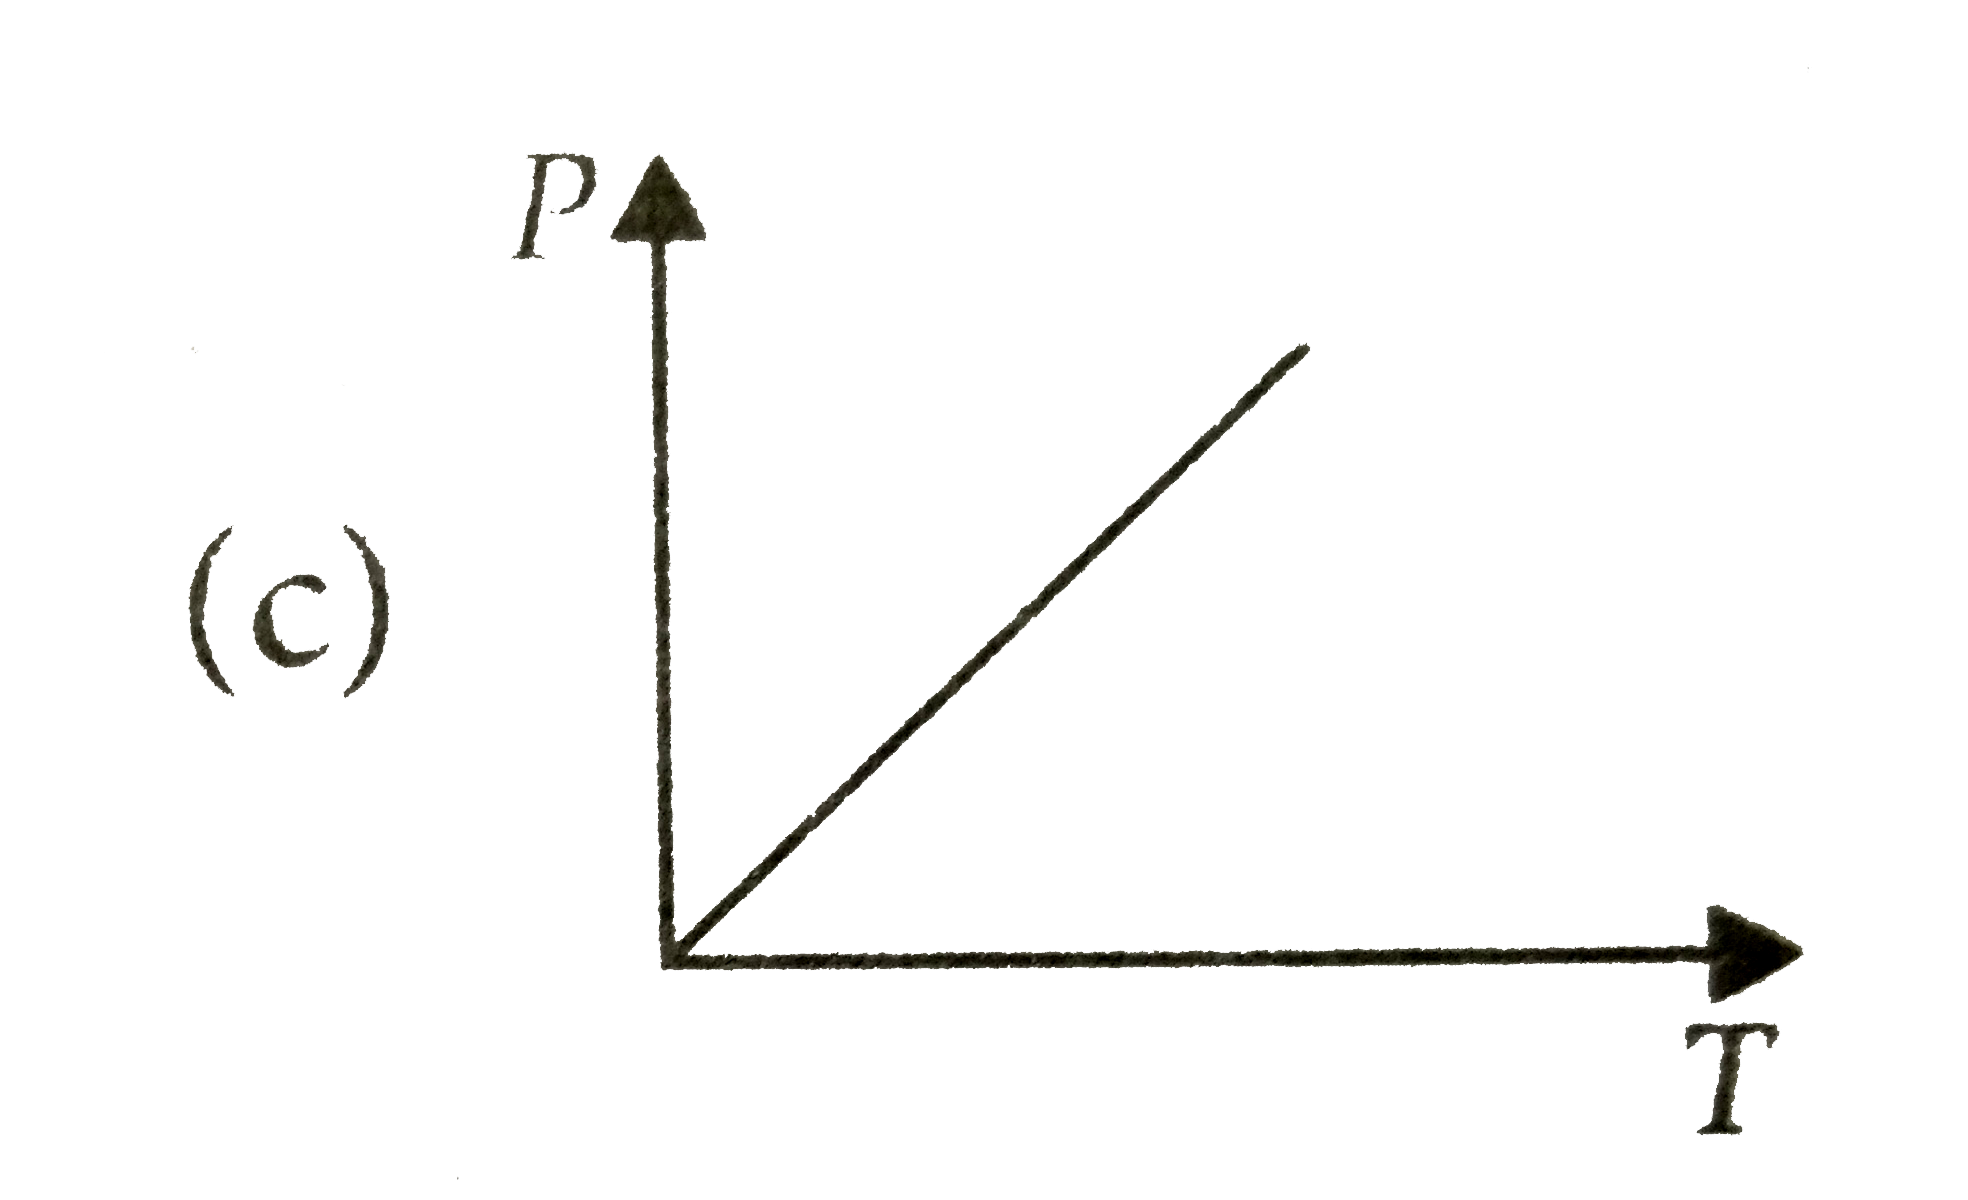
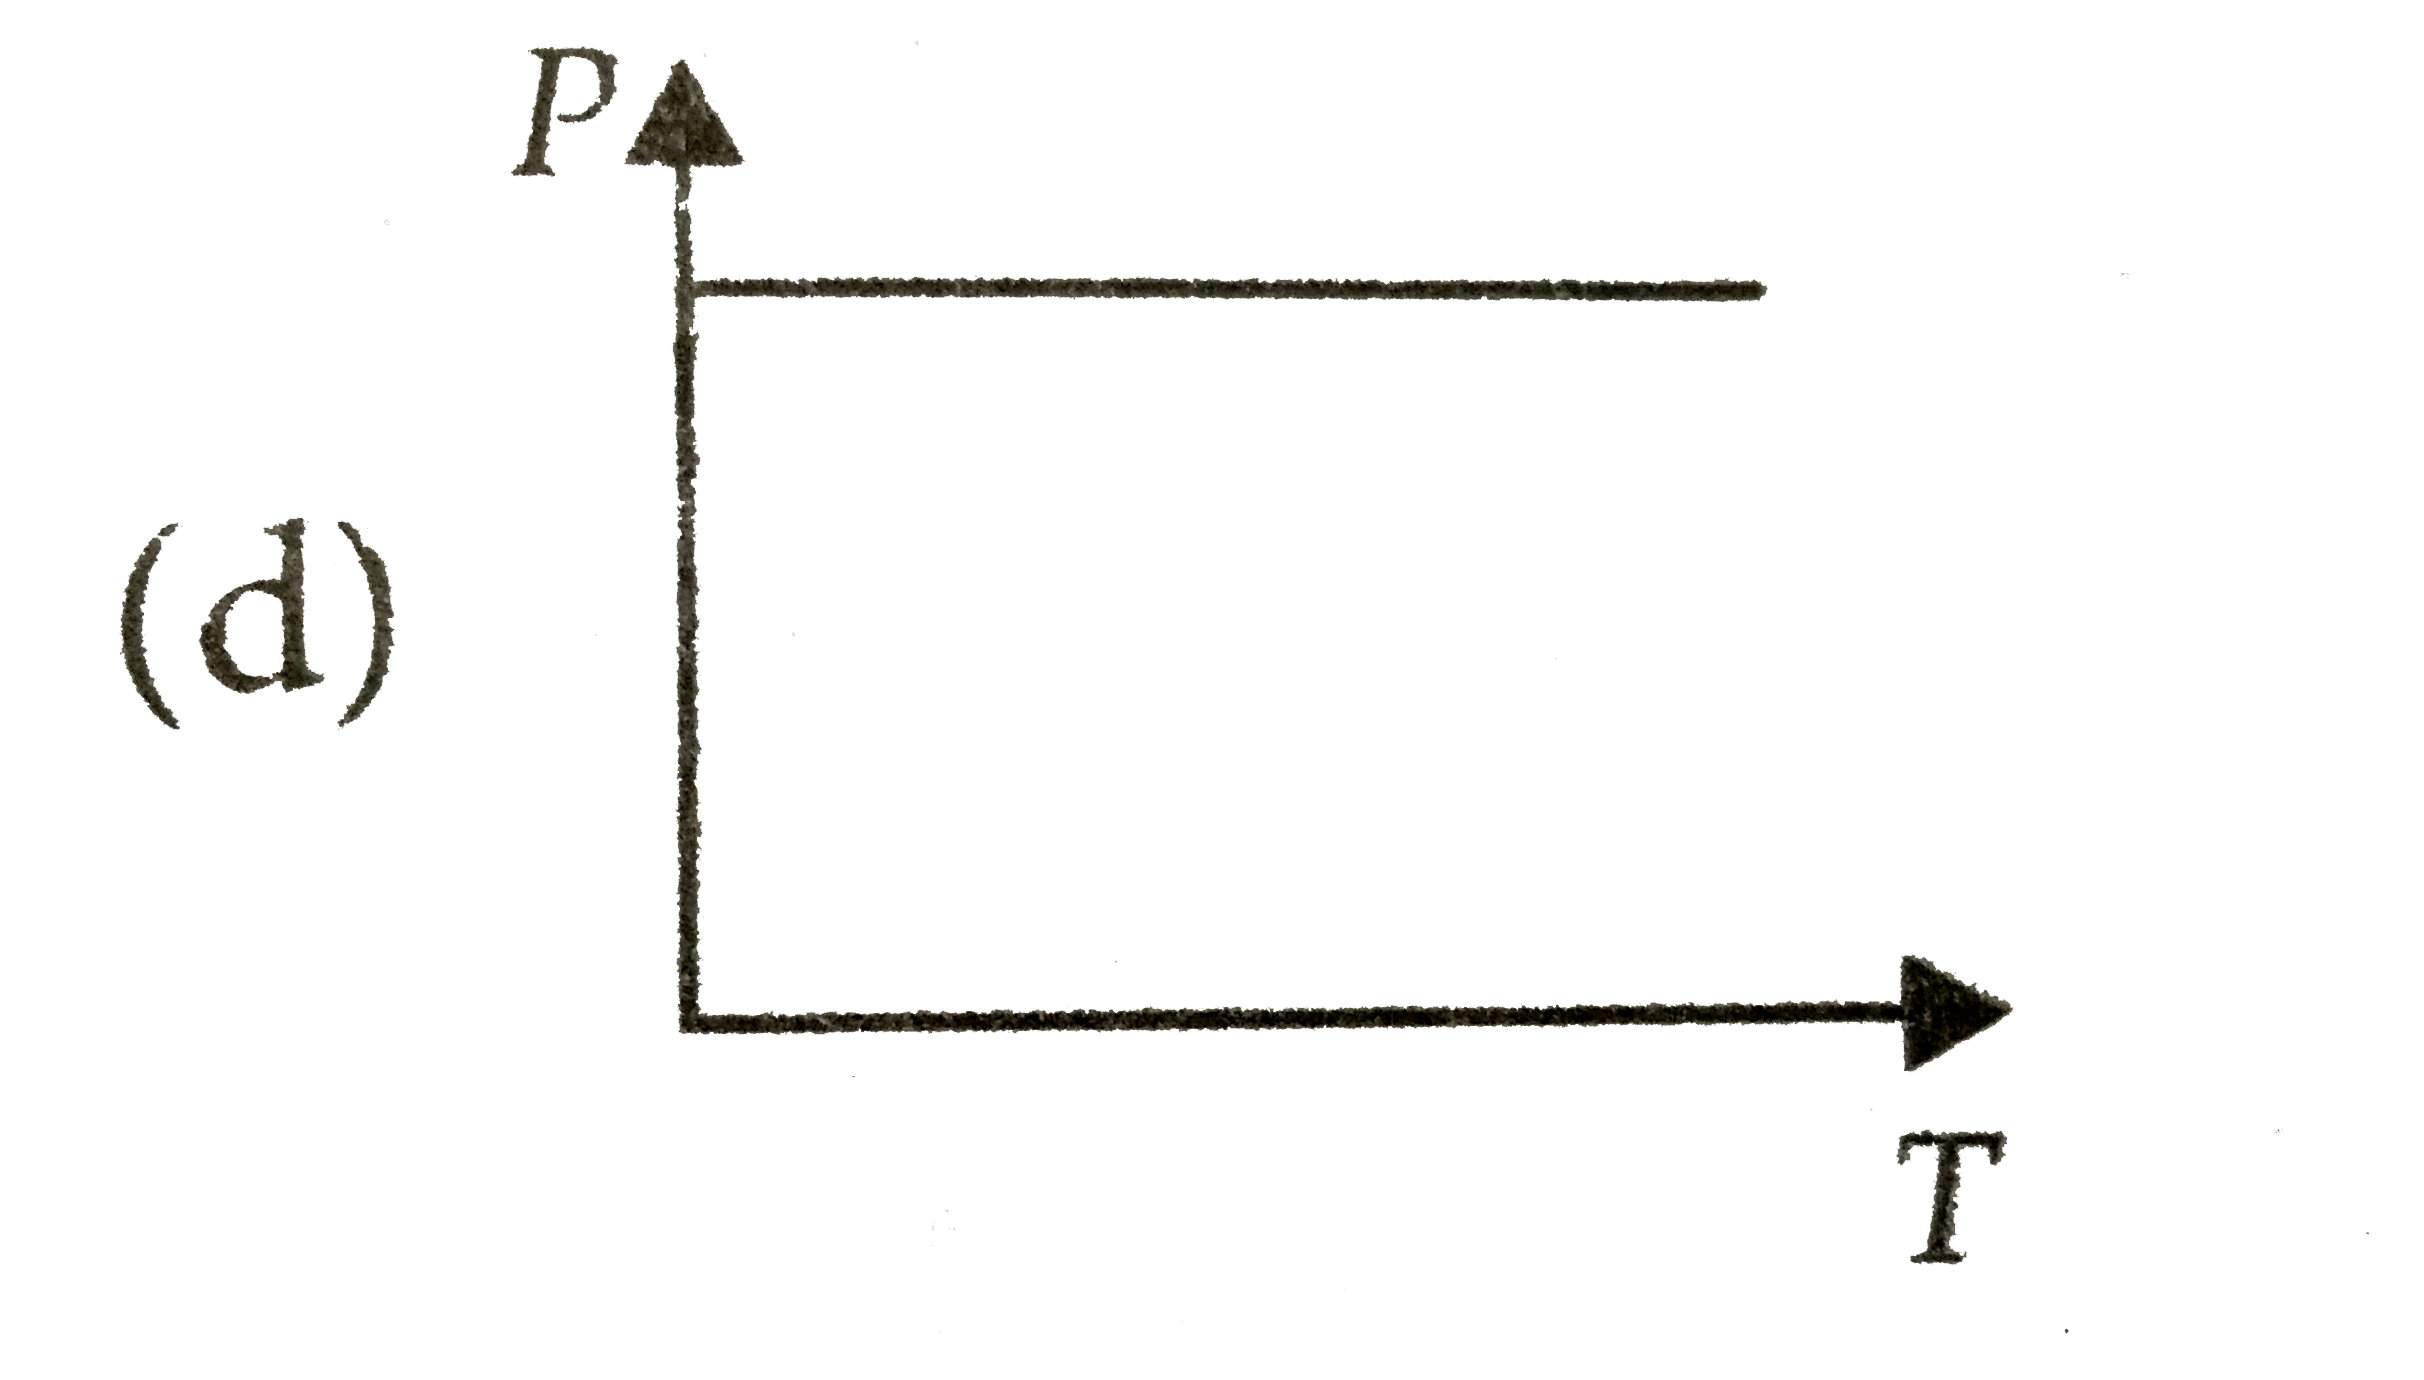
View SolutionDraw at P-T curve for isobaric process.
View SolutionDraw at P-T curve for isobaric process.
View SolutionWhich of the following is a V-T curve for isobaric process?
View SolutionAssertion: P v/s 1V graph is straight line for adiabatic process.
Reason: PV=constant for adiabatic process.
View SolutionAn ideal gas expands from V to 2V in 4 separate processes. Where process 1 is isothermal process 2 is adiabatic, process 3 is free expansion and process 4 is isobaric. If E1,E2,E3 and E4 are the changes in average kinetic energy of the molecules in the isothermal, adiabatic free expansion and isobaric process respectively then choose the correct options.
View Solution
