Two sheets of thickness d and 3d, are touching each other. The temperature just outside the thinner sheet is T1 and on the side of the thicker sheet is T3. The interface temperature is T2.T1,T2andT3 are in arithmetic progression. The ratio of thermal conductivity of thinner sheet to thicker sheet is .
(a) 1:3
(b) 3:1
(c) 2:3
(d) 3:9
The correct Answer is:A
To solve the problem, we need to analyze the thermal conduction through the two sheets and use the information that the temperatures T1, T2, and T3 are in arithmetic progression (AP).
Step 1: Understand the relationship between temperatures
Since T1, T2, and T3 are in arithmetic progression, we can express this relationship mathematically:
T2−T1=T3−T2
This implies:
2T2=T1+T3⇒T2=T1+T32
Step 2: Write the heat transfer equations
The heat transfer through the thinner sheet (thickness d) can be expressed as:
H=T1−T2R1
where R1=dk1A (thermal resistance of the thinner sheet).
For the thicker sheet (thickness 3d):
H=T2−T3R2
where R2=3dk2A (thermal resistance of the thicker sheet).
Step 3: Set the heat transfer equations equal
Since the heat transfer H through both sheets is the same, we can equate the two expressions:
T1−T2dk1A=T2−T33dk2A
Step 4: Simplify the equation
Cancelling A and d from both sides gives:
T1−T21k1=T2−T33k2
Rearranging this, we have:
(T1−T2)⋅k2=3(T2−T3)⋅k1
Step 5: Substitute T2 in terms of T1 and T3
Using the relationship from Step 1, substitute T2:
T1−T1+T32=T1−T32
Thus, we can rewrite the equation:
T1−T32⋅k2=3(T1+T32−T3)⋅k1
This simplifies to:
T1−T32⋅k2=3(T1−T32)⋅k1
Step 6: Solve for the ratio of thermal conductivities
Dividing both sides by T1−T32 (assuming T1≠T3):
k2=3k1
Thus, the ratio of thermal conductivities is:
k1k2=13
This means:
k1k2=13⇒Ratio of k1:k2=1:3
Final Answer
The ratio of thermal conductivity of the thinner sheet to the thicker sheet is 1:3.
---
Since T1, T2, and T3 are in arithmetic progression, we can express this relationship mathematically:
T2−T1=T3−T2
This implies:
2T2=T1+T3⇒T2=T1+T32
The heat transfer through the thinner sheet (thickness d) can be expressed as:
H=T1−T2R1
where R1=dk1A (thermal resistance of the thinner sheet).
H=T2−T3R2
where R2=3dk2A (thermal resistance of the thicker sheet).
Since the heat transfer H through both sheets is the same, we can equate the two expressions:
T1−T2dk1A=T2−T33dk2A
Cancelling A and d from both sides gives:
T1−T21k1=T2−T33k2
Rearranging this, we have:
(T1−T2)⋅k2=3(T2−T3)⋅k1
Using the relationship from Step 1, substitute T2:
T1−T1+T32=T1−T32
Thus, we can rewrite the equation:
T1−T32⋅k2=3(T1+T32−T3)⋅k1
This simplifies to:
T1−T32⋅k2=3(T1−T32)⋅k1
Dividing both sides by T1−T32 (assuming T1≠T3):
k2=3k1
Thus, the ratio of thermal conductivities is:
k1k2=13
This means:
k1k2=13⇒Ratio of k1:k2=1:3
The ratio of thermal conductivity of the thinner sheet to the thicker sheet is 1:3.
Topper's Solved these Questions
- CALORIMETRY & HEAT TRANSFERBOOK - DC PANDEY ENGLISHCHAPTER - CALORIMETRY & HEAT TRANSFEREXERCISE - Level 2 More Than One Correct
5 Videos
- CALORIMETRY & HEAT TRANSFERBOOK - DC PANDEY ENGLISHCHAPTER - CALORIMETRY & HEAT TRANSFEREXERCISE - Level 2 Subjective
14 Videos
- CALORIMETRY & HEAT TRANSFERBOOK - DC PANDEY ENGLISHCHAPTER - CALORIMETRY & HEAT TRANSFEREXERCISE - Level 1 Subjective
13 Videos
- BASIC MATHEMATICSBOOK - DC PANDEY ENGLISHCHAPTER - BASIC MATHEMATICSEXERCISE - Exercise
13 Videos
- CALORIMETRY AND HEAT TRANSFERBOOK - DC PANDEY ENGLISHCHAPTER - CALORIMETRY AND HEAT TRANSFEREXERCISE - Medical entrance s gallery
38 Videos
Similar Questions
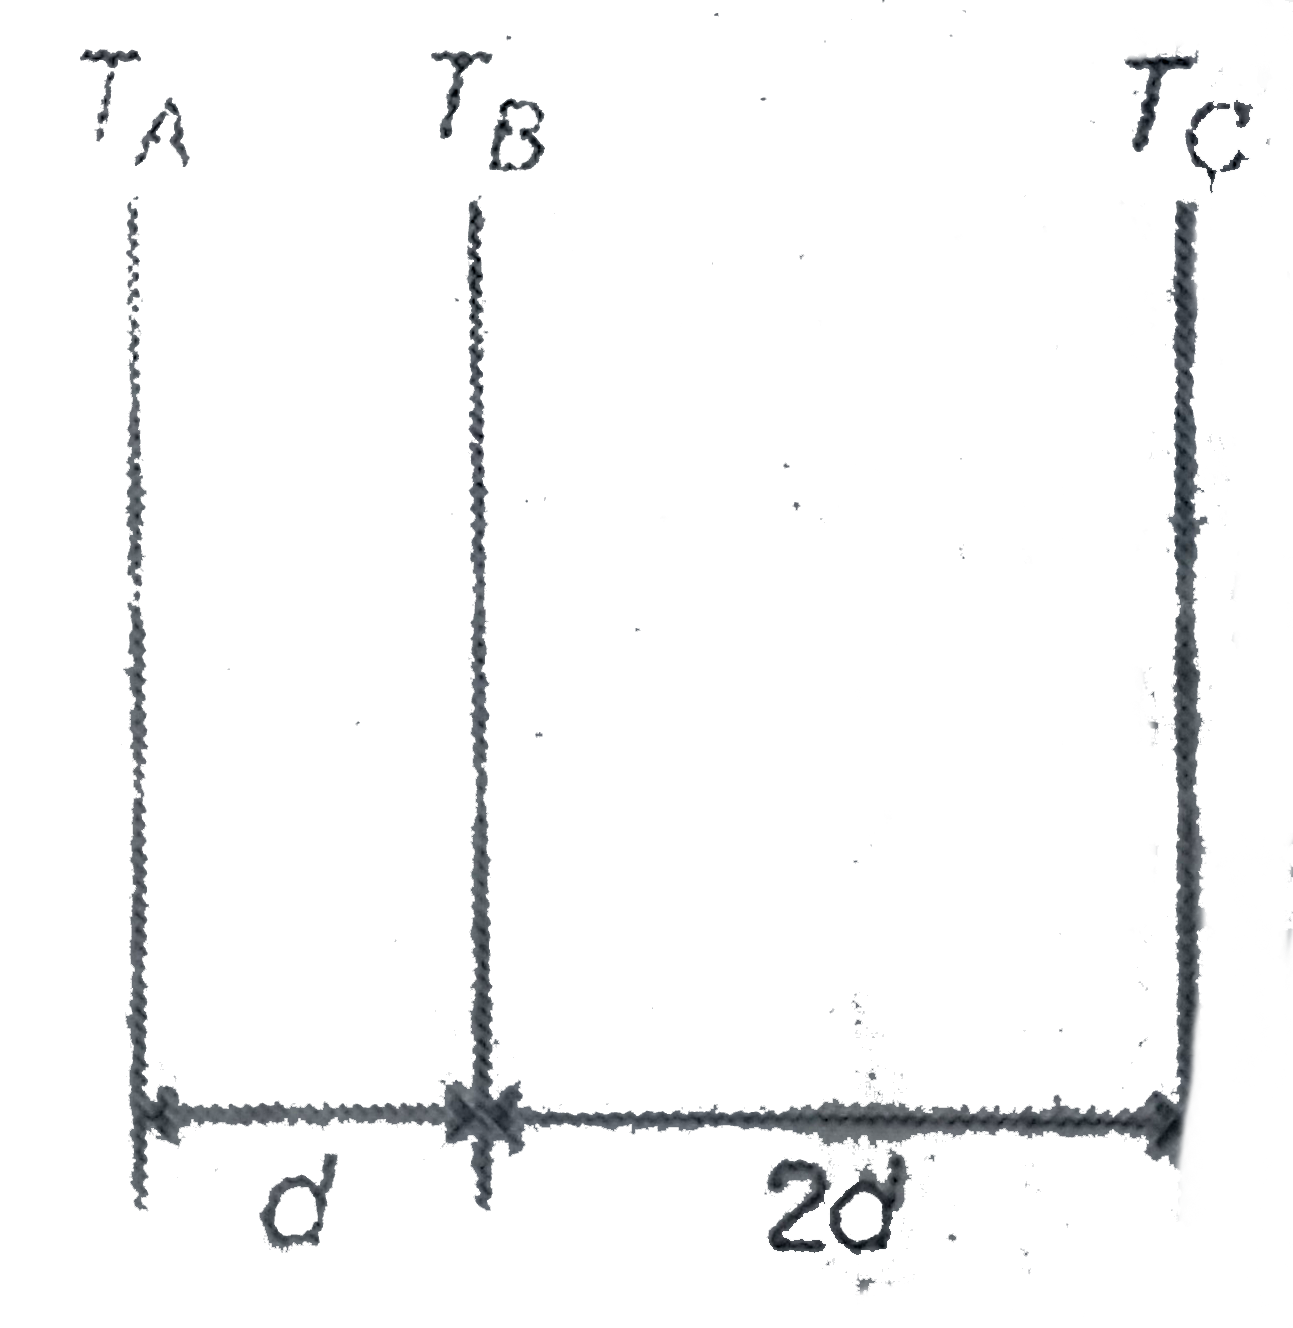
Two sheets of thickness d and 2d and same area are touching each other on their face. Temperature TA,TB,TC shown are in geometric progression with common ratio r = 2. Then ratio of thermal conductivity of thinner and thicker sheet are
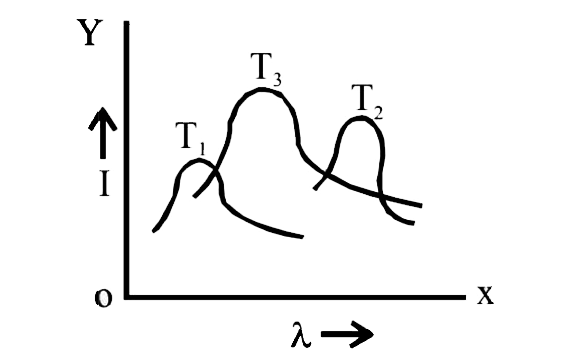
View SolutionThe plots of intensity versus wavelength for three black bodies at temperature T1,T2andT3 respectively are as shown. Their temperatures are such that
View Solution
Knowledge Check
The isothermal diagram of a gas at three different temperatures T1,T2andT3, is show in the given figure .Then
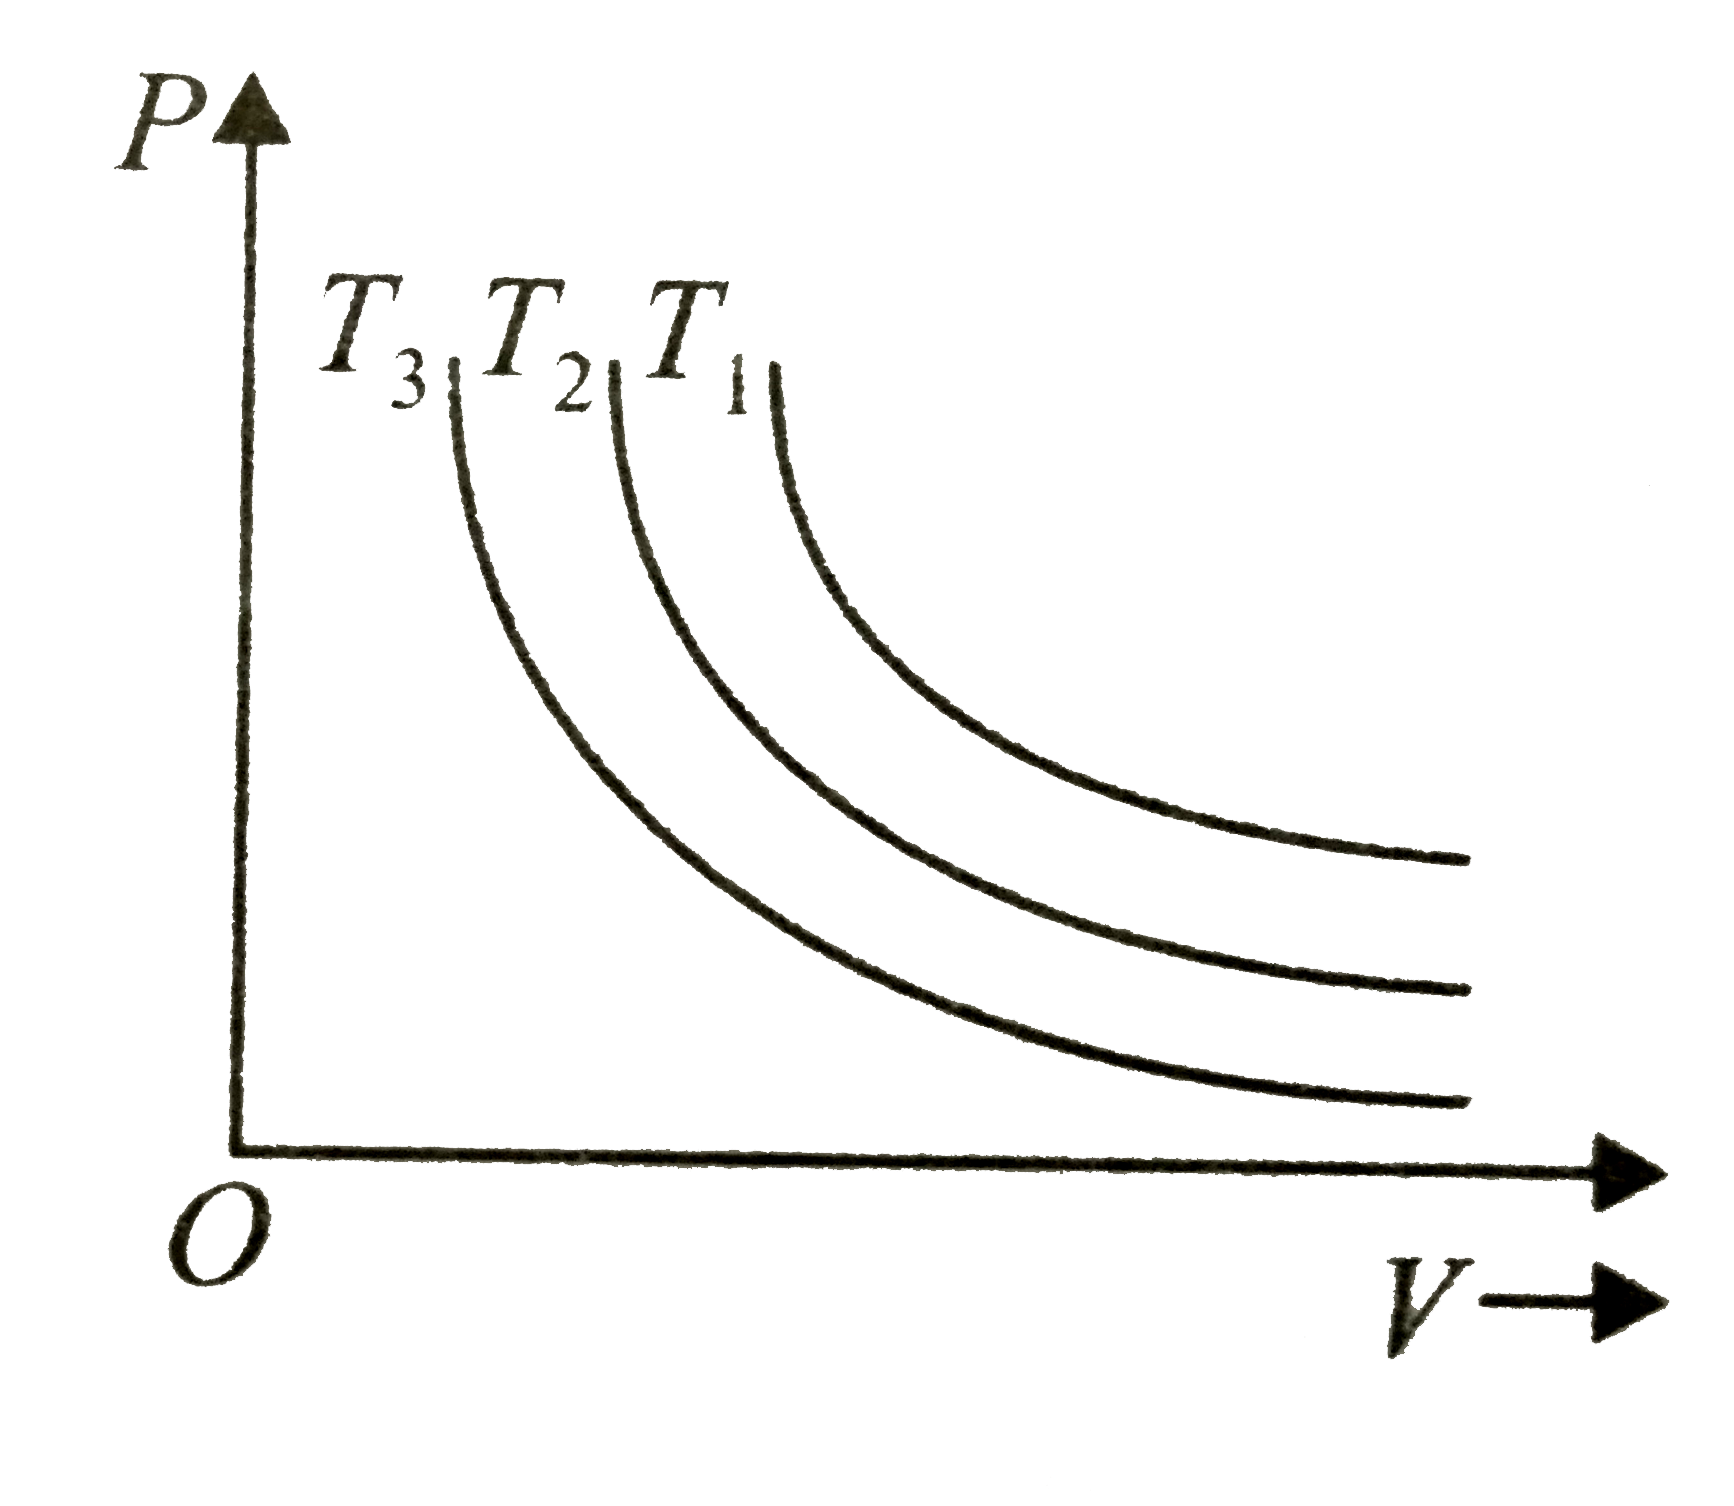 Aa.T1<T2<TBb. T1<T2>T3Cc.T1>T2>T3Dd.T1>T2<T3
Find the indicated terms in each of the following arithmetic progression a=3,d=2,tn,t10
View Solution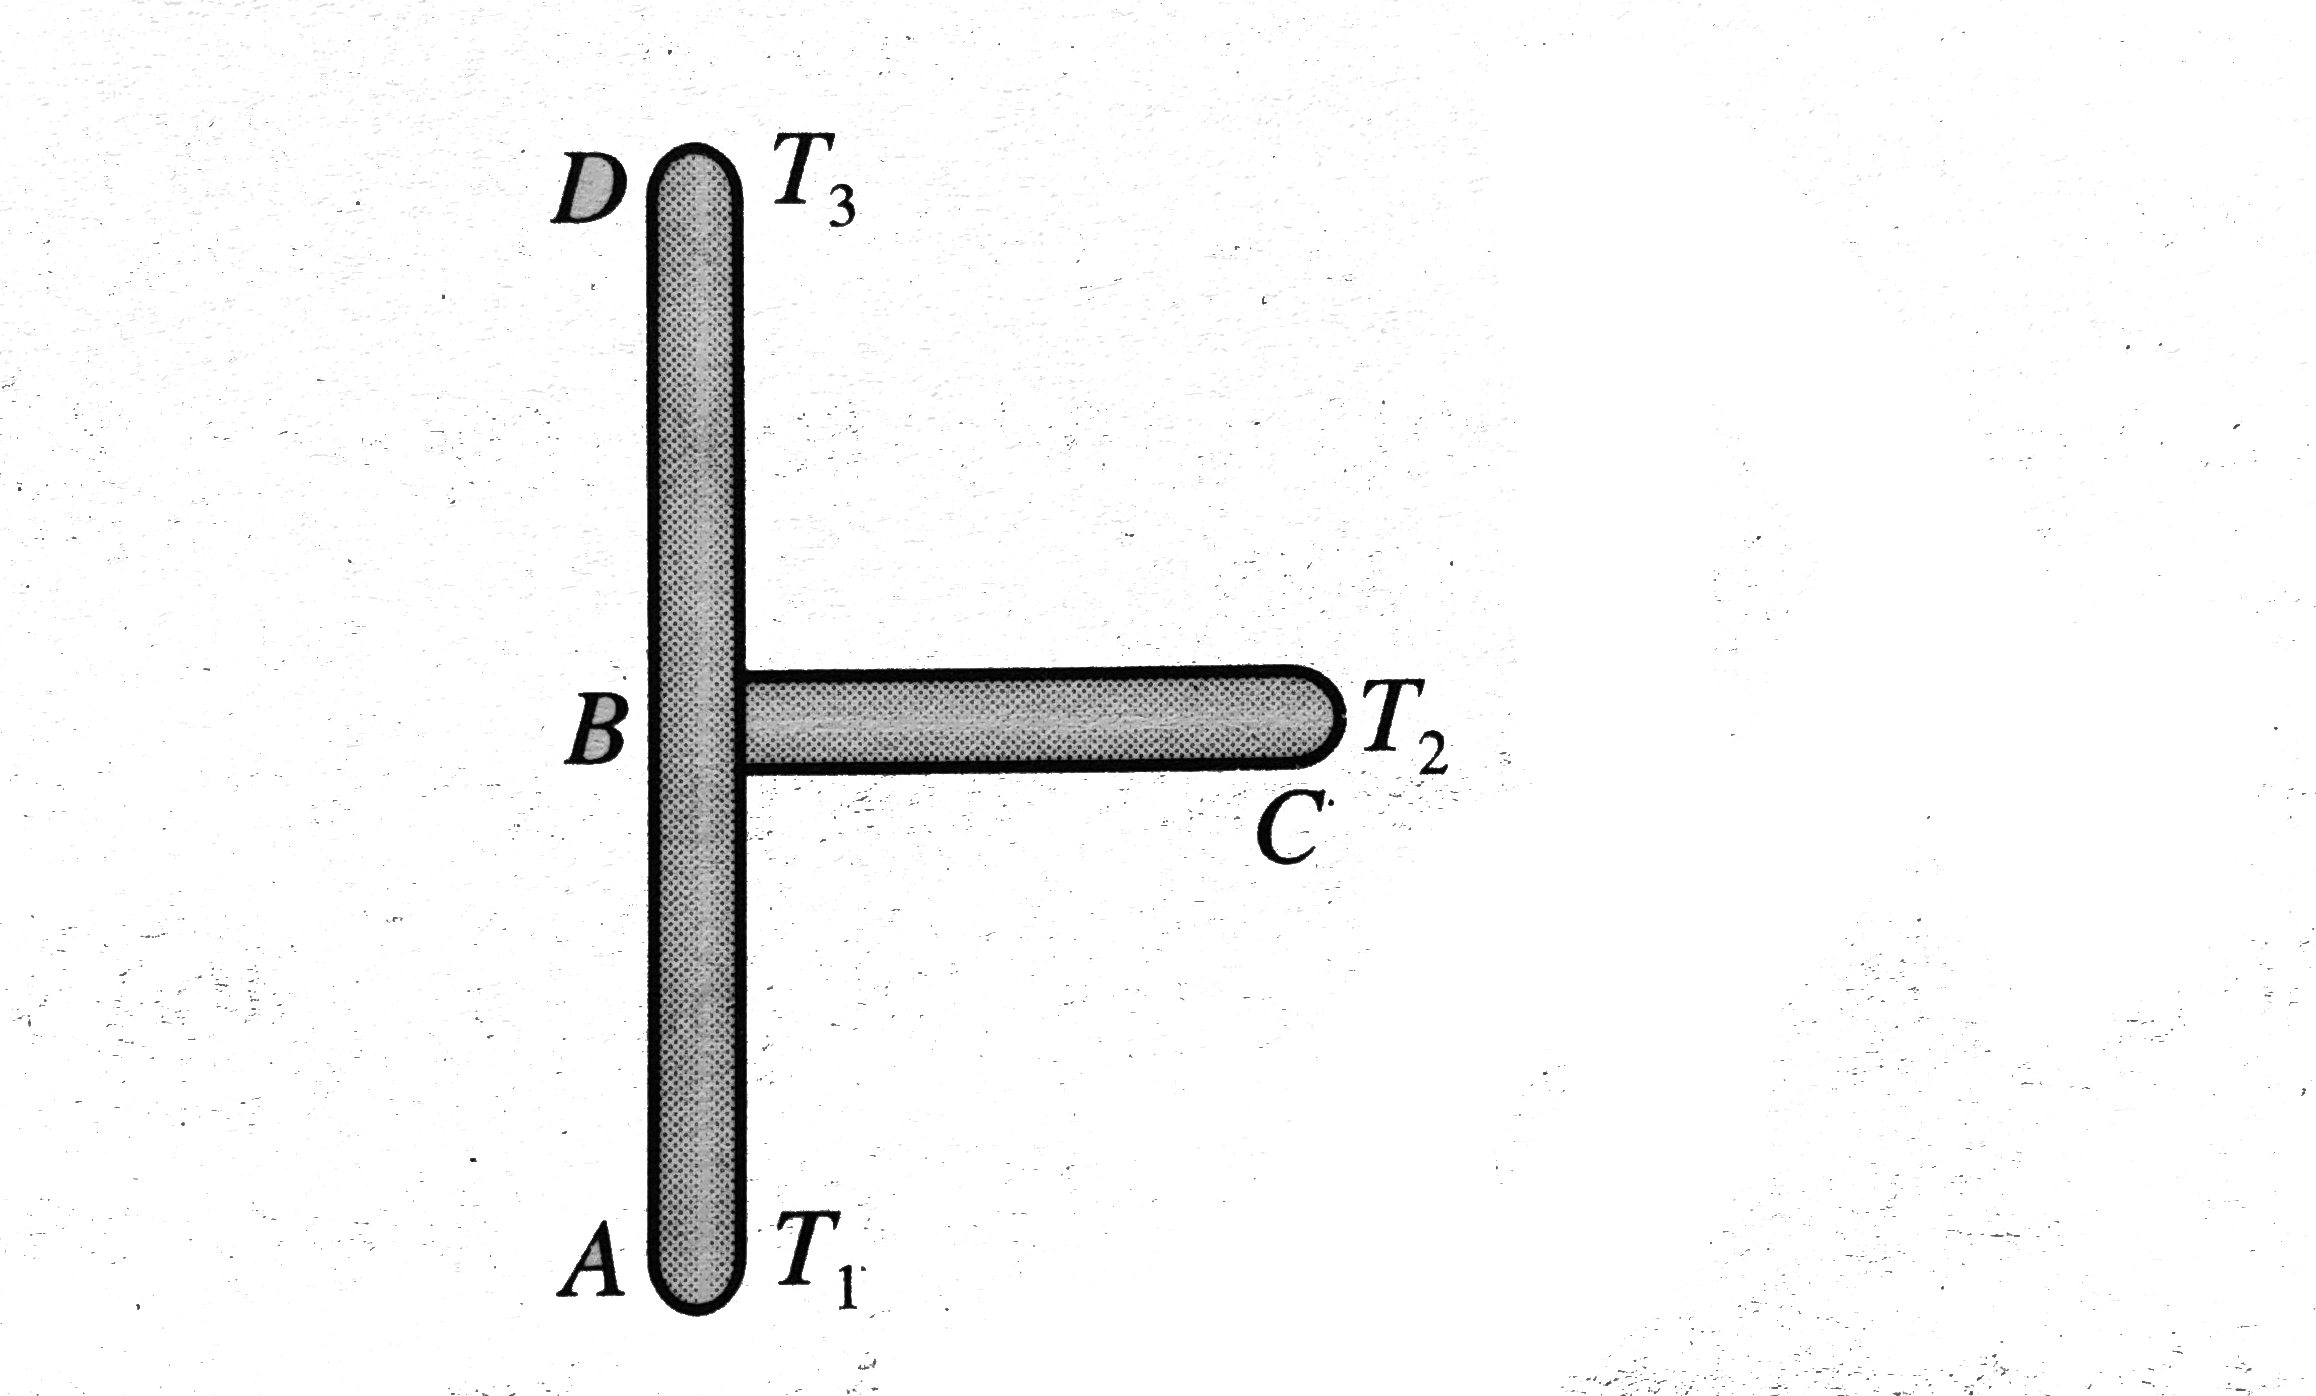
Three rods AB, BC and BD having thermal conductivities in the ratio 1:2:3 and lengths in the ratio 2:1:1 are joined as shown in Fig. The ends A, C and D are at temperature T1,T2 and T3 respectively Find the temperature of the junction B. Assume steady state.
View SolutionTwo bodies of different temperatures T1andT2 if brought in thermal contact, do not necessarily settle to the mean temperature (T1+T2)/2. Why?
View SolutionThe current - voltage graphs for a given metallic wire at two different temperatures T1andT2 are shown in the figure.
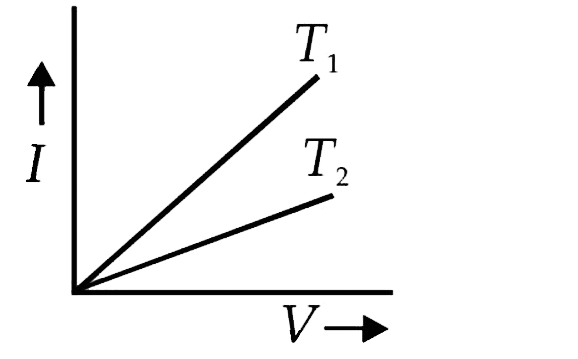
The temperature T2 is greater than T1.
View SolutionThe current - voltage graphs for a given metallic wire at two different temperatures T1andT2 are shown in the figure.

The temperature T2 is greater than T1.
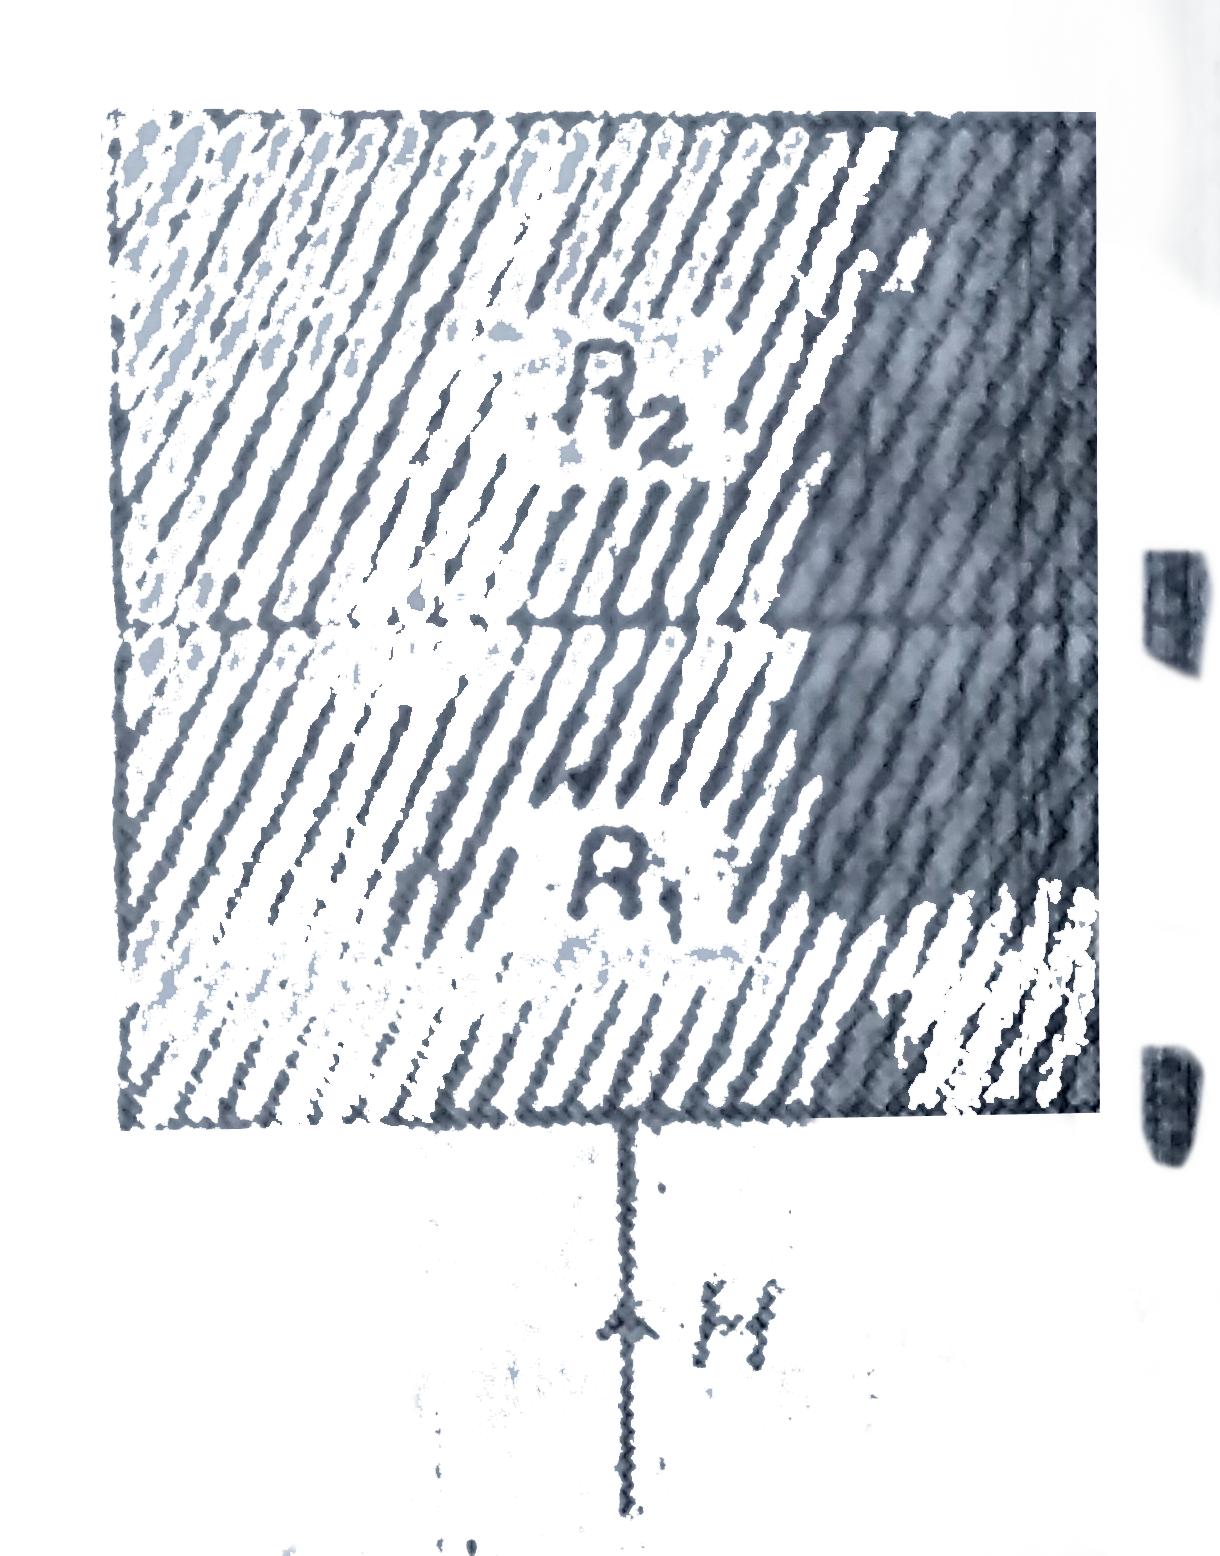
View SolutionConsider the two insulating sheets with thermal resistance R1 and R2 as shown in figure. The temperature θ is
View SolutionIf the solution boils at a temperature T1 and solvent at a temperature T2 the elevation of boiling point is given by:
View Solution
