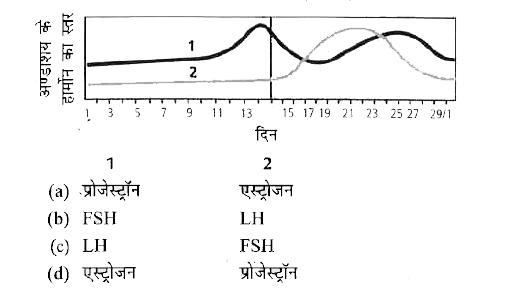
The graph given below shows the variations in the levels of ovarian hormones during various phases of menstrual cycle:
Specify the source of the hormone marked in the diagram.
 Solution in Punjabi
Step by step video & image solution for The graph given below shows the variations in the levels of ovarian hormones during various phases of menstrual cycle: Specify the source of the hormone marked in the diagram. by Biology experts to help you in doubts & scoring excellent marks in Class 12 exams.
Updated on:21/07/2023Topper's Solved these Questions
Similar Questions
the unique event of flowering plant is-
View SolutionA disease caused by an autosomal primary non-disjunction is.
View SolutionThe following graph shows the levels of ovarian hormones during a menstrual cycle. What do 1 and 2 represent?
View SolutionWhich hormone level reaches peak during luteal phase of menstrual cycle?
View SolutionExplain the different phases of menstrual cycle and correlate the phases with the different levels, of ovarian hormones in a human female.
View SolutionWhich hormone level reaches peak during luteal phase of menstrual cycle?
View SolutionExplain the different phases of menstrual cycle and correlate the phases with the different levels, of ovarian hormones in a human female.
View SolutionExplain the different phases of menstrual cycle and correlate the phases with the different levels, of ovarian hormones in a human female.
View Solution
The following graph shows the levels of ovarian hormones during a menstrual cycle. What do 1 and 2 represent?
View Solutionनीचे दिया गया ग्राफ ऋतु स्राव चक्र के दौरान ओवेरीयन हार्मोन्स के स्तर को दर्शाता है। 1 व 2 क्या दर्शाते हैं?

View SolutionThe graph given below shows the variations in the levels of ovarian hormones during various phases of menstrual cycle: Identify A and B .
View SolutionThe graph given below shows the variations in the levels of ovarian hormones during various phases of menstrual cycle:
Reason out why A peaks before B.

View SolutionThe graph given below shows the variations in the levels of ovarian hormones during various phases of menstrual cycle: Compare the role of A and B .
View SolutionThe graph given below shows the variations in the levels of ovarian hormones during various phases of menstrual cycle: Under which condition will the level of B continue to remain high on the 28^th day?
View SolutionThe graph shows the level of ovarian hormones in a normally menstruating women during follicular phase. Reconstruct the hormonal graph for luteal phase. .
View Solution
