Show that area under P-V graph gives the amount of work done.Solution in Odia
Step by step video & image solution for Show that area under P-V graph gives the amount of work done. by Physics experts to help you in doubts & scoring excellent marks in Class 12 exams.
Updated on:21/07/2023Topper's Solved these Questions
Similar Questions
A glass window pane 1 m by 1 m is 25 mm thick. If the show outside maintains the outer surface at 0∘C and the heat of the room maintains the inner surface at 6∘C ,Thermal conductivity of glass in S.I unit is 0.2, how much heat will be conducted through the glass in 1 day ?
View SolutionFind out the magnitude of the orthogonal components of a displacement vector in space .
View SolutionAssertion: Area under velocity-time graph give displacement. Reason: Area under acceleration-time graph give velocity.
View SolutionThe figure shows P - V diagram of a thermodynamic cycle
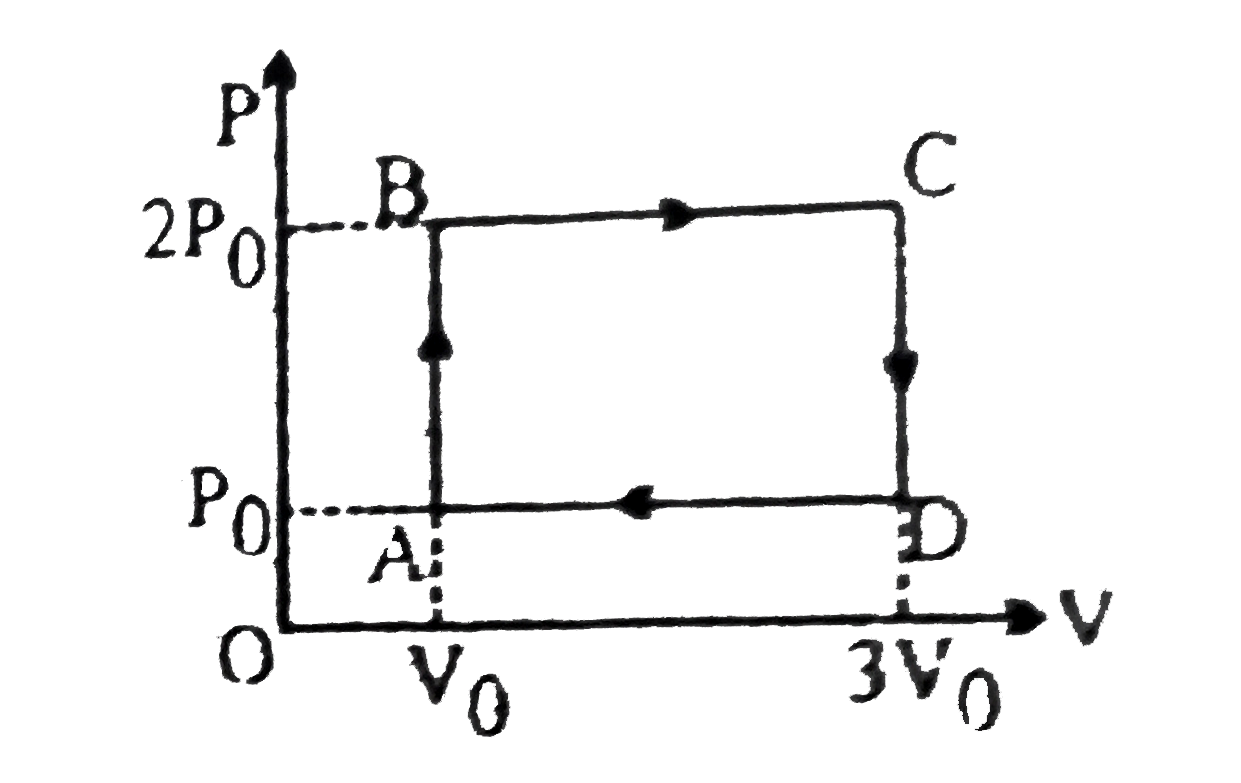
The work done in the cycle is
View SolutionThe area under the acceleration-time (a-t) graph gives
View SolutionAs area under P-V diagram represent work done by gas in a thermodynamic process, area under temperature (T) entropy (S) graph represents heat supplied to the thermodynamic system. Consider the following graph
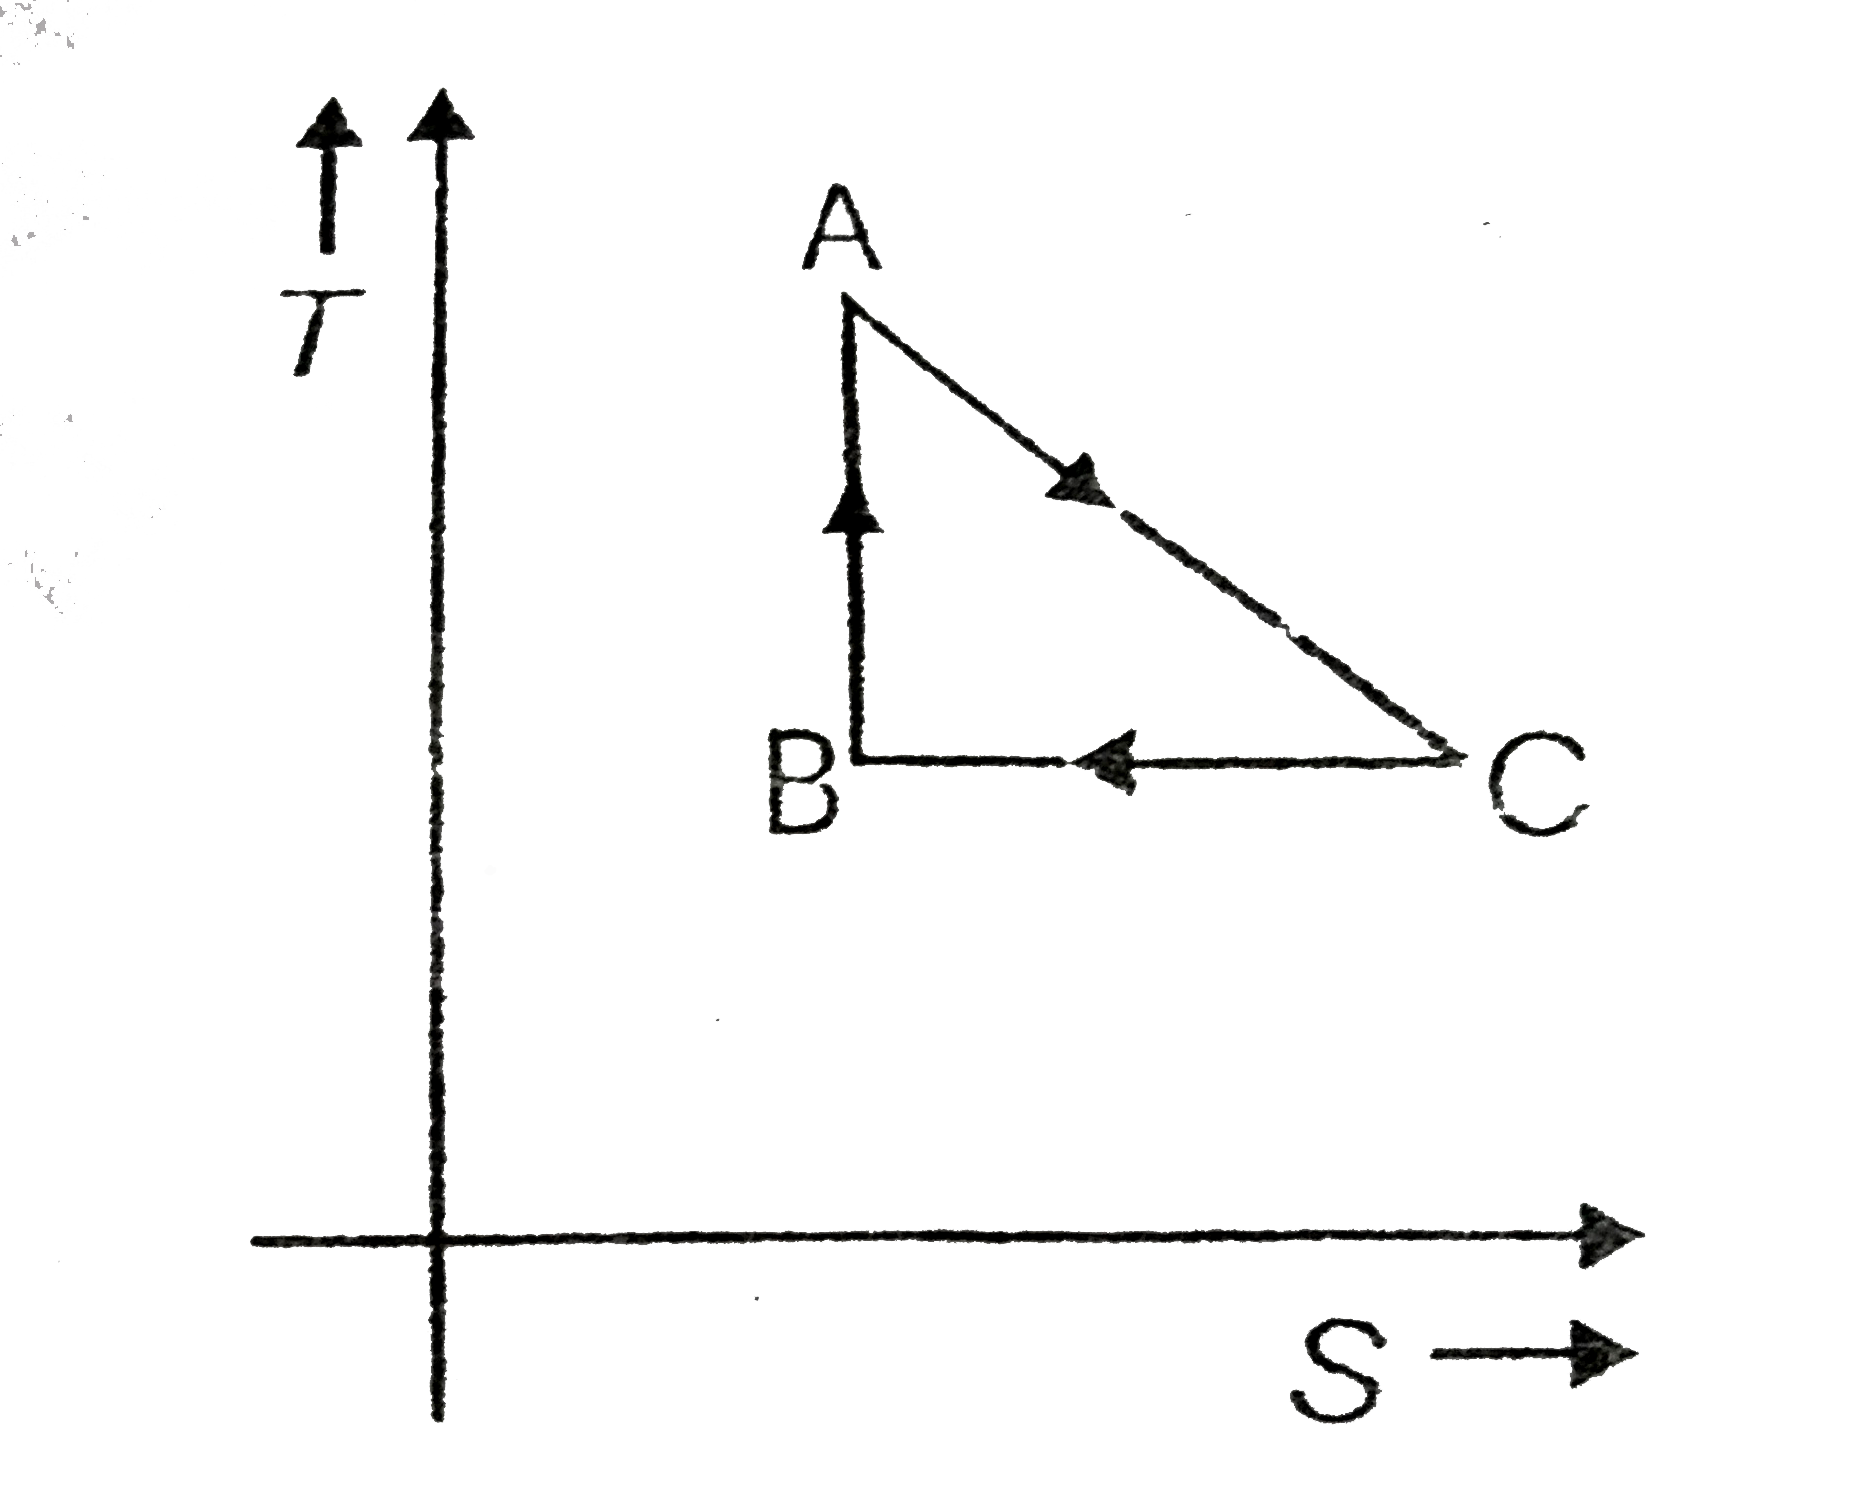
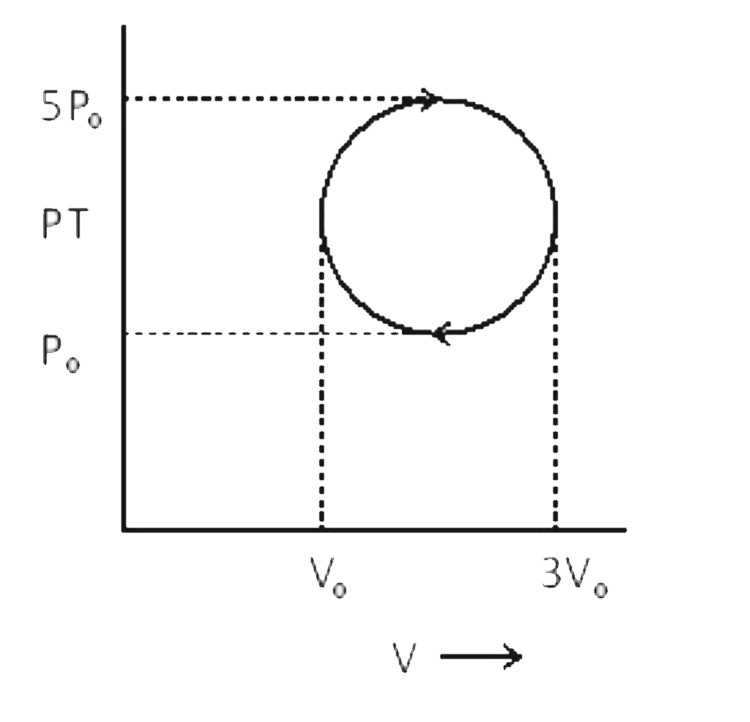
View SolutionThe diagram shows a P - V graph of a thermodynamic behaviour of an ideal gas. Find out from this graph.
Work done in complete cycle A→B→C→D→A.
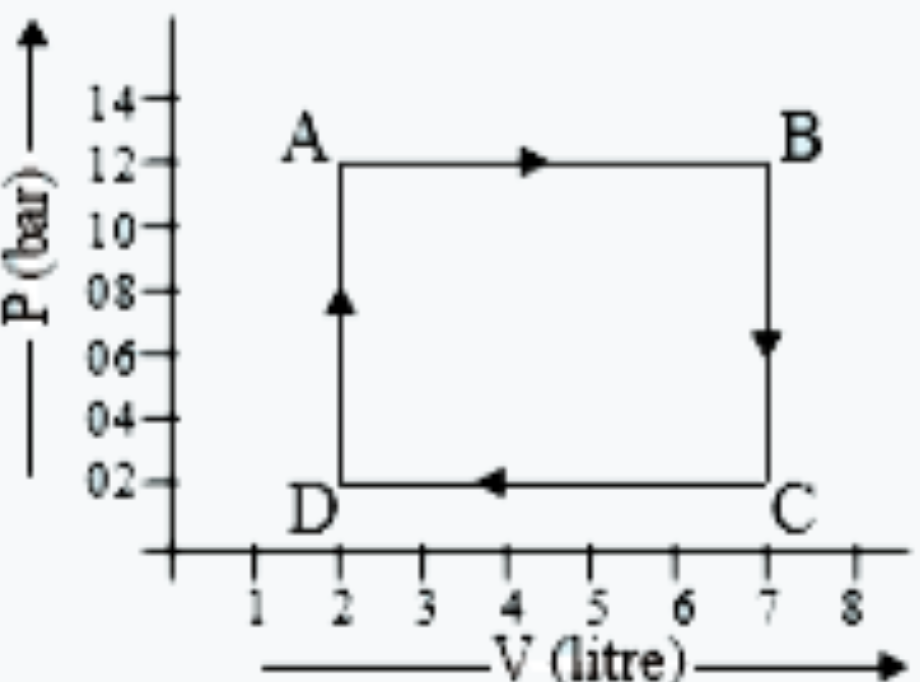
View SolutionP – V graph for a cyclic process is shown in figure . Work done is given by
View SolutionThe area under velocity - time graph represents the _____
View SolutionArea under power-time curve gives total work done
View SolutionWhat is non-cyclic process? Show that the area under the P-V diagram gives the work done by a system in a non-cyclic process.
View Solutionएक आदर्श गैस दिये गये P -V ग्राफ में दर्शाए गए अनुसार चक्रीय प्रक्रम ABCDA से होकर गुजरती है। गैस द्वारा किये गये कार्य की मात्रा क्या है?
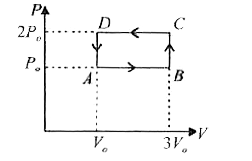
View SolutionVerify that the area under the p-V curve has dimensions of work.
View SolutionArea under a velocity-time graph gives
View SolutionAs area under P-V diagram represent work done by gas in a thermodynamic process, area under temperature (T) entropy (S) graph represents heat supplied to the thermodynamic system. Consider the following graph
View Solution

