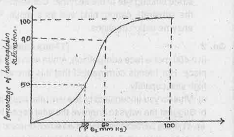
The graph given below is oxygen-haemoglobin dis sociation curve. Observe the graph and answer the following questions.  Identify the PO, where 90% haemoglobin satura tion occurs.Solution in Malayalam
Step by step video & image solution for The graph given below is oxygen-haemoglobin dis sociation curve. Observe the graph and answer the following questions. Identify the PO, where 90% haemoglobin satura tion occurs. by Biology experts to help you in doubts & scoring excellent marks in Class 11 exams.
Updated on:21/07/2023Topper's Solved these Questions
Similar Questions
Name the double walled membrane of human heart. (Cuticle, Pleura, Pericardium, Sarcolemma)
View SolutionWhich organelle is not a part of endomembrane system ?
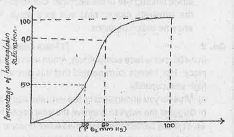
View SolutionThe given graph shows an oxygen dissociation curve for haemoglobin. Wher is the body will haemoglobin be saturated at the percentage shown at point 1,2 and 3 in graph ?
View SolutionGiven below graphs an oxygen dissociation curve :- Where in the body will haemoglobin be saturation at the percentage shown at points X,Y and Z.
View SolutionOxygen dissociation curve of haemoglobin is
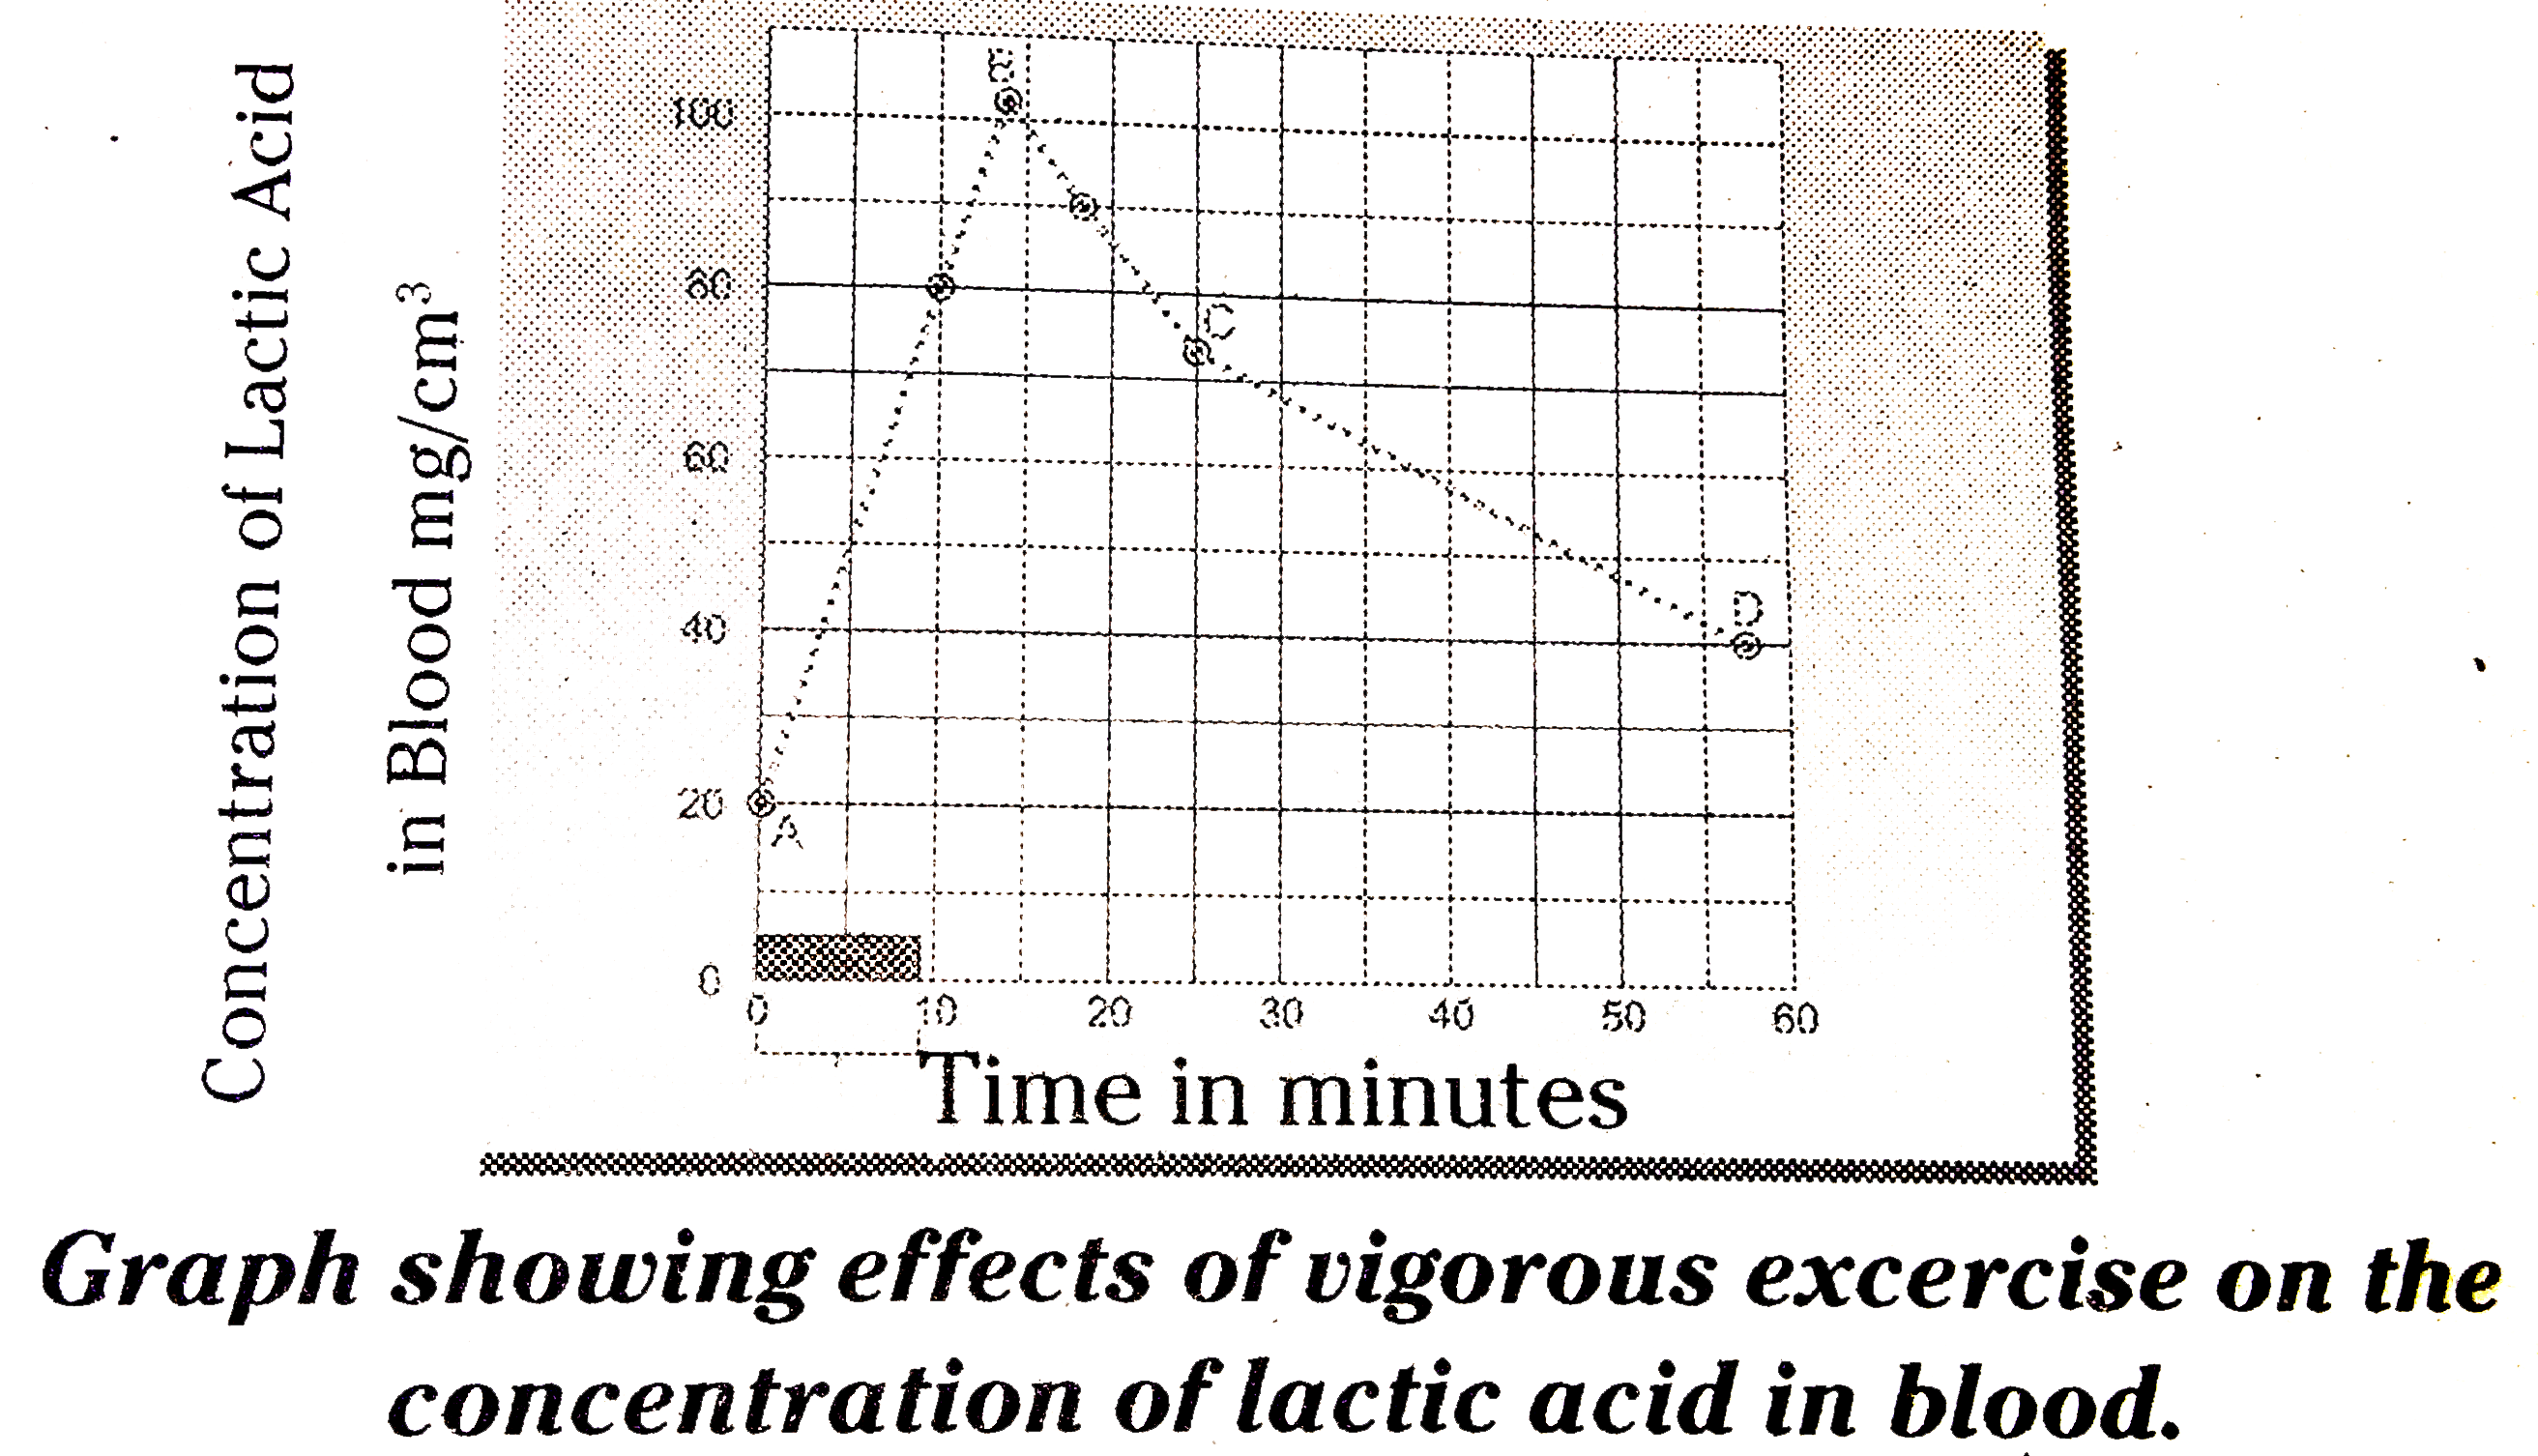
View SolutionObserve the following graph and answer the questions given below .

Why oxygen deficit in muscles of running Athlet ?
View SolutionObserve the following graph and answer the questions given below . What are the consequences of oxygen deficit ?
View SolutionThe given graph shows an oxygen dissociation curve for haemoglobin. Wher is the body will haemoglobin be saturated at the percentage shown at point 1,2 and 3 in graph ?
View SolutionThe graph given below is oxygen-haemoglobin dis sociation curve. Observe the graph and answer the following questions.
 Write any three factors favorable for the formation of oxyhaemoglobin in alveoli.
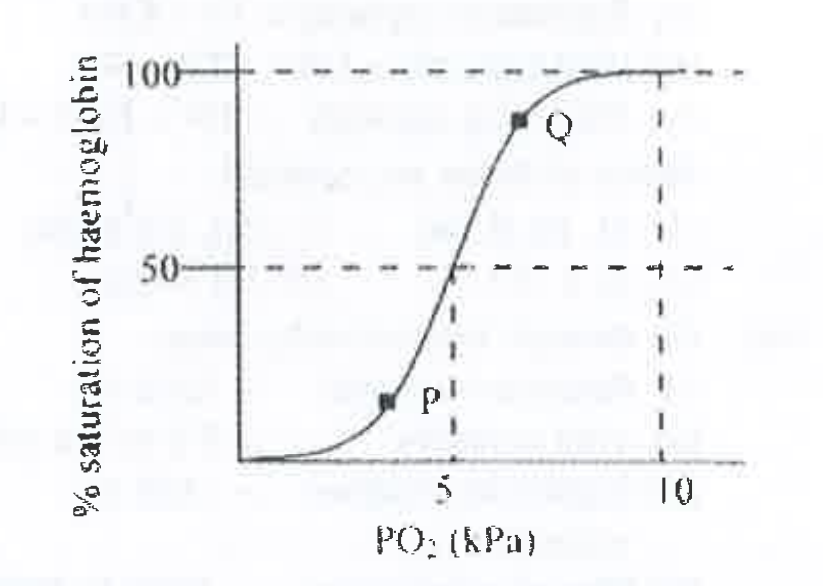
View SolutionOxygen saturation curve of haemoglobin molecule is show in the graph

The correct representation of haemoglobin molecule at points p and q is respectively
View SolutionOxygen dissociation curve of haemoglobin is
View SolutionPopulation growth curves (two types are given: observe the following graph answer the following questions.) Identify the curves a & b.
View SolutionOxygen-haemoglobin dissociation curve is
View SolutionOxygen saturation curve of haemoglobin molecule is show in the graph The correct representation of haemoglobin molecule at points p and q is respectively
View SolutionOxygen dissociation curve of haemoglobin is
View Solution

