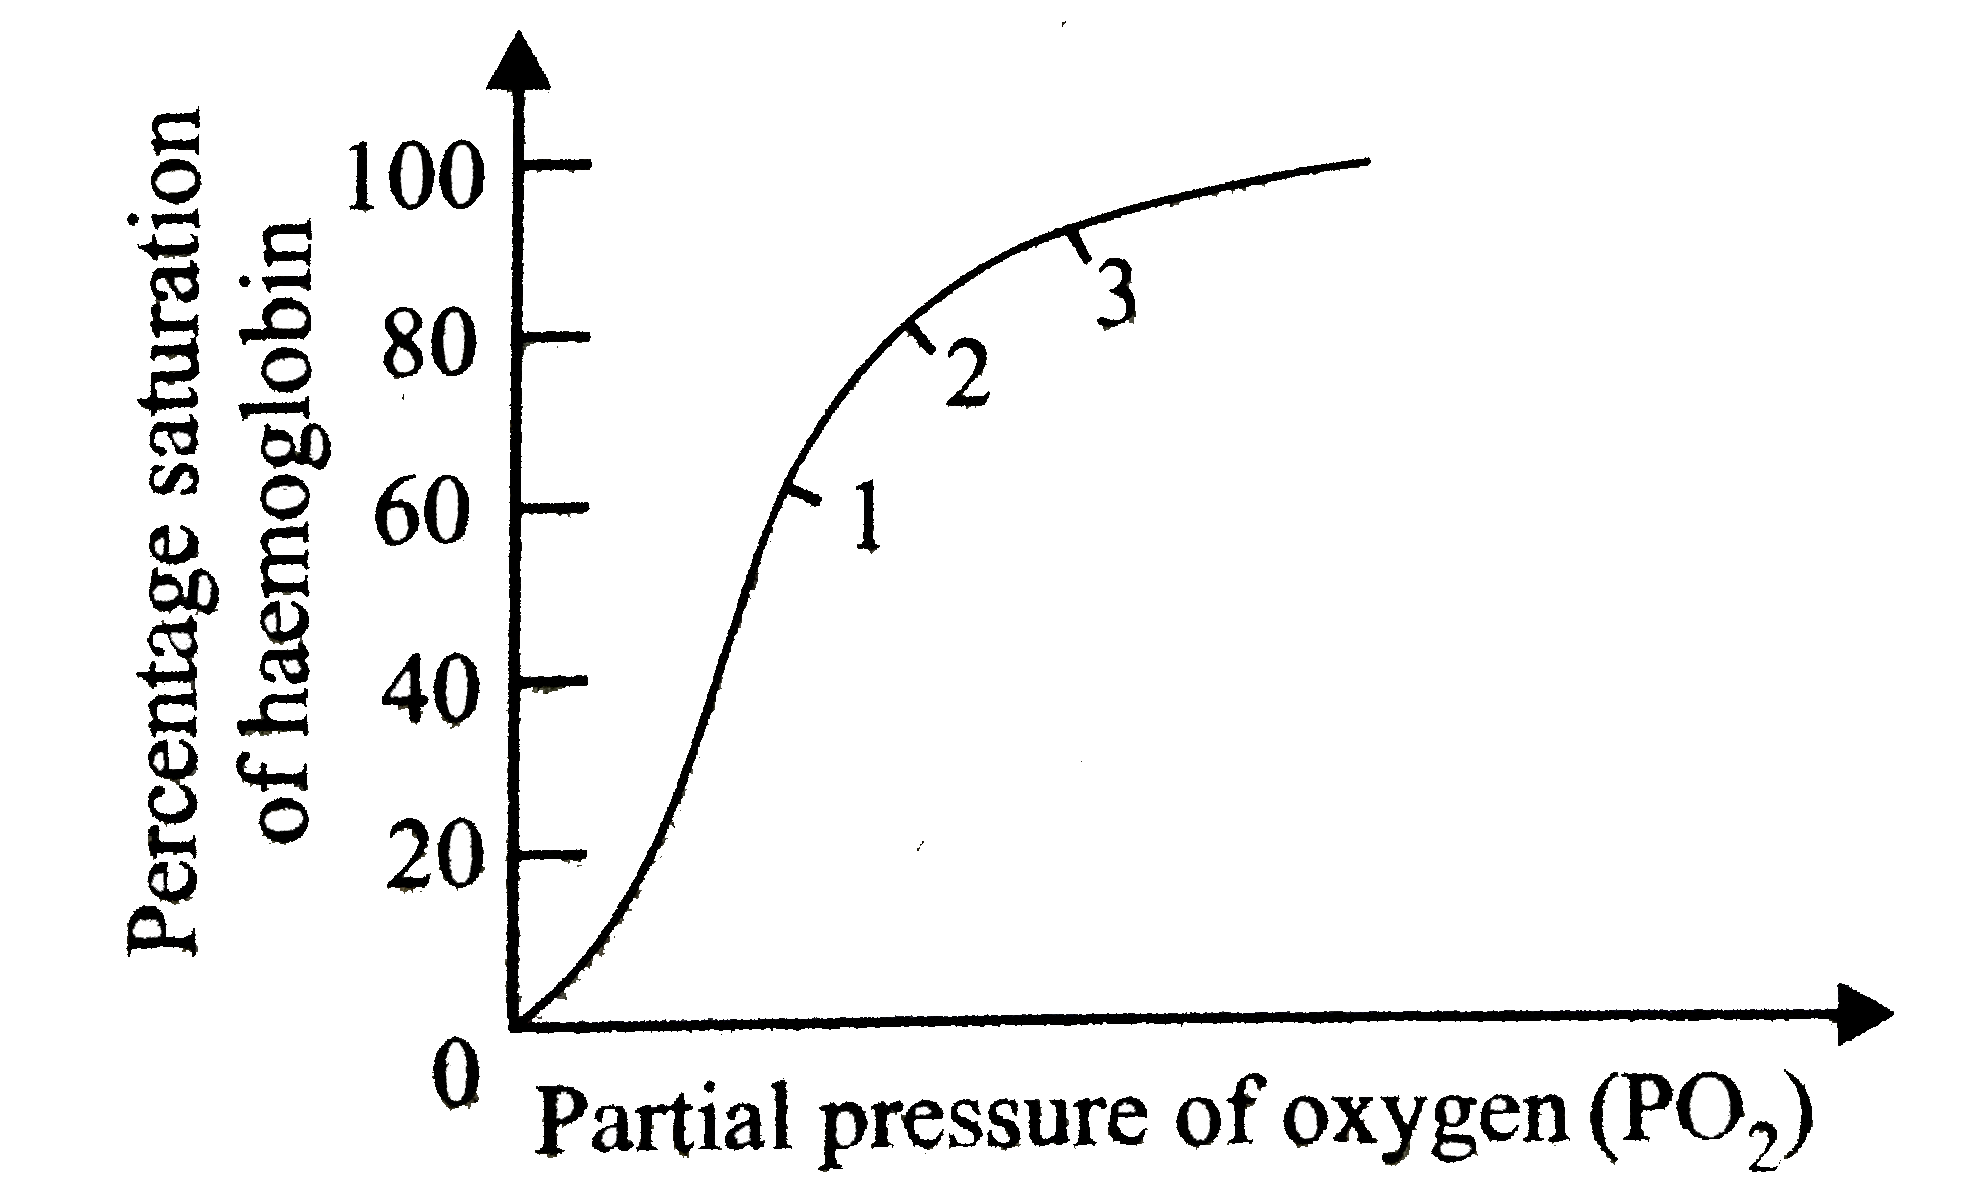
The given graph shows an oxygen dissociation curve for haemoglobin.

Wher is the body will haemoglobin be saturated at the percentage shown at point 1,2 and 3 in graph ?
Left ventriclePulmonary veinVena cava123
Left ventriclePulmonary veinVena cava213
Left ventriclePulmonary veinVena cava231
Left ventriclePulmonary veinVena cava321
The correct Answer is:C
The relationship between the partial pressure of O2(PO2) and percentage saturation of the Hb with O2 is graphically illustrated by a curve called oxygen dissociation curve. The haemoglobin is most saturated with oxygen in the pulmonary vein, as this vein is carrying oxygenated blood from the lungs towards the left auricle of the heart. From the left auricle the blood moves to the left ventrcile where saturation of Hb with O2 slightly reduces. Vena cava carries deoxygenated blood from all the organs of the body towards right auricle, thus, Hb is less saturated with O2.
Topper's Solved these Questions
Similar Questions
Knowledge Check
Oxygen dissociation curve of haemoglobin is
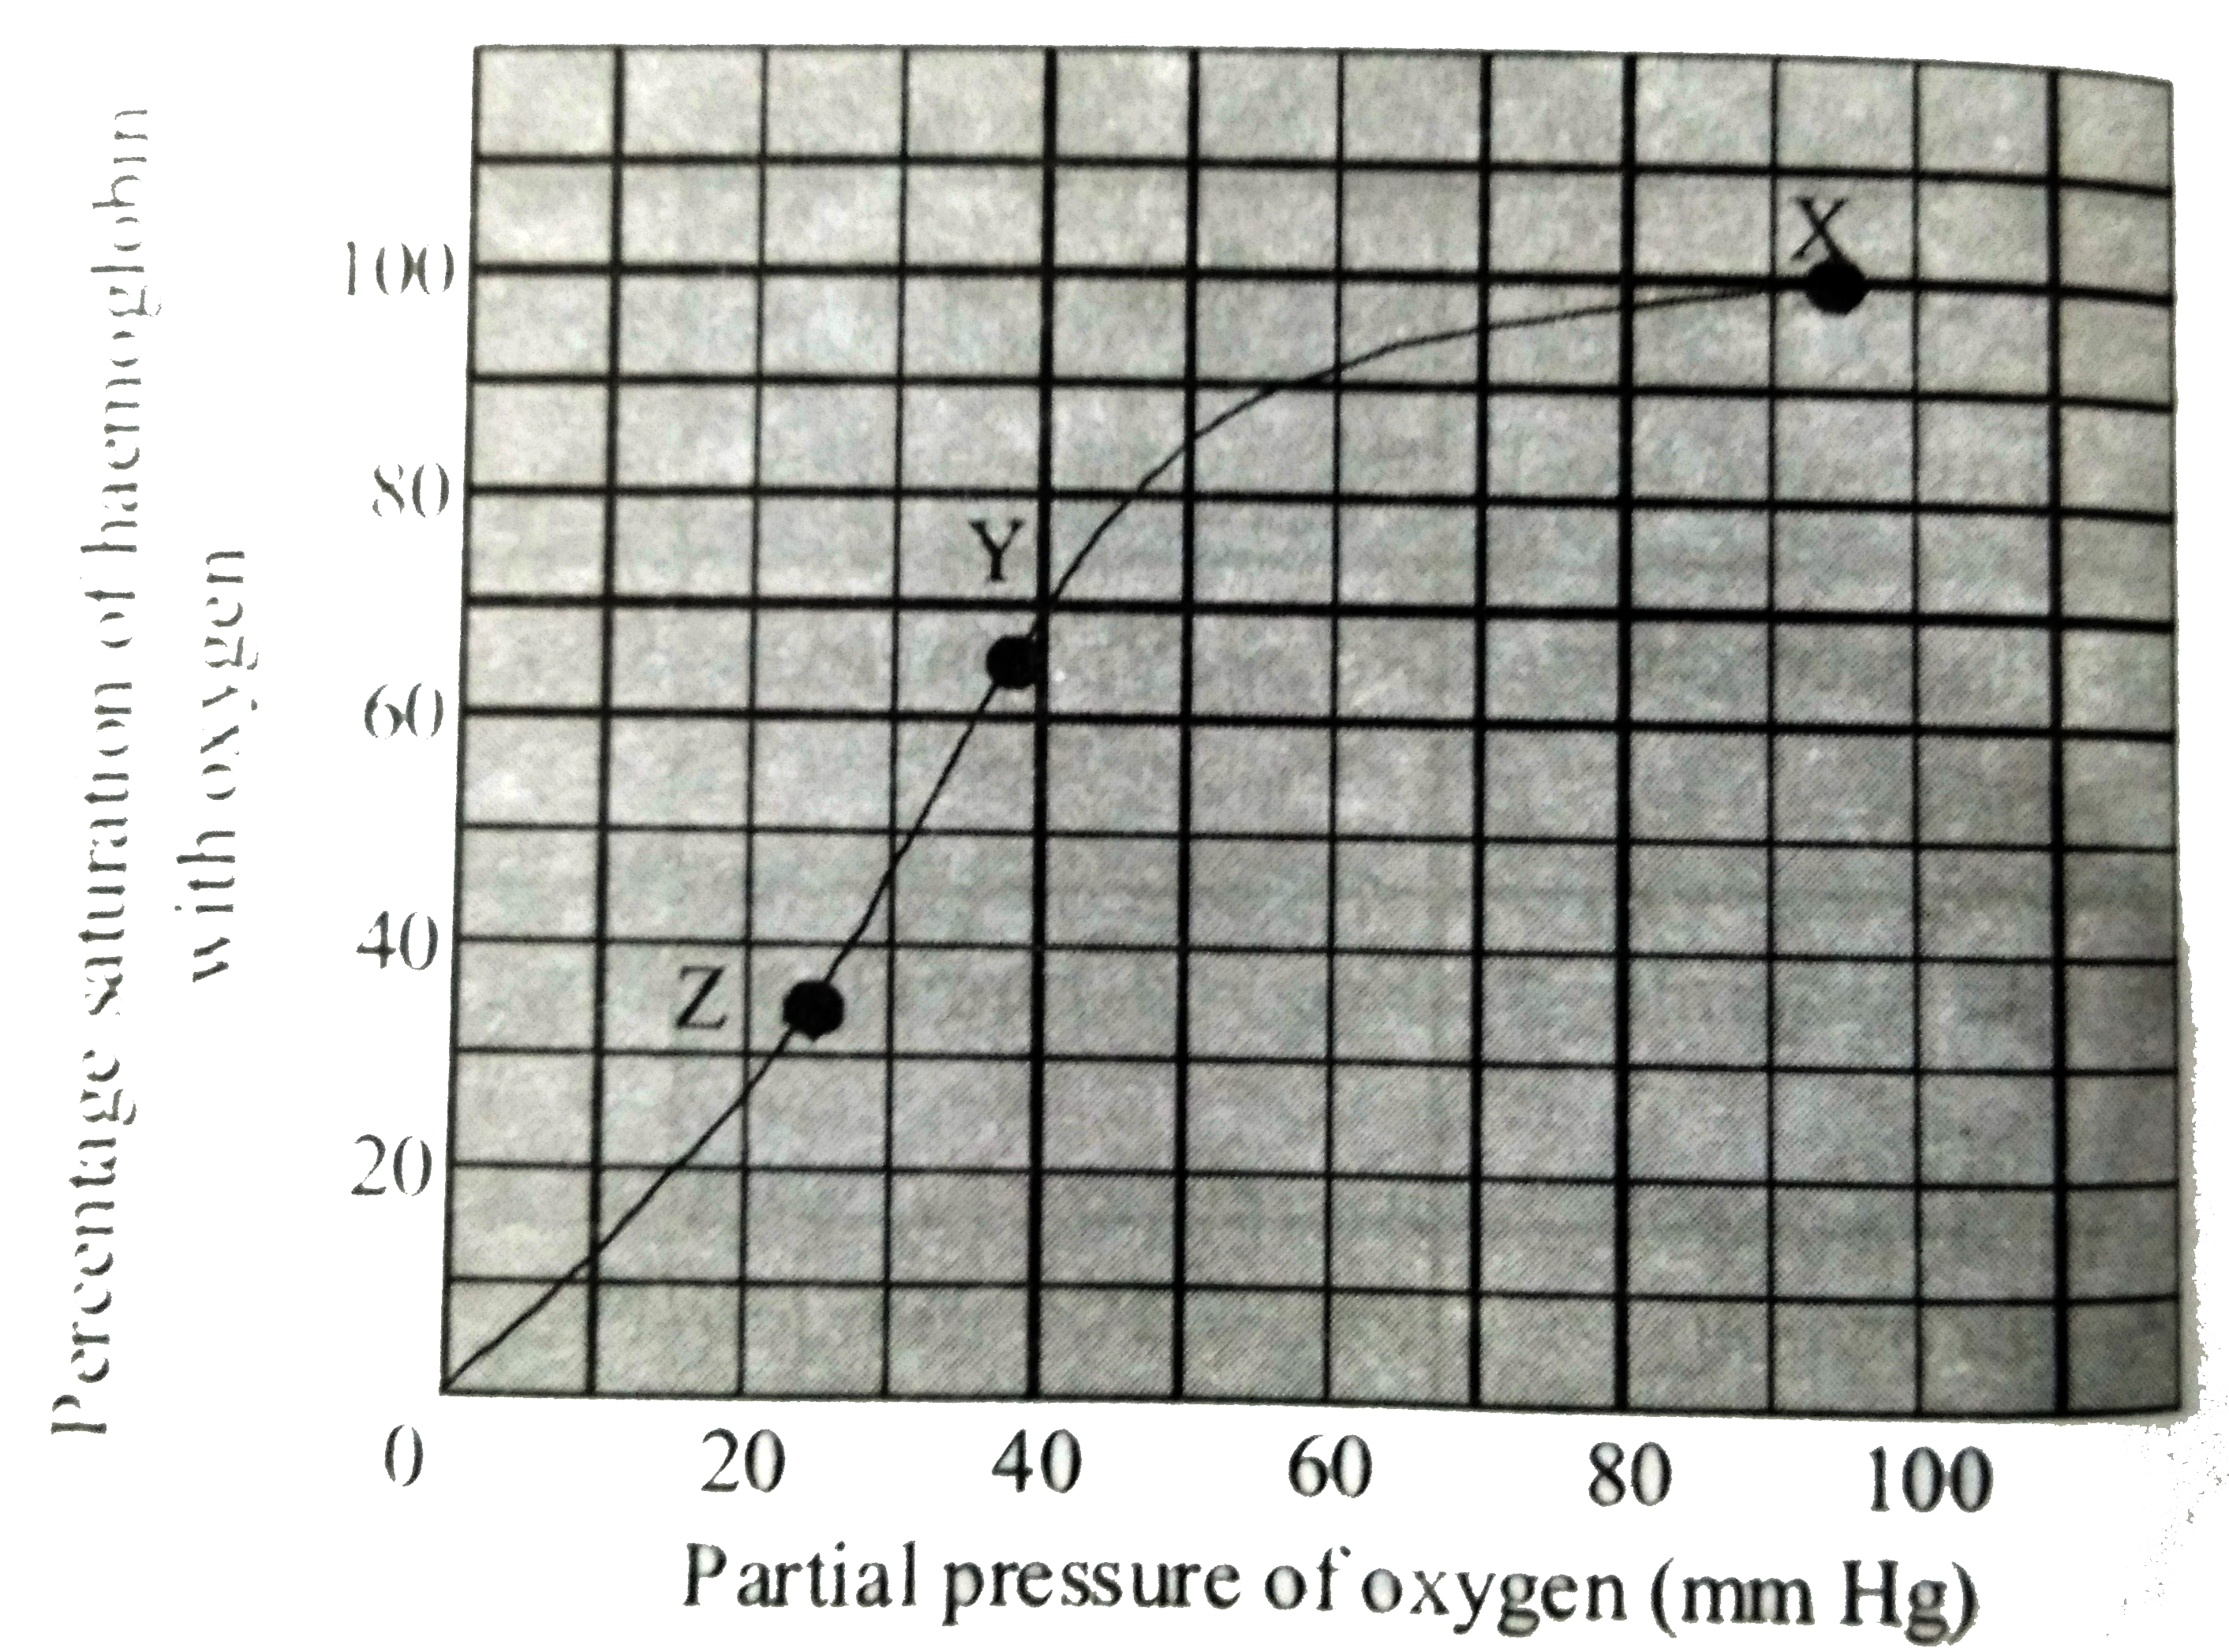
AsigmoidBhyperbolicChypobolicDhypobloicGiven below graphs an oxygen dissociation curve :−

Where in the body will haemoglobin be saturation at the percentage shown at points X,Y and Z.AX- Pulmonary artery, Y-Pulmonary vein, Z-Carotide arteryBX-Systemic artery, Y-Pulmonary atery, Z-Pulmonary veinCX-Pulmonary vein, Y-Systemic vein, Z-Systemic vein during exerciseDX-Lef ventricle , Y-Right ventricle, Z-Systemic arteryAt higher O2 concentration, oxygen dissociation curve of haemoglobin will '
AMove to leftBMove to rightCBecome irregularDMove upwardly
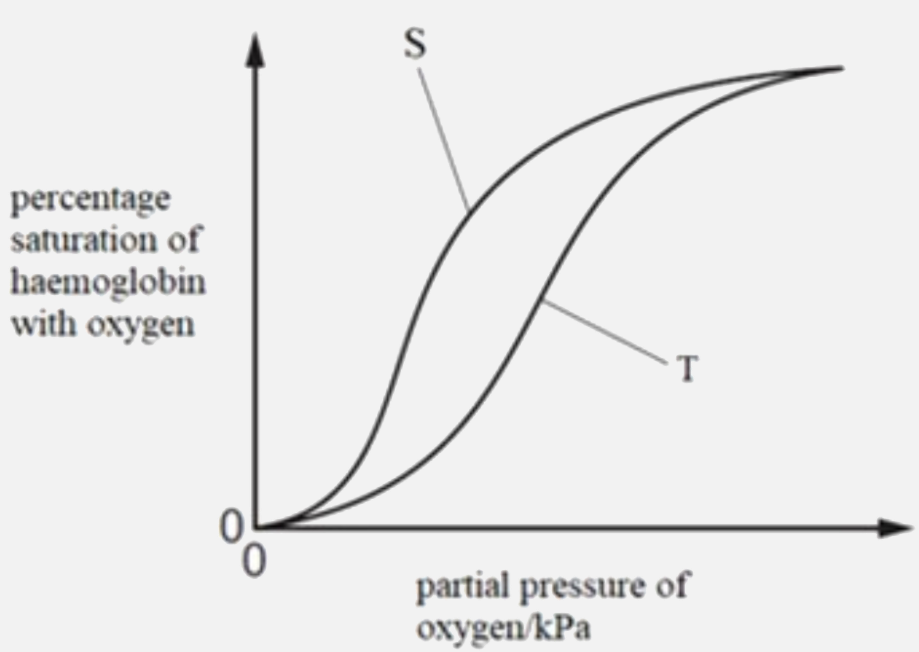
The graph shows the oxygen dissociation curves of haemoglobin from two species of mammals, s and T .

Which statements could explain the difference in the oxygen dissociation curves of species S and species T ?
I. Species T has higher haemoglobin concentration in its red blood cells than species S.
II. The haemoglobin in species T has a lower affinity for oxygen than the haemoglobin in species S.
III. Species T may be living at a higher altitudes than species S.
View SolutionOxygen-haemoglobin dissociation curve is
View SolutionIn which conditon oxygen dissociation curve of haemoglobin shift to right of normal curve ?
View SolutionDecrease in pH causes O2 dissociation curve of . haemoglobin t6 shift to
View SolutionWhen partial pressure of CO2 rises, the oxygen dissociation curve of haemoglobin at 37∘C will :
View Solution

