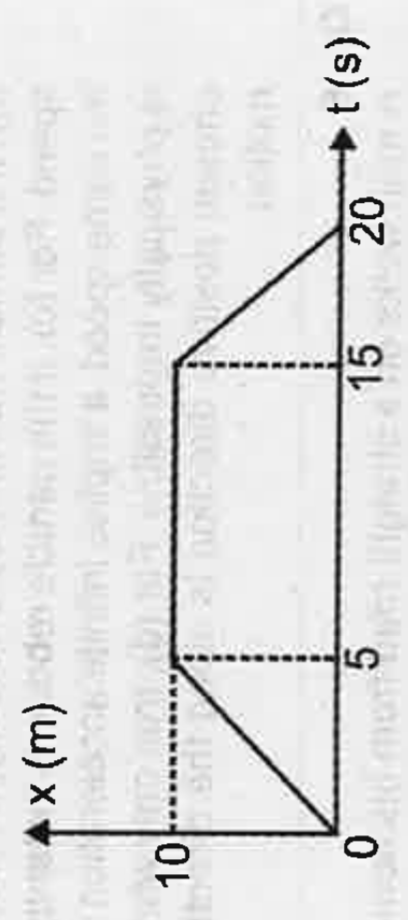
The figure shows the position time graph of a body moving along a straight line.
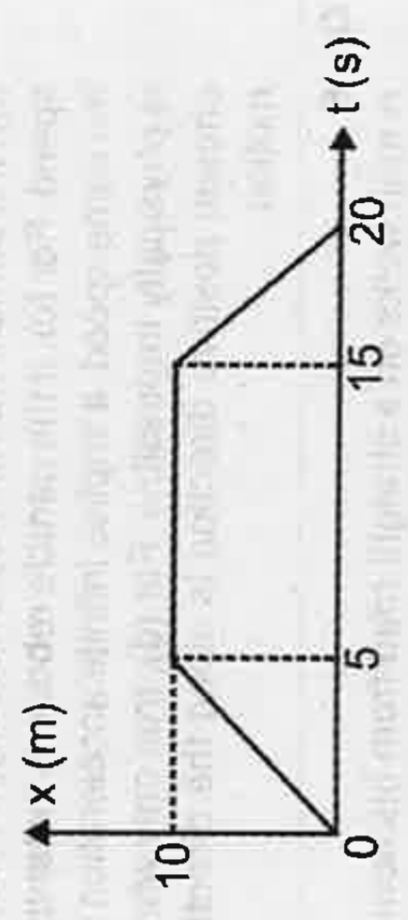
ii) From the graph, find the displacement in 20 seconds.Solution in Malayalam
Step by step video & image solution for The figure shows the position time graph of a body moving along a straight line. ii) From the graph, find the displacement in 20 seconds. by Physics experts to help you in doubts & scoring excellent marks in Class 11 exams.
Updated on:21/07/2023Topper's Solved these Questions
Similar Questions
Ramesh observes the motion of an insect in a circle. He finds that it travels 6 revolutions in an anti-clockwise direction for a time of 31.6 sec. Find angular speed ω.
View SolutionFill in the blanks:
A girl is swinging on a swing in a sitting position. When she stands up, the period of the swing will...........
View SolutionThe velocity displacement graph of a particle moving along a straight line is shown in figure. Then the acceleration displacement graph is.
View SolutionThe figure shows a velocity-time graph of a particle moving along a straight line
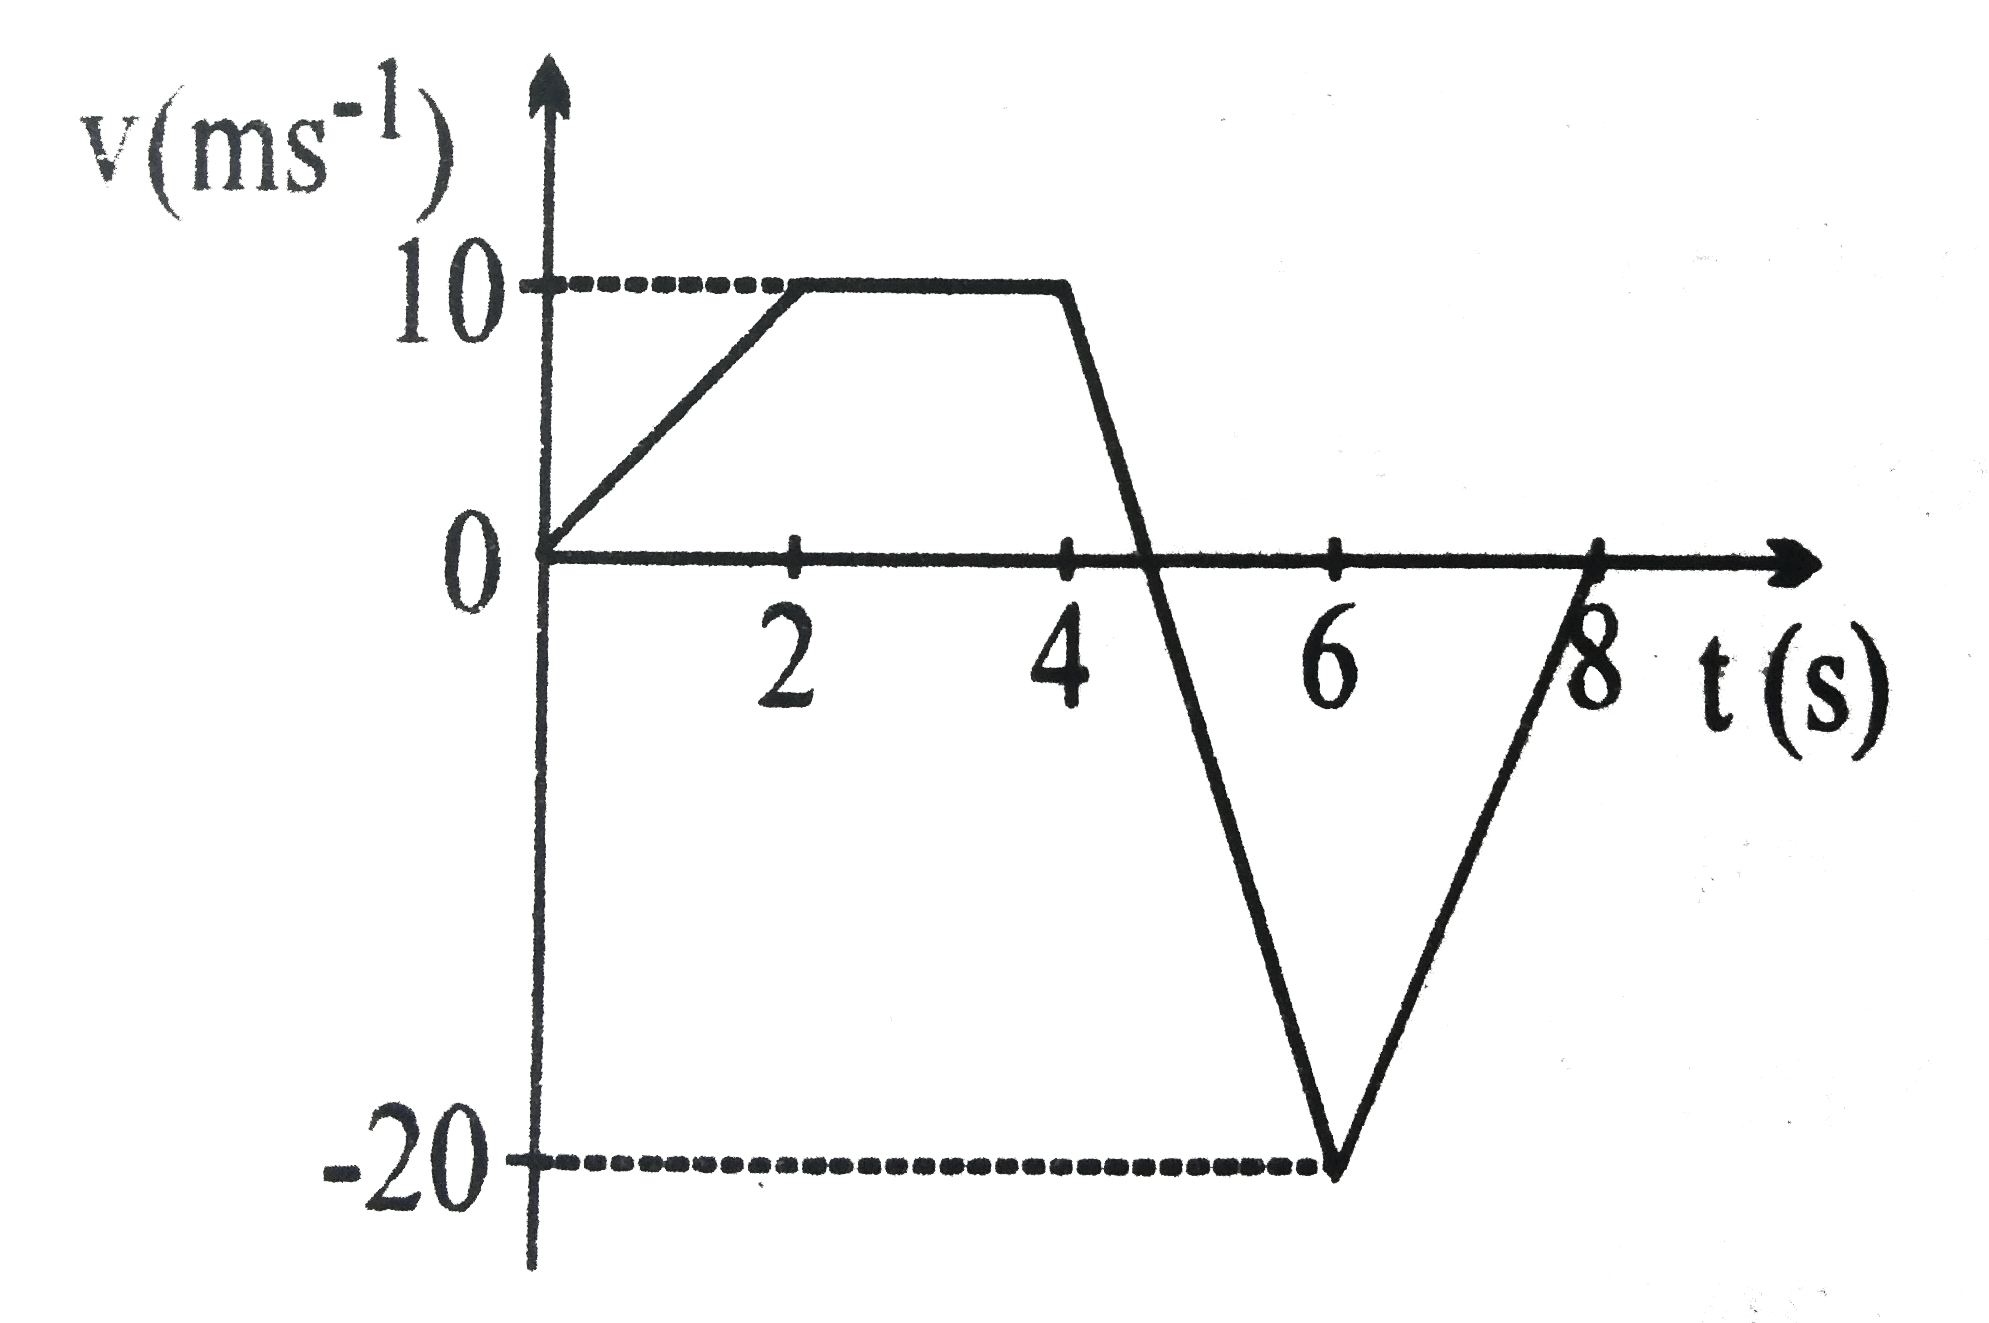
The maximum displacement of the particle is
View SolutionFigure shows the velocity time graph of a particle moving along straight line (v is m/s and t is in second). It average velocity in 20 seconds will be: .
View SolutionThe following figure-l .123 shows the velocity-time graph of a moving body along a straight line. The displacement and distance travelled in six seconds be respectively given as :
View SolutionThe velocity-time graph of a particle moving along a straight line is shown in the figure-given below The displacement of the particle in 5 second is
View SolutionThe figure shows a velocity-time graph of a particle moving along a straight line Q. The maximum of displacement of the particle is
View SolutionThe figure shows a velocity-time graph of a particle moving along a straight line Q. The correct displacement-time graph of the particle is shown as
View SolutionThe figure shows a velocity-time graph of a particle moving along a straight line
The maximum of displacement of the particle is
View SolutionThe velocity - time graph of a particle moving along a straight line is shown in the figure given below The displacement of the particle in 5 second is
View Solutionदिये गये चित्र में एक सीधी रेखा में गति करने वाली वस्तु का समय त्वरण ग्राफ दिया गया है| ग्राफ से ज्ञात कीजिये
(i ) प्रथम 20 सेकण्ड से औसत त्वरण
(ii ) वस्तु पर किस समय से किस समय तक बल अचर रहा ?
View SolutionThe velocity versus time graph of a body moving along a straight line is as shown in figure. The ratio of displacement and distance covered body in 5 second is :-
View SolutionThe velocity-time graph of a particle moving along a straight line is shown in Fig. The displacement of the body in 5 second is :
View Solution(a) The figure shows the position time graph of a body moving along a straight line.
i) Draw the velocity - time graph of the body.
View Solution

