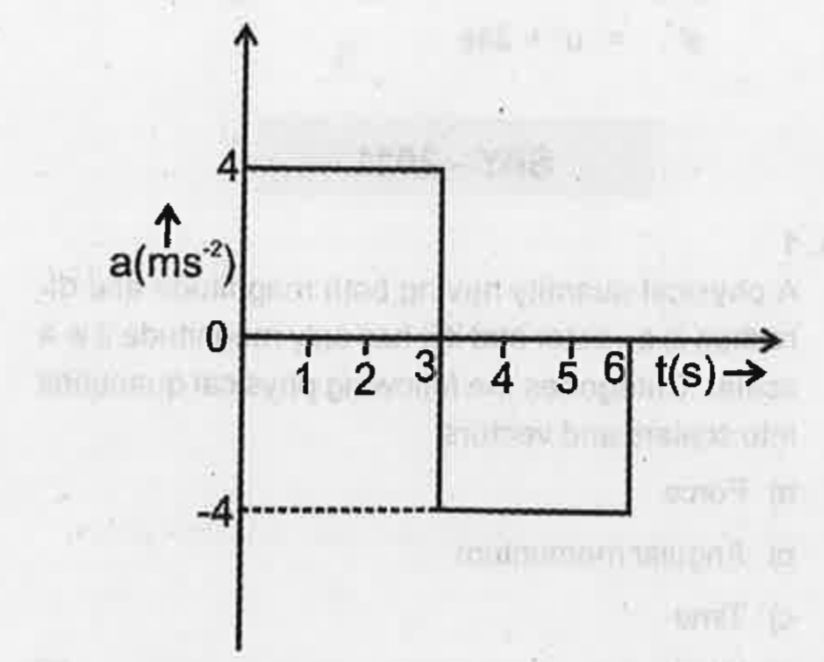
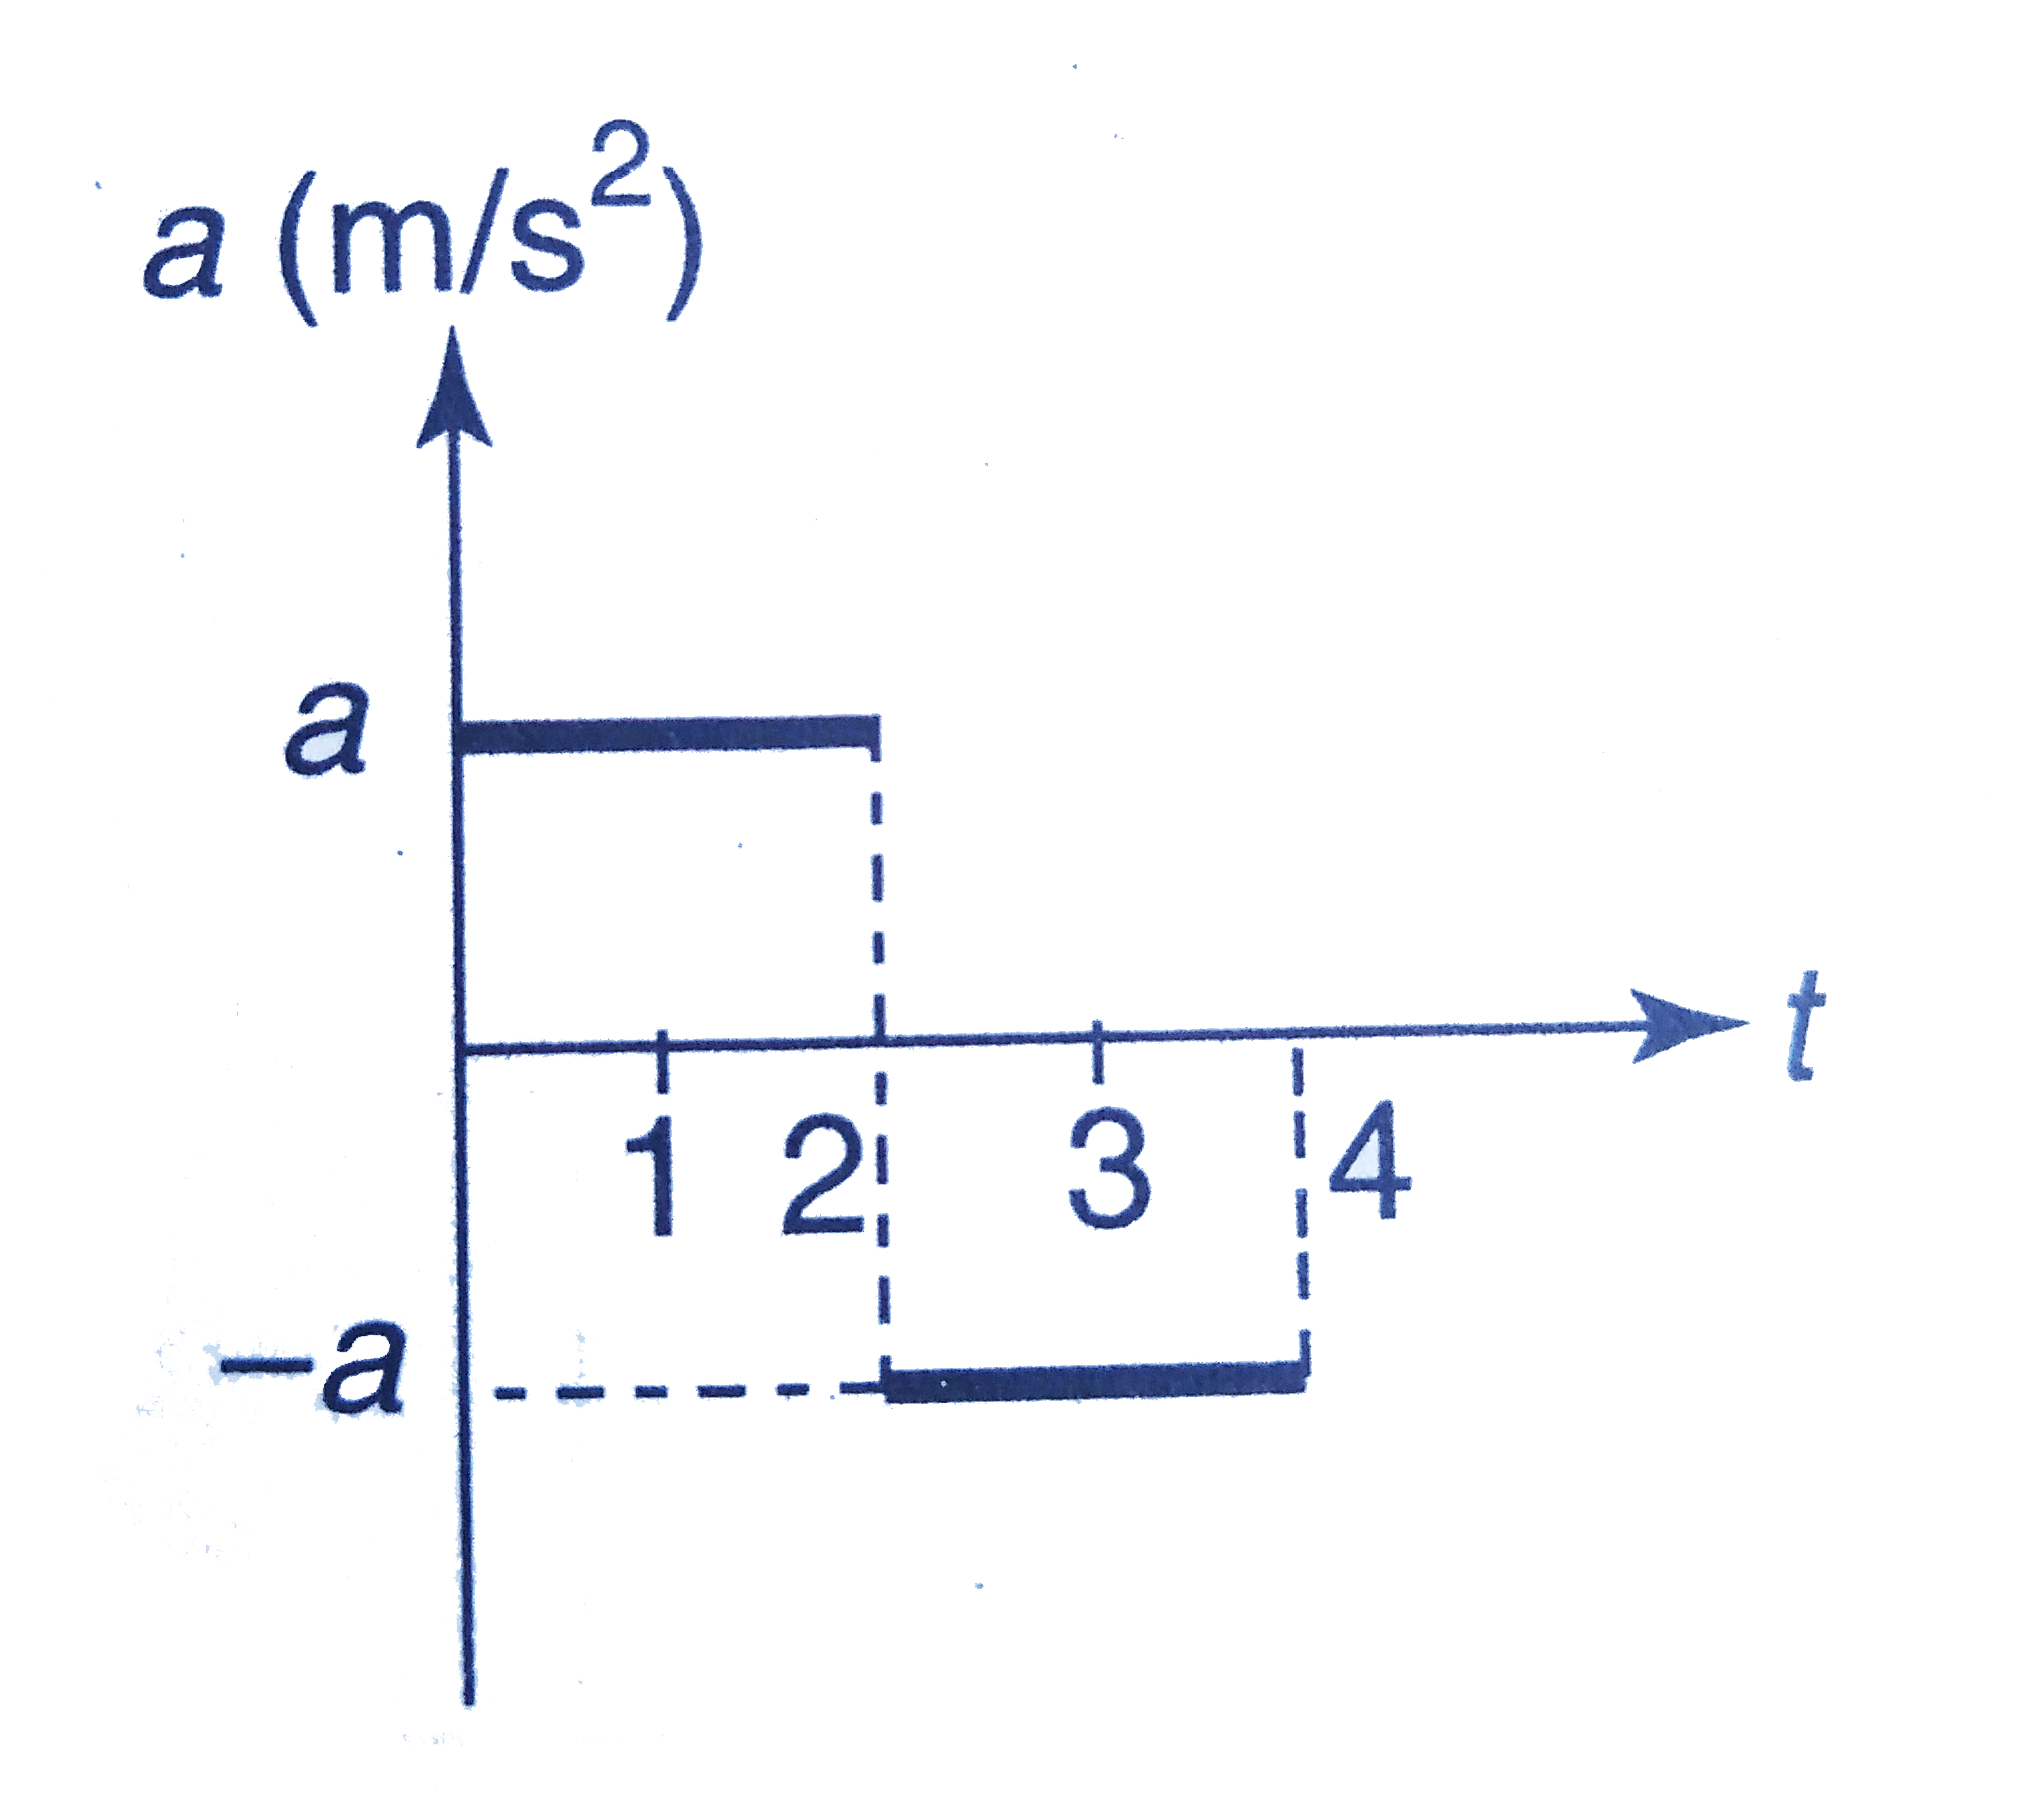
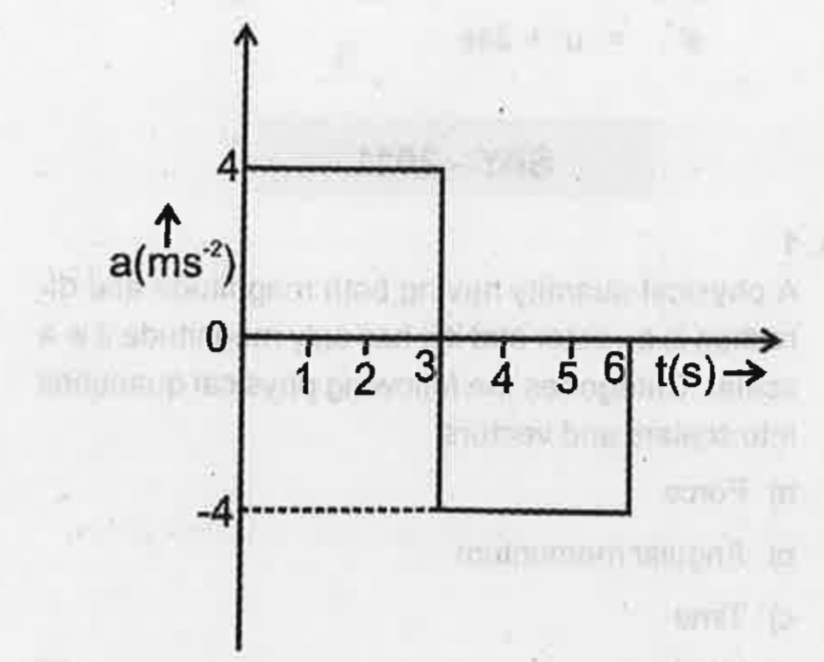
Acceleration -time graph of a body starts from rest as shown below :

What is the use of the acceleration - time graph?Solution in Malayalam
Step by step video & image solution for Acceleration -time graph of a body starts from rest as shown below : What is the use of the acceleration - time graph? by Physics experts to help you in doubts & scoring excellent marks in Class 11 exams.
Updated on:21/07/2023Topper's Solved these Questions
Similar Questions
Ramesh observes the motion of an insect in a circle. He finds that it travels 6 revolutions in an anti-clockwise direction for a time of 31.6 sec. Find angular speed ω.
View SolutionFill in the blanks:
A girl is swinging on a swing in a sitting position. When she stands up, the period of the swing will...........
View SolutionA body starts from rest at time t = 0 , the acceleration time graph is shown in the figure . The maximum velocity attained by the body will be
View SolutionThe acceleration time graph of a body is shown below the most probable velocity time graph of the body is
View SolutionA particle starts from rest and undergoes an acceleration as shown in figure. The velocity-time graph from figure will have a shape.

View SolutionWhat conclusion can you draw about the acceleration of a body from the speed-time graph shown below ?
View SolutionDistance Time Graph || Finding Velocity Using Distance Time Graph || Distance Time Graph Of An Accelerated Body
View SolutionWhat conclusion can you draw about the acceleration of a body from the speed-time graph shown below ?
View SolutionA graph of acceleration versus time of a particle starting from rest at t=0 is as shown in figure. The speed of the particle at t = 14s is
View SolutionStarting from rest, a body moves in a straight line with a constant acceleration. Describe the nature of the graph relating the displacement with time.
View SolutionAcceleration -time graph of a body starts from rest as shown below :

Draw the velocity-time graph using the above graph
View SolutionAcceleration -time graph of a body starts from rest as shown below : Find the displacement in the given interval of time form 0 to 3 seconds.
View Solution
The acceleration time graph of a body is shown below the most probable velocity time graph of the body is
View SolutionA graph of acceleration versus time of a particle starting from rest at t=0 is as shown in figure. The speed of the particle at t = 14s is
View SolutionSpeed-time graph of an object moving with uniform acceleration starting from rest is
View Solution
