Which of the two graphs will be a straight line at constant temperature ? P versus V or P versus 1/V ? Explain.Solution in Odia
Step by step video & image solution for Which of the two graphs will be a straight line at constant temperature ? P versus V or P versus 1/V ? Explain. by Chemistry experts to help you in doubts & scoring excellent marks in Class 12 exams.
Updated on:21/07/2023Topper's Solved these Questions
Similar Questions
Write the formula of Borax.
View SolutionCalculate the wavelength and energy of radiation emitted for the electronic transition from infinity (∞) to stationary state of one of hydrogen atom.
View SolutionFor a given mass of a gas what is the shape of (p) versus (1V) graph at constant temperature ?
View SolutionAssertion: The plot of volume (V) versus pressure (P) at constant temperature is a hyperbola in the first quadrant.
Reason: V∝1/P at constant temperature.
View SolutionVelocity (v) versus displacement (s) graph of a particle moving in a straight line is shown in figure. Corresponding acceleration (a) versus velocity (v) graph will be
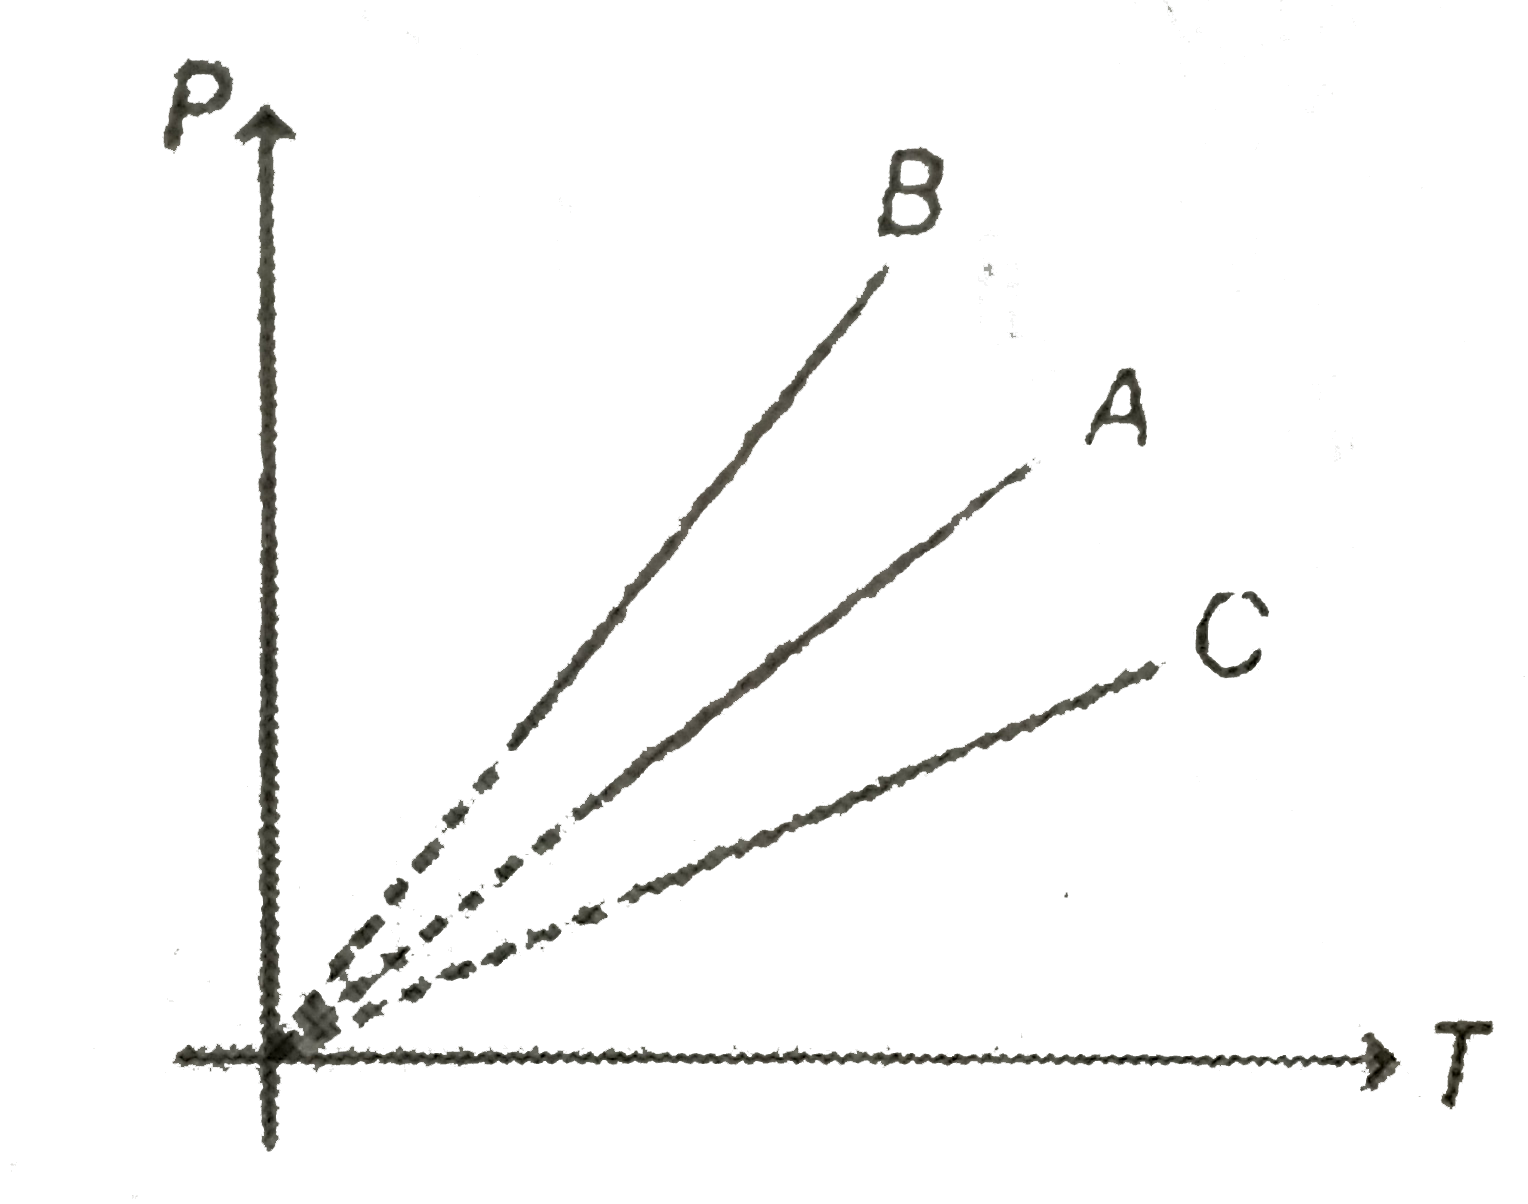
View SolutionPressure versus temperature graph of an ideal gas at constant volume V is shown by the straight line A. Now mass of the has is doubled and the volume is halved, then the corresponding pressure versus temperature graph will be shown by the line

View SolutionIn P versus V graph, the gorizontal line is found in which _______ exists.
View SolutionThe nature of graph of P versus (1V) for given mass of gas at constant temperature is .........
View SolutionWhat is the nature of graph of P versus (1/V) for a given mass of gas at constant temperature ?
View SolutionWhich of the two graphs will be a straight line at constant temperature P versus V or P versus 1/V Explain.
View SolutionFor a given mass of a gas what is the shape of (p) versus (1V) graph at constant temperature ?
View SolutionPressure versus temperature graph of an ideal gas at constant volume V is shown by the straight line A. Now mass of the gas is doubled and the volume is halved, then the corresponding pressure versus temperature graph will be shown by the line
View SolutionFor a definite mass of an ideal gas at constant temperature, V versus 1/Pplot is a
View SolutionAmong-the plots of P versus V at constant temperature as given below, which one corresponds to Boyle’s law ?
View SolutionExplain the nature of the graphs of log P versus log V and log V versus log T.
View Solution
