The graph betwee √E and 1p is (E=kinetic energy and p= momentum)


The correct Answer is:C
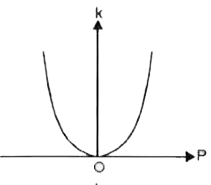
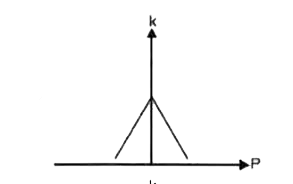
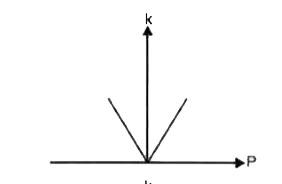
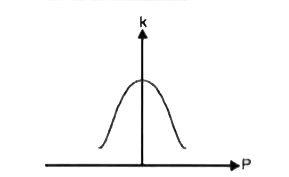
P=√2mE it is clear that P∝√E
So the graph between P and √E will be straight line. But graph between 1P and √E will be hyperbola
Topper's Solved these Questions
- WORK , ENERGY , POWER AND COLLISIONBOOK - ERRORLESS CHAPTER - WORK , ENERGY , POWER AND COLLISIONEXERCISE - Assertion & Reason For AIIMS Aspirants
30 Videos
- WORK , ENERGY , POWER AND COLLISIONBOOK - ERRORLESS CHAPTER - WORK , ENERGY , POWER AND COLLISIONEXERCISE - Self Evaluation Test
19 Videos
- WORK , ENERGY , POWER AND COLLISIONBOOK - ERRORLESS CHAPTER - WORK , ENERGY , POWER AND COLLISIONEXERCISE - Critical Thinking (Objective Questions)
20 Videos
- WAVES AND SOUNDBOOK - ERRORLESS CHAPTER - WAVES AND SOUNDEXERCISE - SET
25 Videos
- WORK, ENERGY, POWER & COLLISIONBOOK - ERRORLESS CHAPTER - WORK, ENERGY, POWER & COLLISIONEXERCISE - Assertion
30 Videos
Similar Questions
(a) A proton is moving at a speed much less than the speed of light. It has kinetic energy K1 and momentum p1. If the momentum of the proton is doubled, so p2=2p1, how is its new kinetic energy K2 related to K−1?
(b)A photon with energy E1 has momentum p1 . if another photon has momentum p2 that is twice p1, how is the energy E2 of the second photon related to E1?
View SolutionRelation between kinetic energy and momentum
Let us consider a body of mass 'm' having a velocity 'v', then
momentum of the body P = mass × velocity
P=m×v⇒v=Pm ...(1)
From definition, kinetic energy (K.E) of the body
K.E=12mv2 ...(2)
Now putting the value of (1) in (2) we have
K.E=12m(Pm)2
K.E.=12mP2m2=12P2m=P22m ...(3)
Thus we can write
P2=2m×K.E
⇒P=√2m×K.E
Thus momentum = √2×mass×kinetic energy
What will be the momentum of a body of mass 100 g having kinetic energy of 20 J ?
View Solution
Knowledge Check
The graph between linear monentum (p) and Kinetic energy (k) is best represented by
A B
B C
C D
D
The relation between kinetic energy K and linear momentum p of a particle is represented by
AK2=2mpB2K2=mpCp2=2mkD2mK=pThe relation between kinetic energy K and linear momentum p of a particle is represented by
AK2=2mpB2K2=mpCp2=2mKD2mK=p
The momentum of a body is p and its kinetic energy is E. Its momentum becomes 2p. Its kinetic energy will be
View SolutionAn electron with speed v and a photon with speed c have the same de-Broglic wavelength. If the kinetic energy and momentum of electron is Ee and Pe and that of photon is Eph and Pph respectively, then correct statement is -
View SolutionThe curve between loge L and loge P is (L is the angular momentum and P is the linear momentum).
View SolutionWhich of the following graphs represents the graphical relation between momentum (p) and kinetic energy (K) for a body in motion?
View SolutionWhich one of the following correctly represents the variation between linear momentum (P) and kinetic energy (E) ofa body?
View Solution
