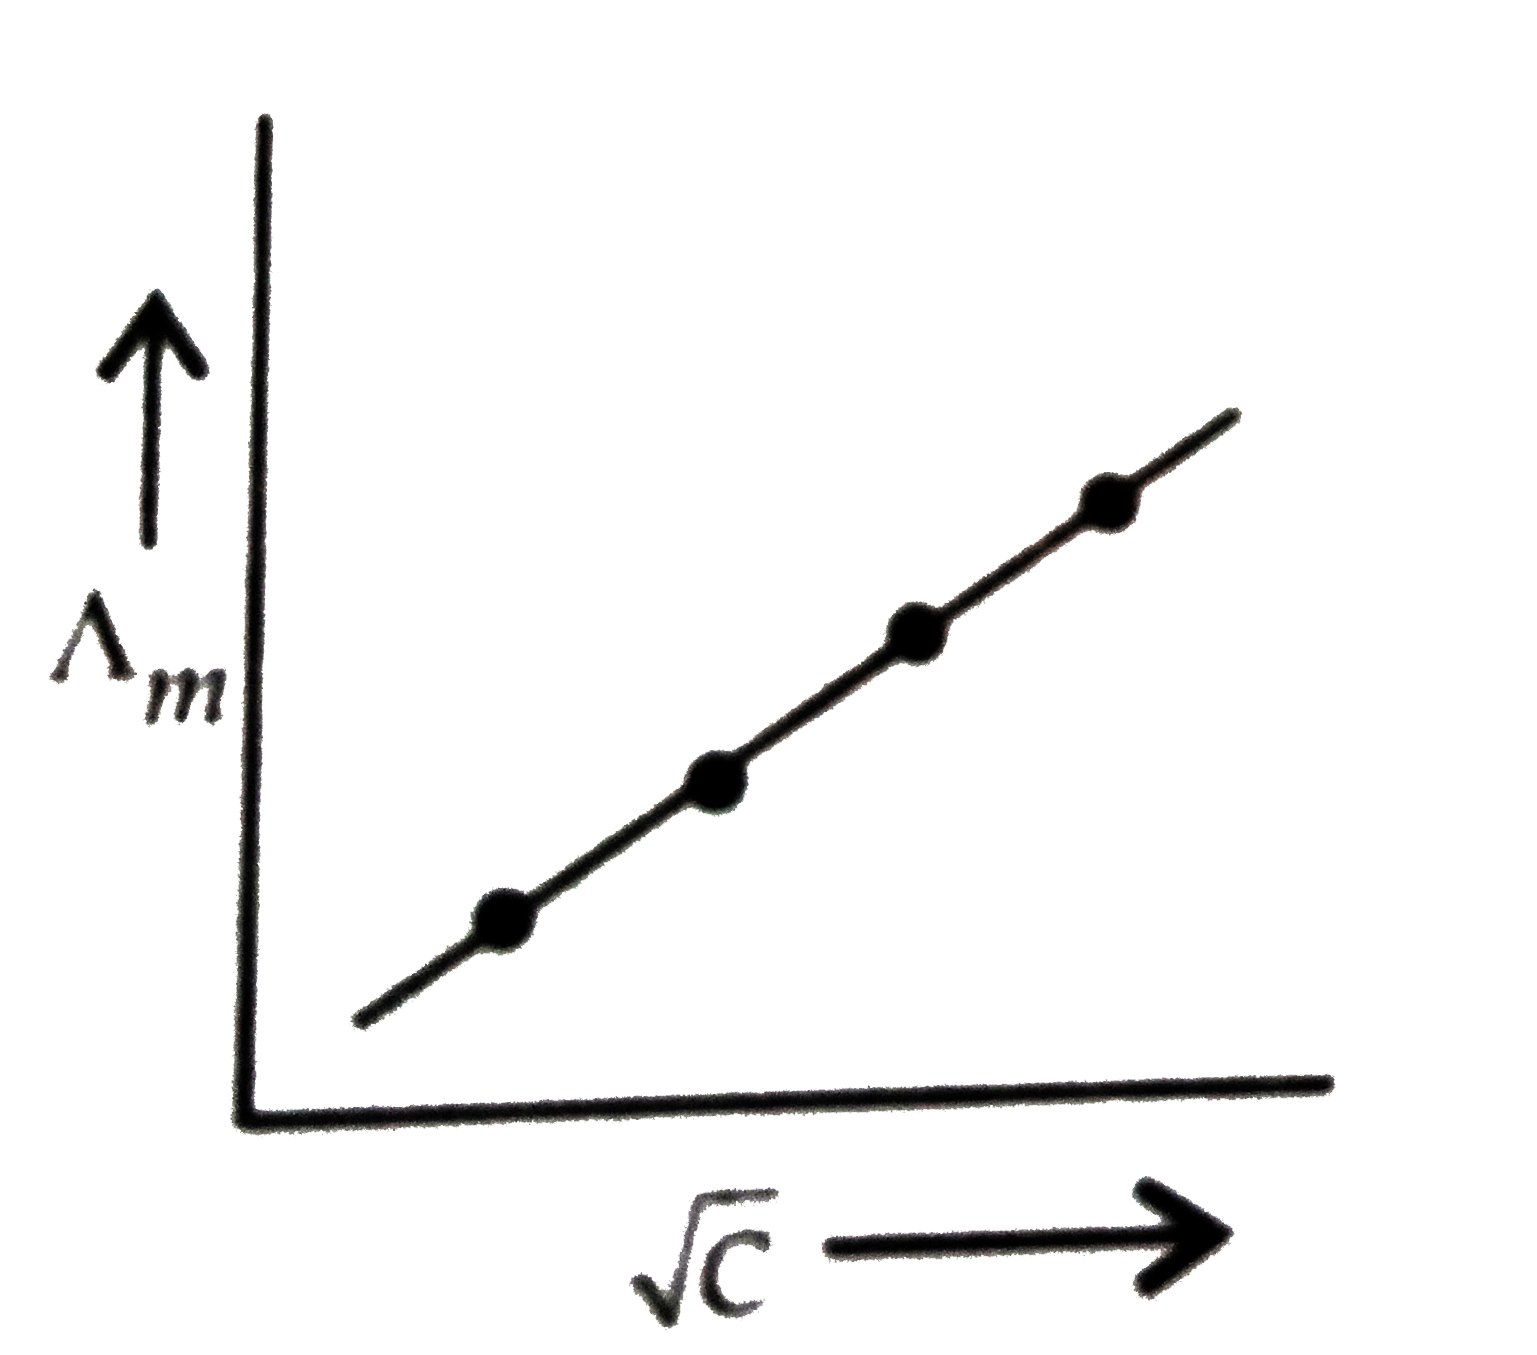
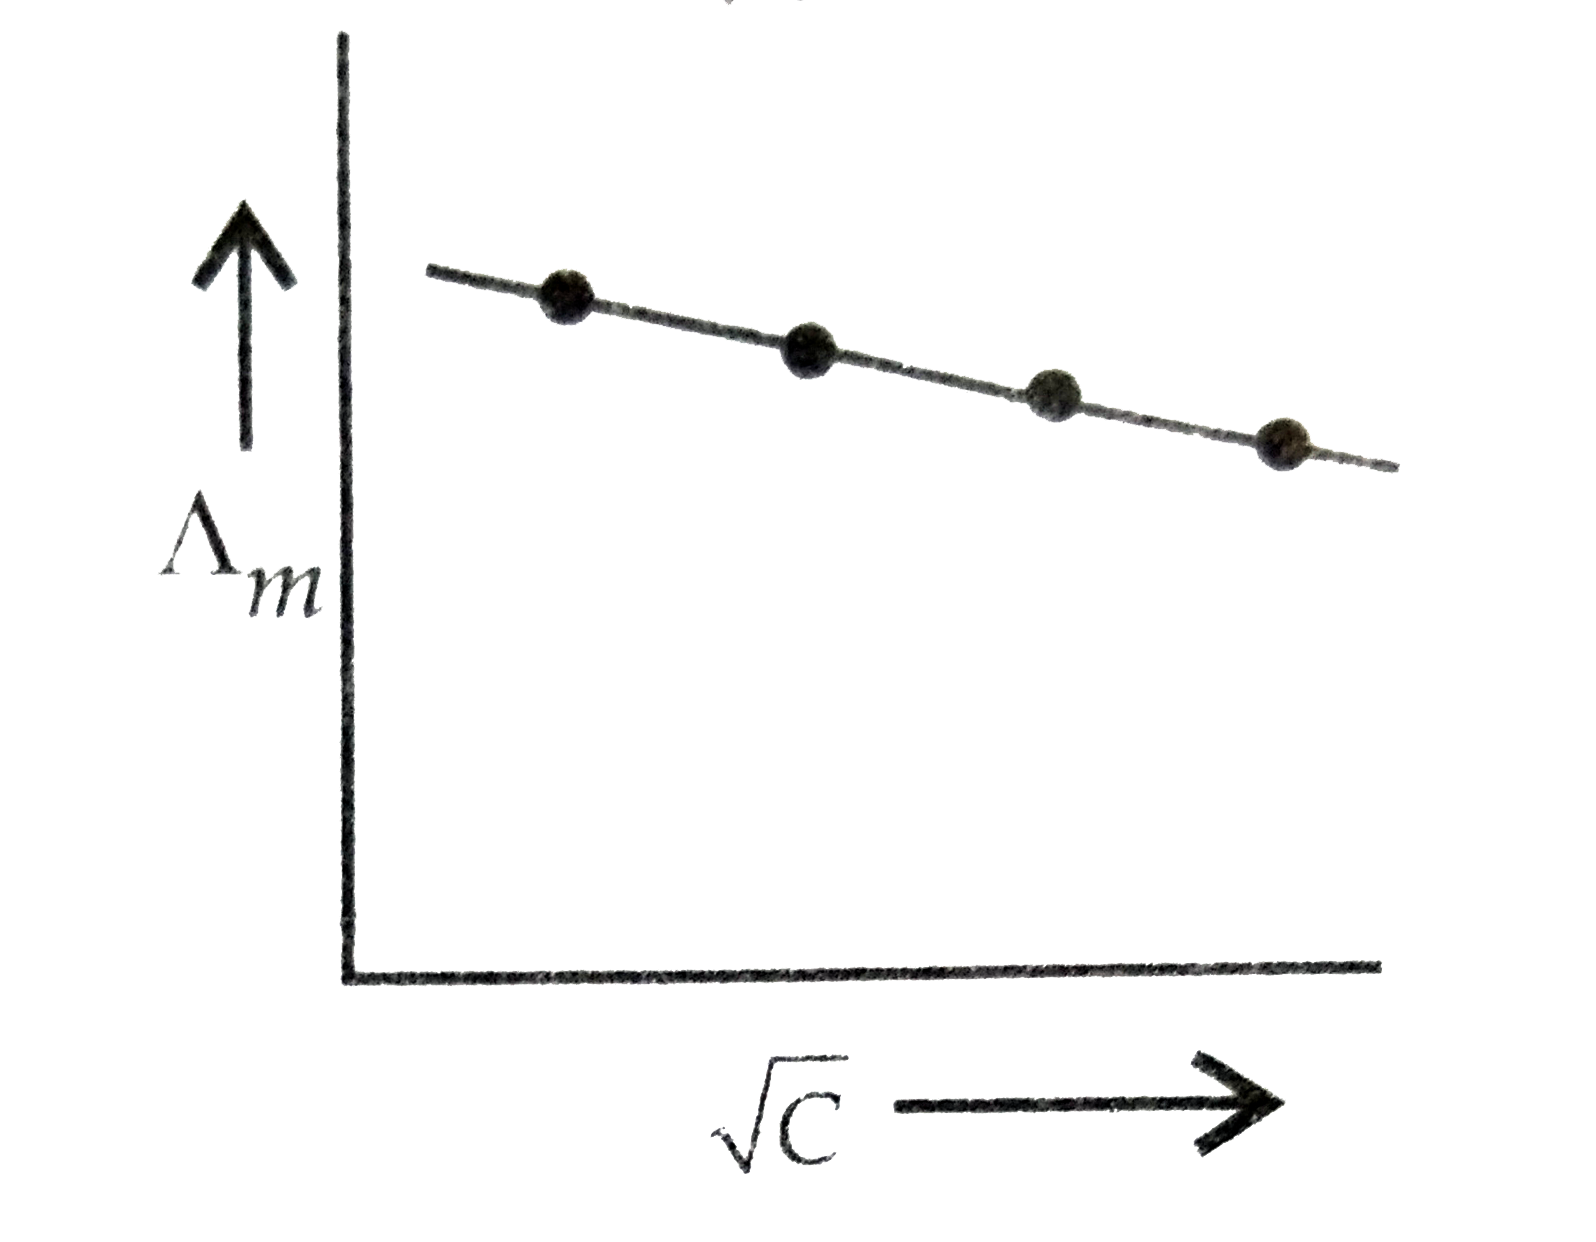
Which of the following curve gives the variation of Λmwith√C for CH3COOH ?


None of these
The correct Answer is:D
To solve the question regarding the variation of molar conductivity (λ_m) with the square root of concentration (√C) for acetic acid (CH₃COOH), we can follow these steps:
Step 1: Understand the Concept of Molar Conductivity
Molar conductivity (λ_m) is a measure of how well an electrolyte conducts electricity in solution. It is defined as the conductivity (κ) divided by the molar concentration (C) of the electrolyte.
Step 2: Identify the Nature of Acetic Acid
Acetic acid is a weak electrolyte, which means it does not completely dissociate into ions in solution. This partial dissociation affects its molar conductivity.
Step 3: Analyze the Relationship Between λ_m and √C
For weak electrolytes like acetic acid, the relationship between molar conductivity (λ_m) and the square root of concentration (√C) is not linear. As the concentration decreases (or √C increases), the molar conductivity initially increases but then levels off due to the limited ionization of the weak electrolyte.
Step 4: Draw the Expected Curve
The expected curve for the variation of λ_m with √C for acetic acid will show an initial increase in molar conductivity with increasing √C, followed by a plateau as the concentration continues to decrease. This is typically represented as a concave curve that rises and then flattens out.
Step 5: Evaluate the Given Options
In the question, we need to evaluate the provided curves to determine which one represents the expected behavior for acetic acid. The curves for strong electrolytes would show a linear relationship, which is not applicable here.
Conclusion
Based on the analysis, the correct option is the one that does not show a linear relationship and reflects the behavior of a weak electrolyte like acetic acid.
Final Answer
The correct option is that none of the provided curves represent the variation of λ_m with √C for acetic acid.
---
Molar conductivity (λ_m) is a measure of how well an electrolyte conducts electricity in solution. It is defined as the conductivity (κ) divided by the molar concentration (C) of the electrolyte.
Acetic acid is a weak electrolyte, which means it does not completely dissociate into ions in solution. This partial dissociation affects its molar conductivity.
For weak electrolytes like acetic acid, the relationship between molar conductivity (λ_m) and the square root of concentration (√C) is not linear. As the concentration decreases (or √C increases), the molar conductivity initially increases but then levels off due to the limited ionization of the weak electrolyte.
The expected curve for the variation of λ_m with √C for acetic acid will show an initial increase in molar conductivity with increasing √C, followed by a plateau as the concentration continues to decrease. This is typically represented as a concave curve that rises and then flattens out.
In the question, we need to evaluate the provided curves to determine which one represents the expected behavior for acetic acid. The curves for strong electrolytes would show a linear relationship, which is not applicable here.
Based on the analysis, the correct option is the one that does not show a linear relationship and reflects the behavior of a weak electrolyte like acetic acid.
The correct option is that none of the provided curves represent the variation of λ_m with √C for acetic acid.
Topper's Solved these Questions
- PRACTICE PAPER -3Book:NCERT FINGERTPS ENGLISHChapter:PRACTICE PAPER -3Exercise:Practice Paper 3
Explore 50 Videos
- PRACTICE PAPER -2Book:NCERT FINGERTPS ENGLISHChapter:PRACTICE PAPER -2Exercise:Practice Paper 2
Explore 50 Videos
- SOLUTIONS Book:NCERT FINGERTPS ENGLISHChapter:SOLUTIONS Exercise:Assertion And Reason
Explore 15 Videos
Similar Questions
Which of the following curve represents the variation of λM with √C for AgNO3?
View SolutionWhich of the following curve will represent the variation of conductance C during titration of CH3COOH by gradual addition of NaOH solution (V)
View SolutionWhich of the following is not the isomer of CH3COOH?
View Solutionwhich is not soluble in CH3COOH ?
View SolutionWhich one of the following is the correct order of acidic strength?
(i) Cl3C−COOH
(ii) Cl2CH−COOH
(iii) ClCH2−COOH
(iv) CH3−COOH
View SolutionWhich of the following compound will not give positive test with NaHCO3.?
Phenol,CH3COOH,CH3CH2SO3H,CH3C≡CH,CH3CH2OH,Phthalic acidSalicylic acid,Cinammic acidLactice acidP−Cresol
View SolutionWhich of the following names are correct for the compound :
CH3−O∣∣C−CH2−COOH
View SolutionWhich of the following solutions added to 1L of a 0.01 M CH3COOH solution will cause no change in the degree of dissociation of CH3COOH and pH of the solution ?
(Ka=1.6×10⁻⁵ for CH3COOH)
View SolutionWhich of the following solutions when added to 1L of a 0.1 M CH3COOH will cause no change in the pH of the solution Ka=1.8×10⁻⁵ for CH3COOH?
View SolutionCalculate the pH at the equivalence point during the titration of 0.1M, 25 mL CH3COOH with 0.05M NaOH solution. [Ka(CH3COOH)=1.8×10⁻⁵]
View Solution

