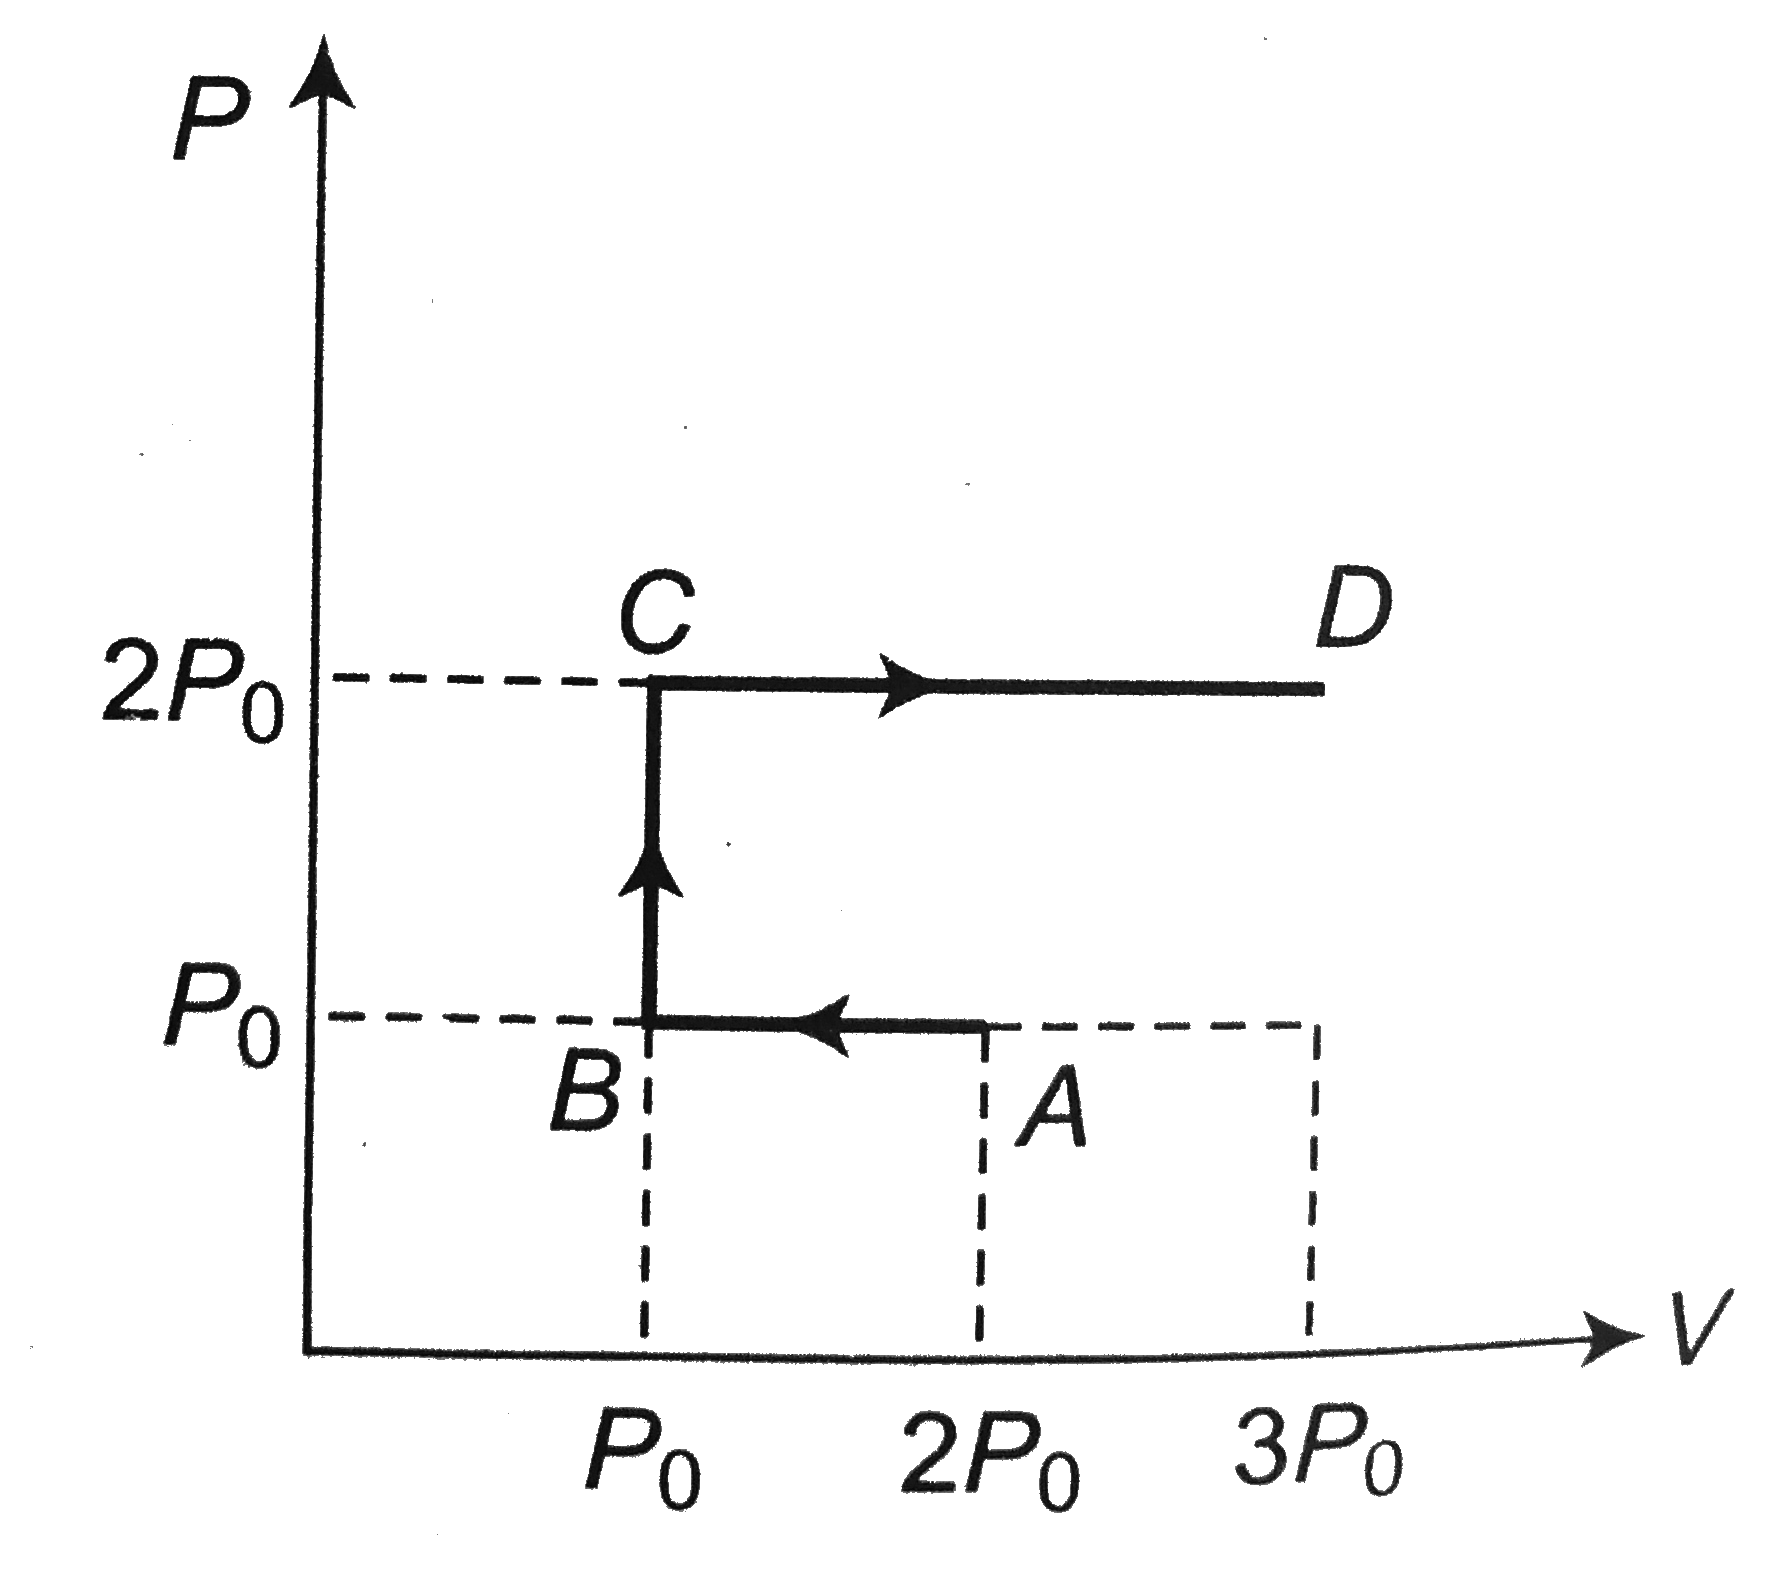
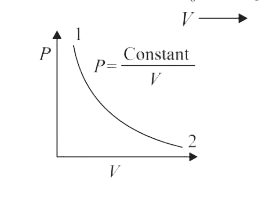
Consider p-V diagram for an ideal gas shown in figure.
Out of the following diagrams, which figure represents the T−p diagram ?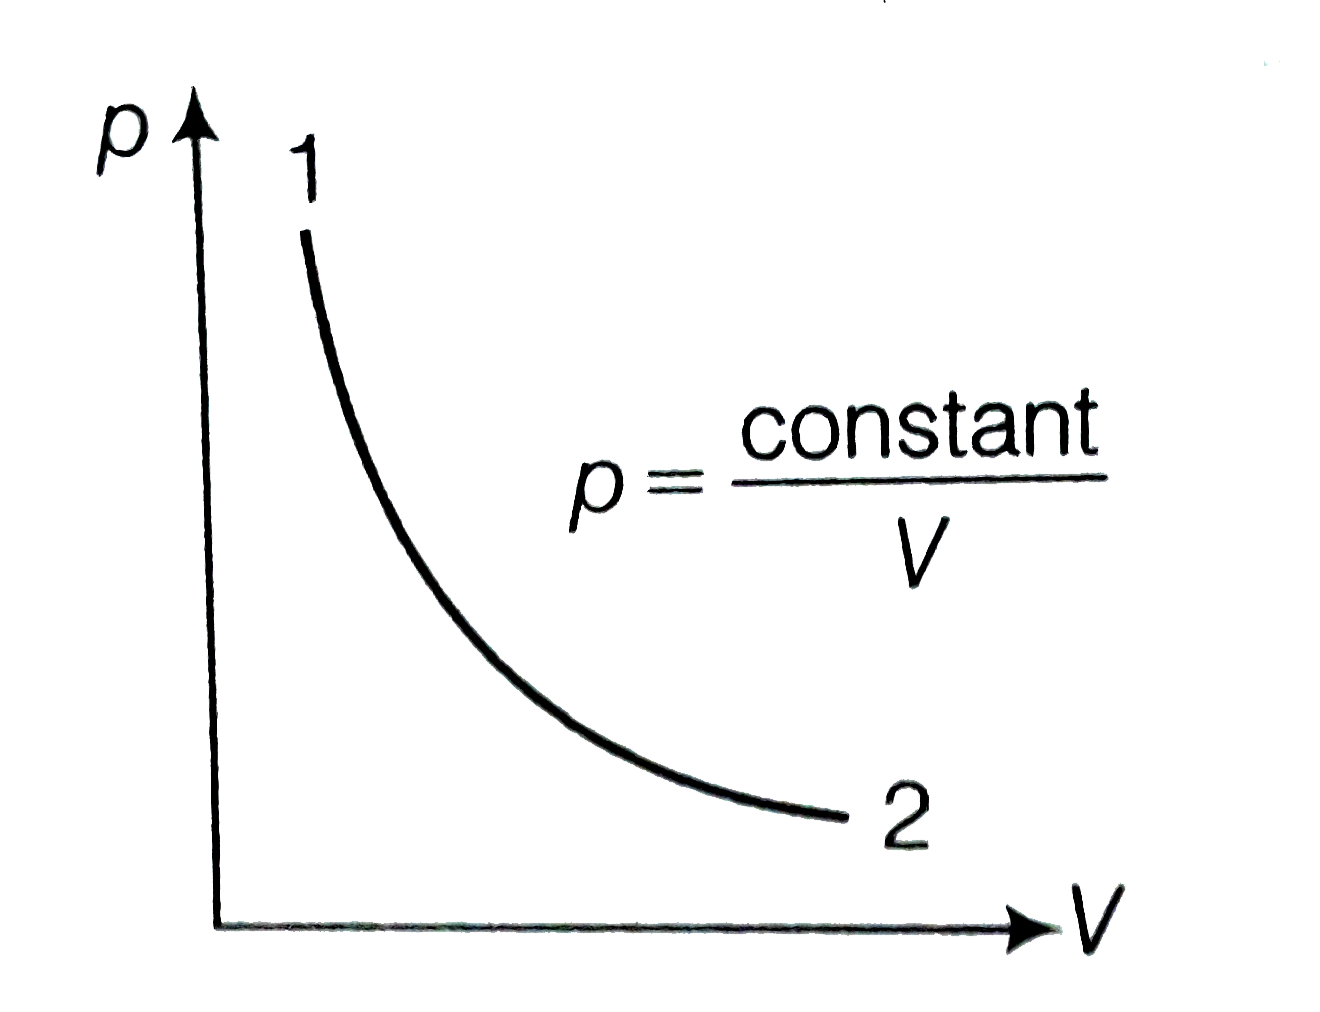
(i) 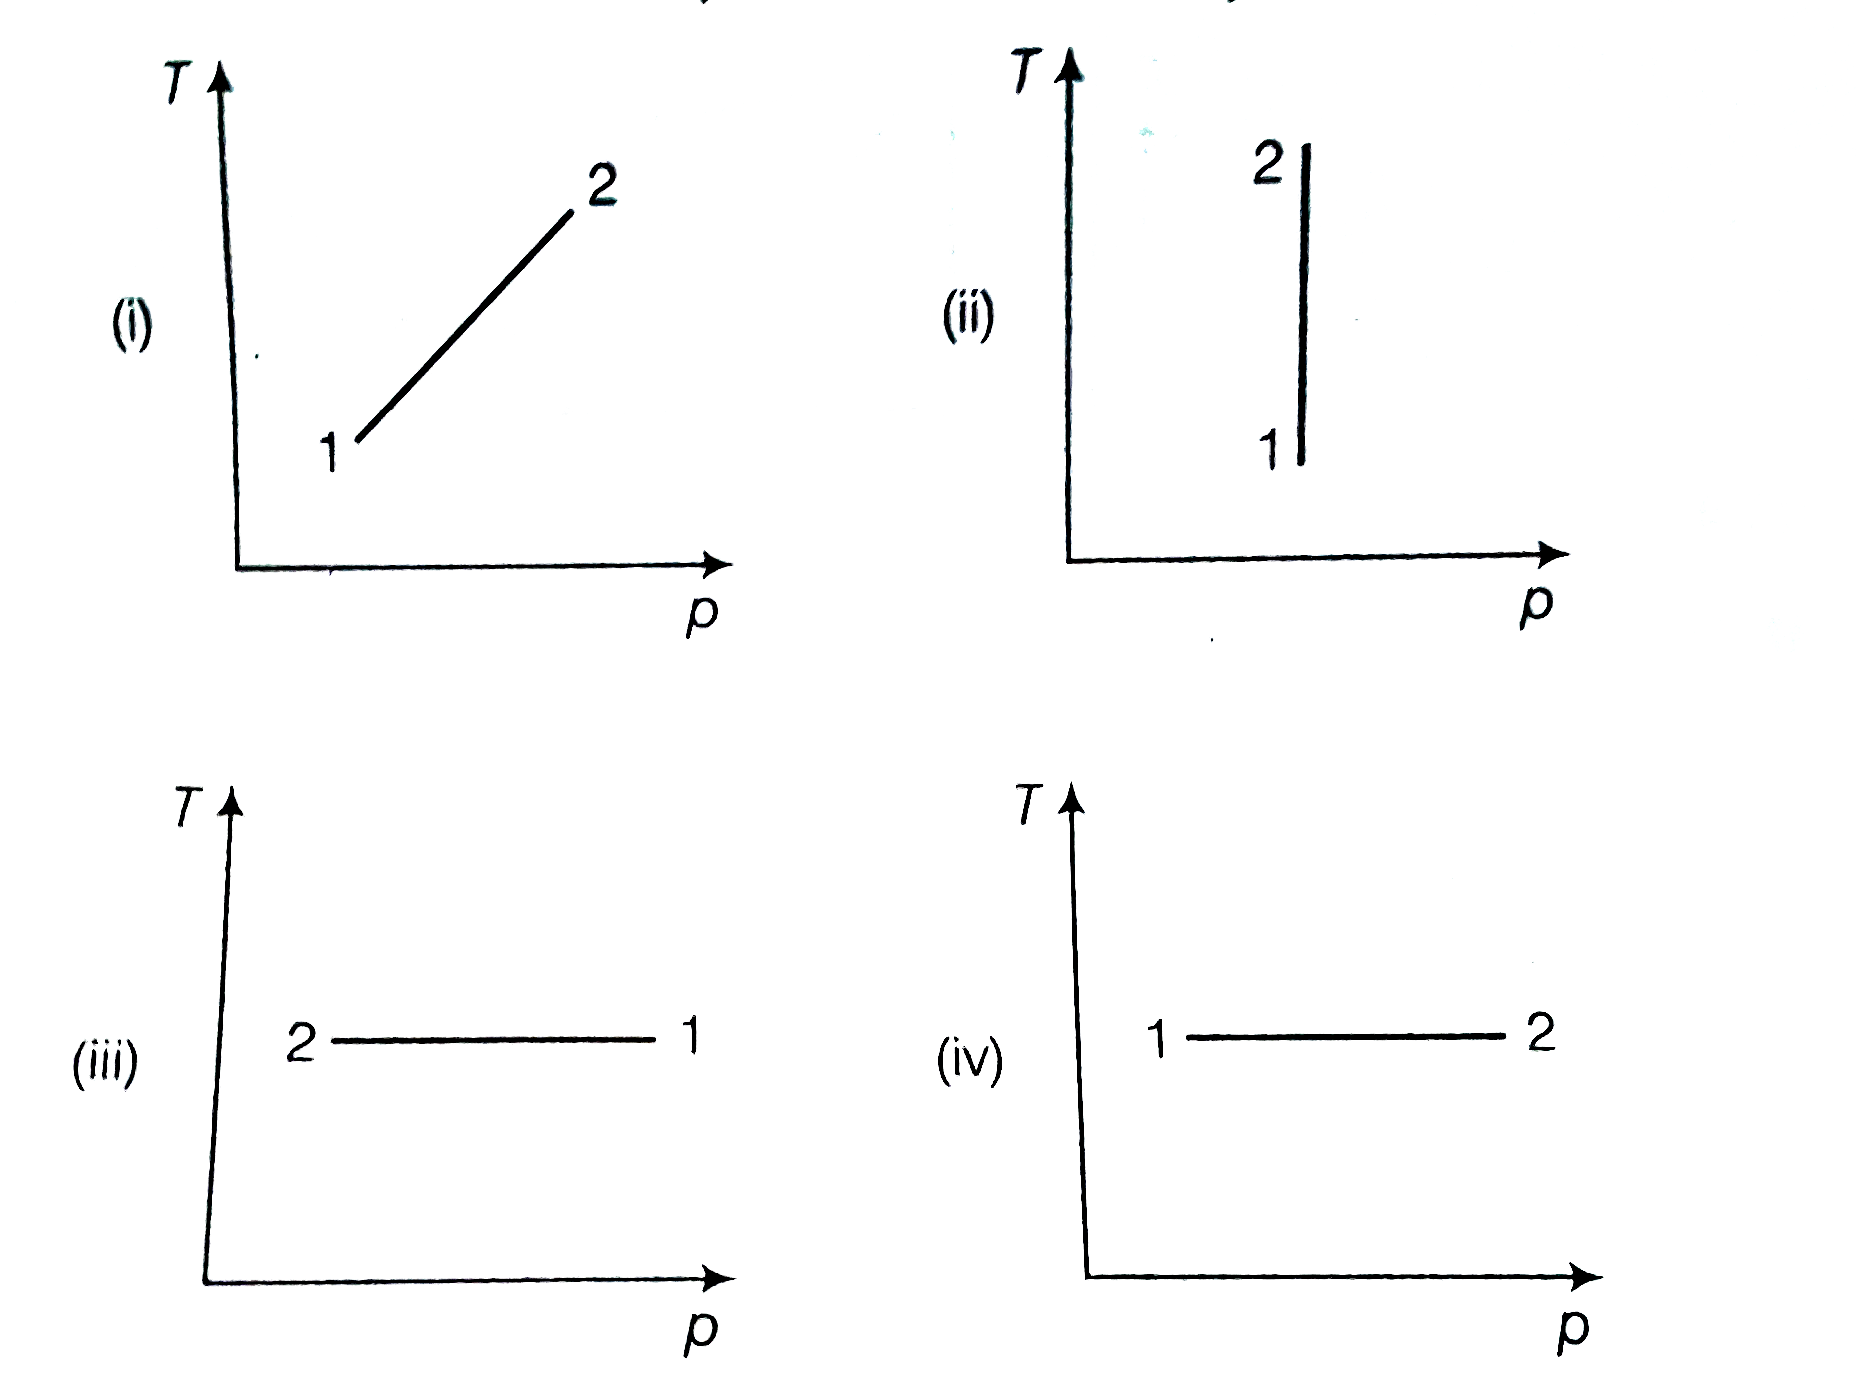
A
(iv)
B
(ii)
C
(iii)
D
(i)
Video Solution
Text Solution
The correct Answer is:C
In the givben diagram T is constant and P1>P2. Curve (iii) represents P1>P2 and straight line graph parallel to pressure axis indicates constant T.
|
Topper's Solved these Questions
- THERMODYNAMICSBook:NCERT FINGERTPS ENGLISHChapter:THERMODYNAMICSExercise:HOTs
Explore 8 Videos
- THERMODYNAMICSBook:NCERT FINGERTPS ENGLISHChapter:THERMODYNAMICSExercise:Assertion & Reason
Explore 15 Videos
- THERMAL PROPERTIES OF MATTERBook:NCERT FINGERTPS ENGLISHChapter:THERMAL PROPERTIES OF MATTERExercise:Assertion And Reason
Explore 10 Videos
- UNITS AND MEASUREMENTSBook:NCERT FINGERTPS ENGLISHChapter:UNITS AND MEASUREMENTSExercise:Assertion And Reason
Explore 15 Videos
Similar Questions
Knowledge Check
Which of the following P-V diagram represent the graph of isometric process?
A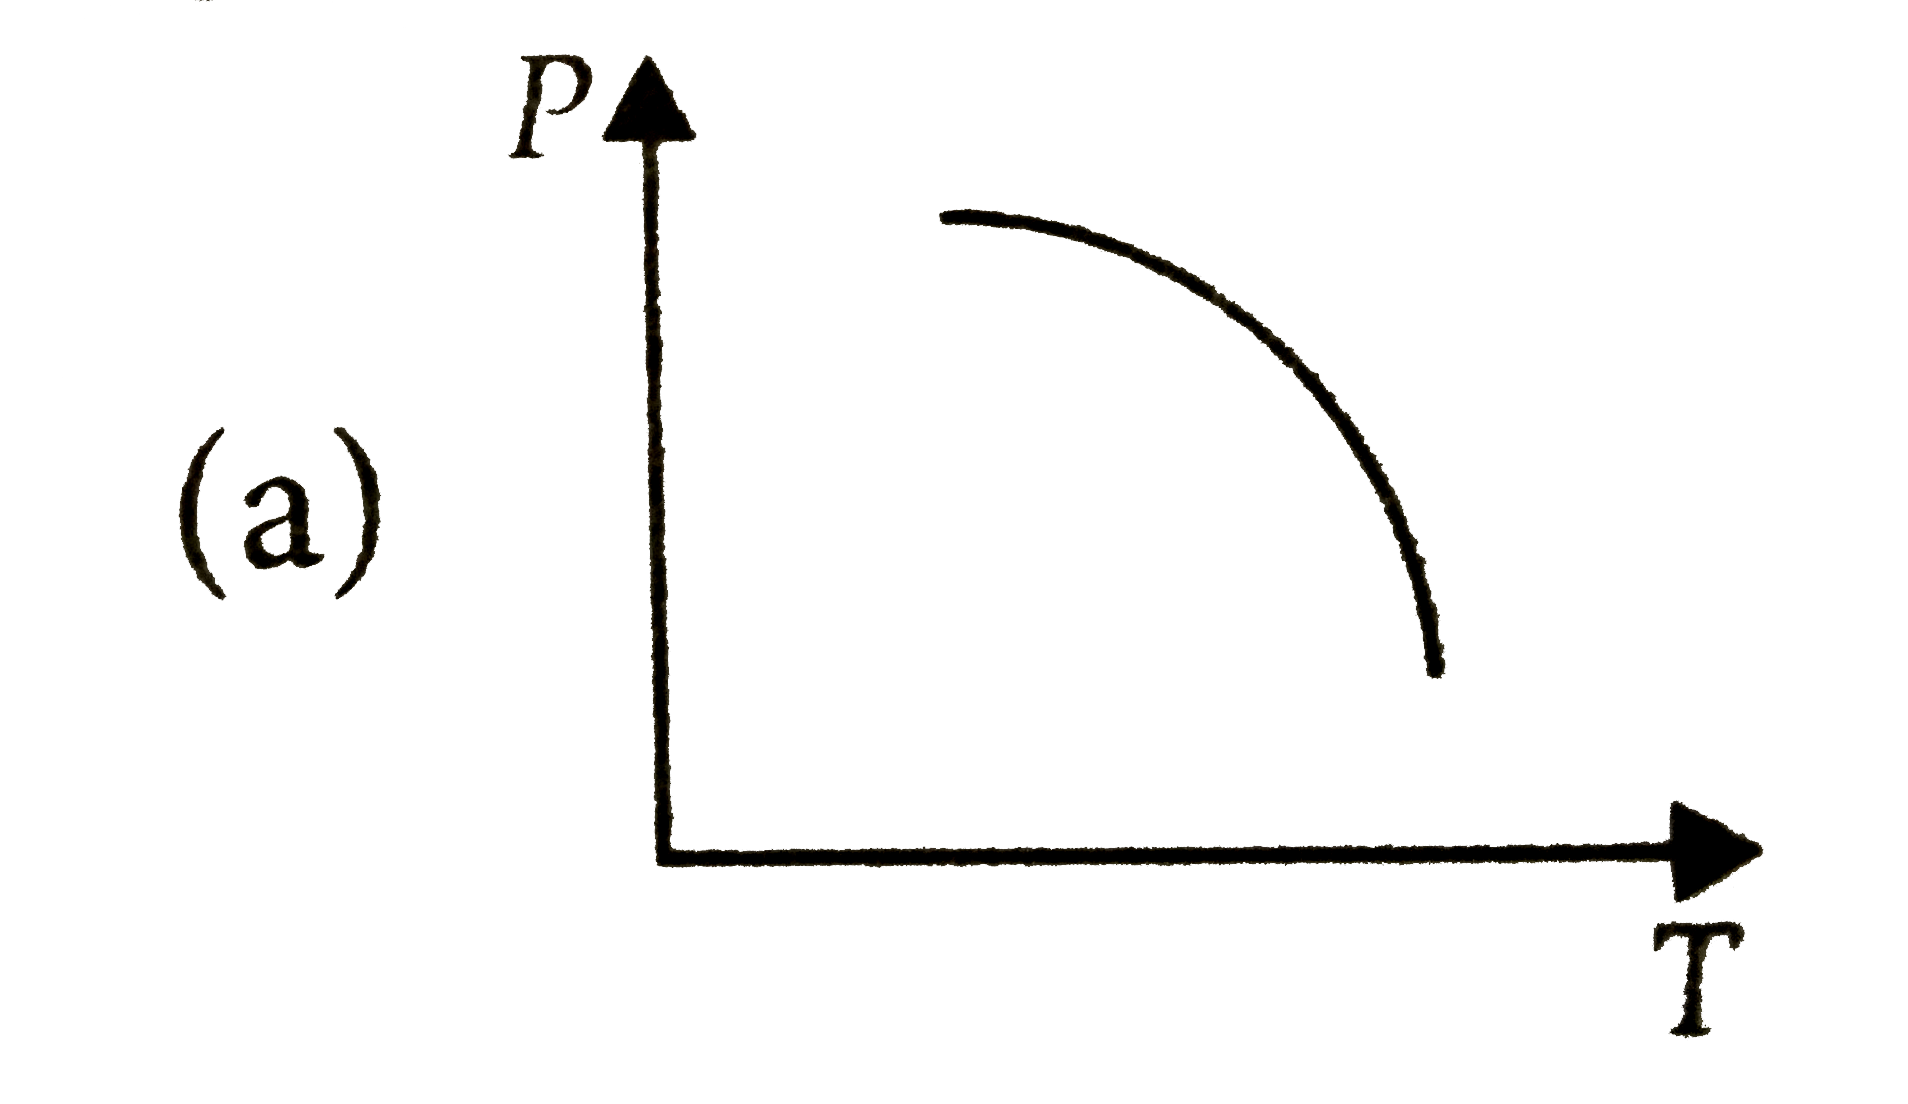 B
B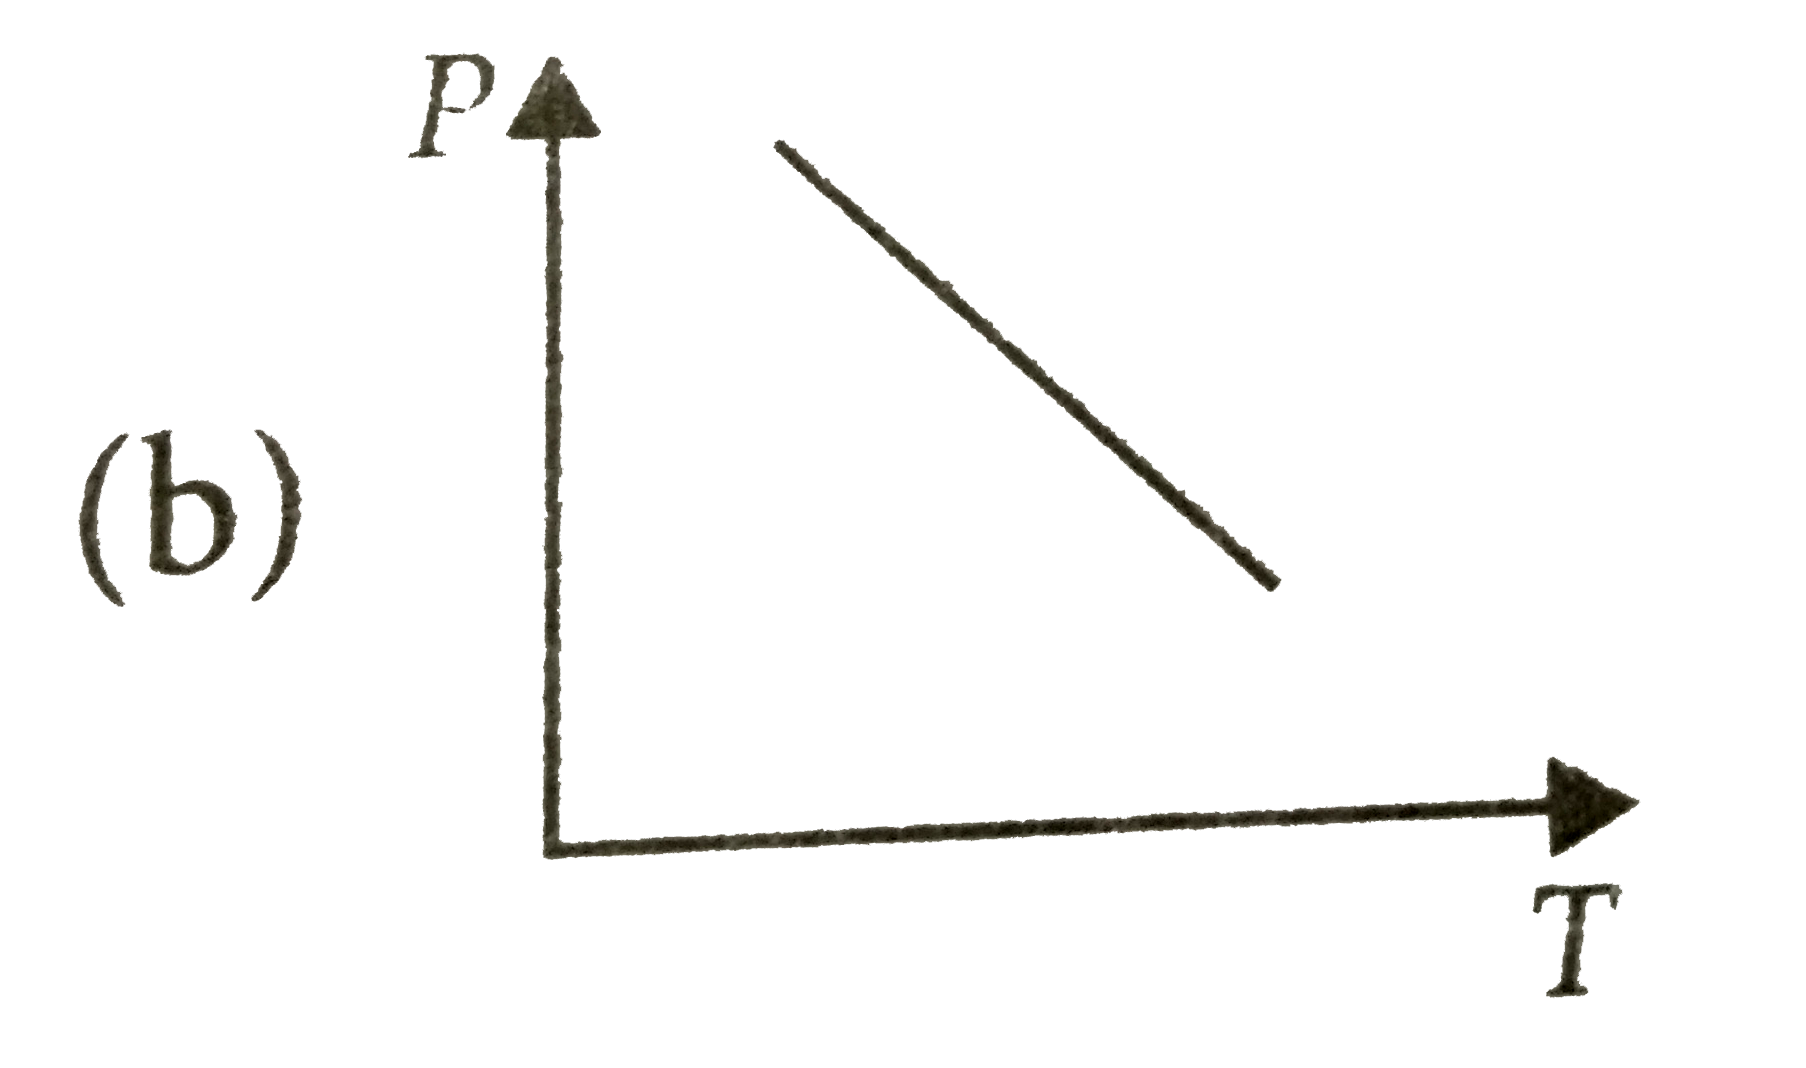 C
C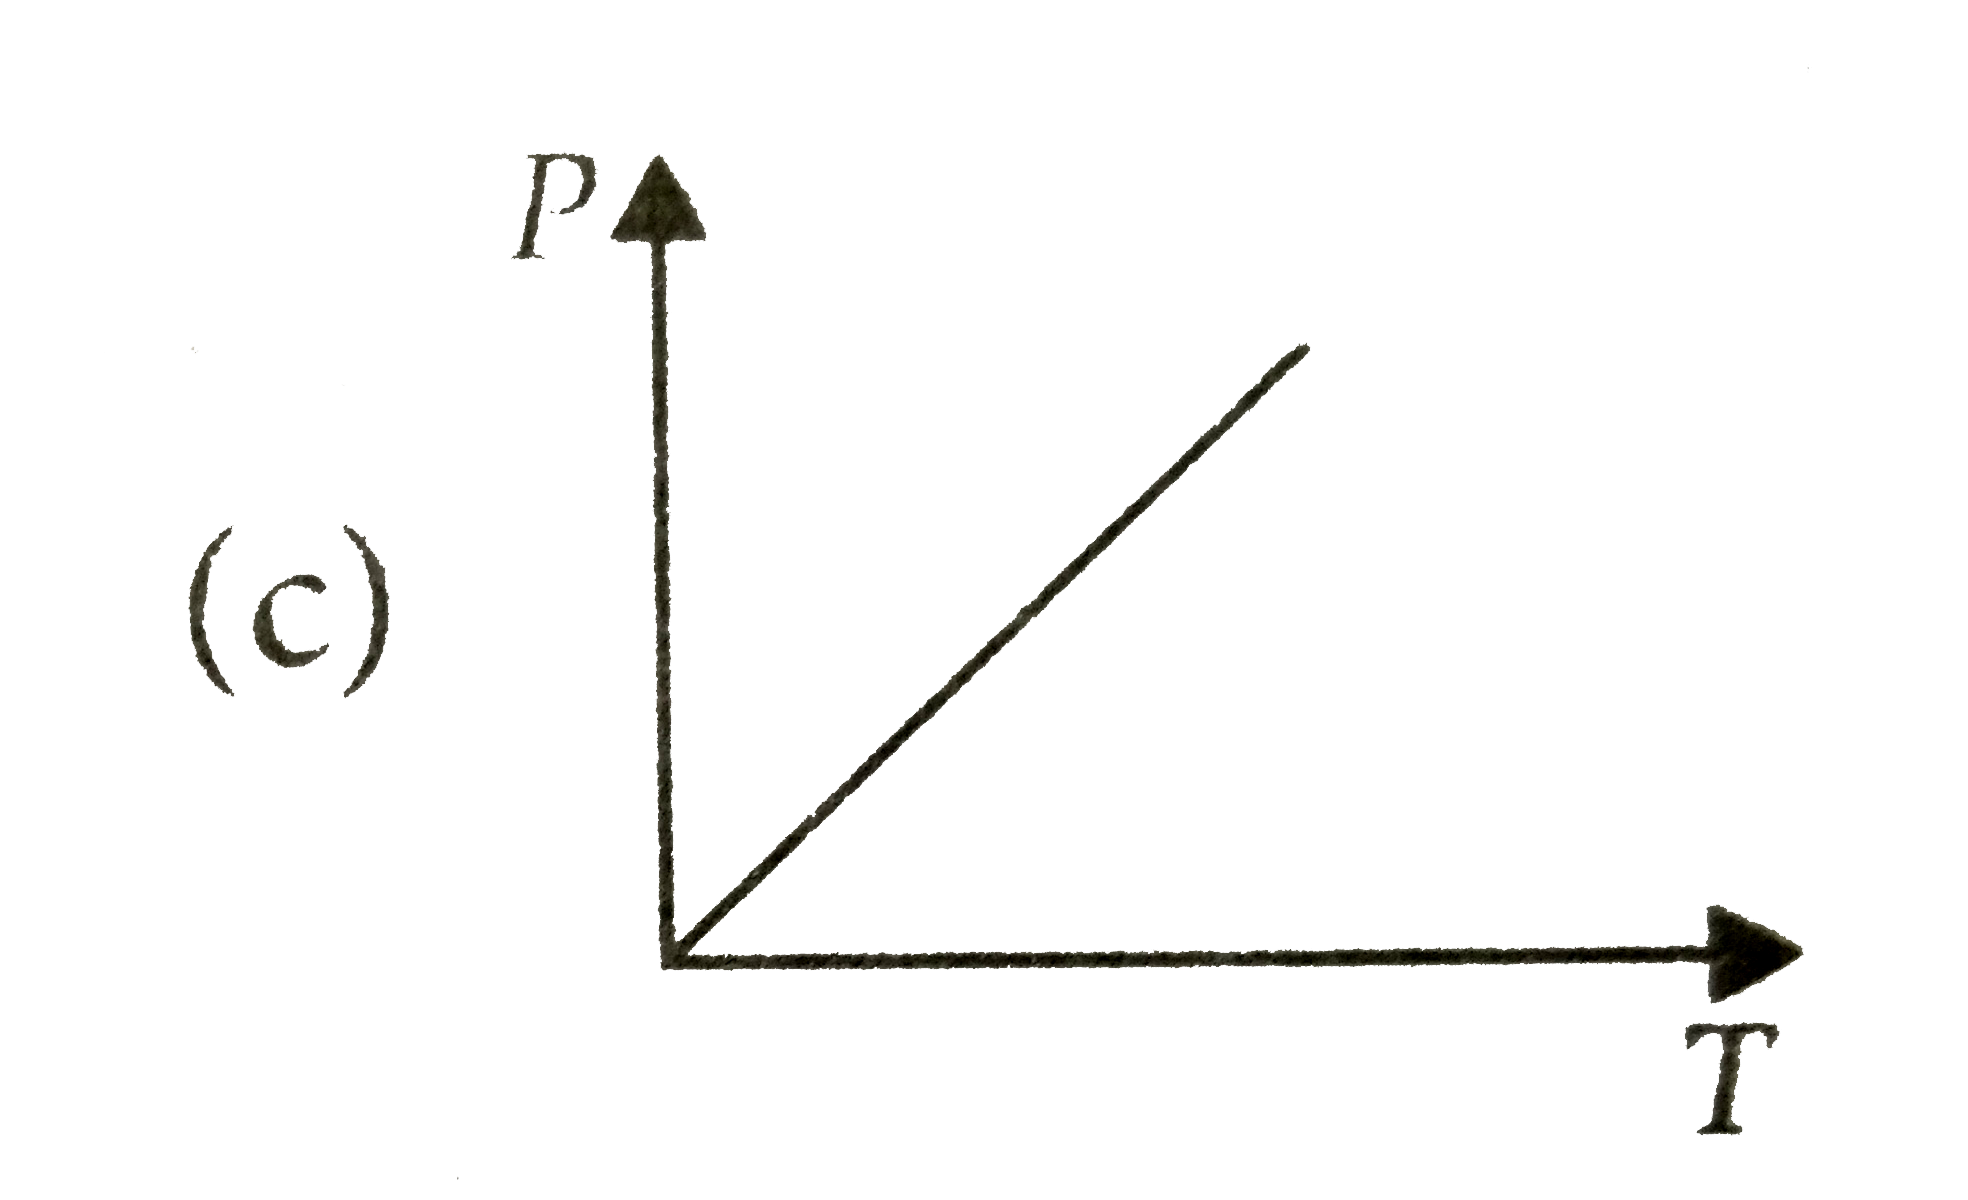 D
D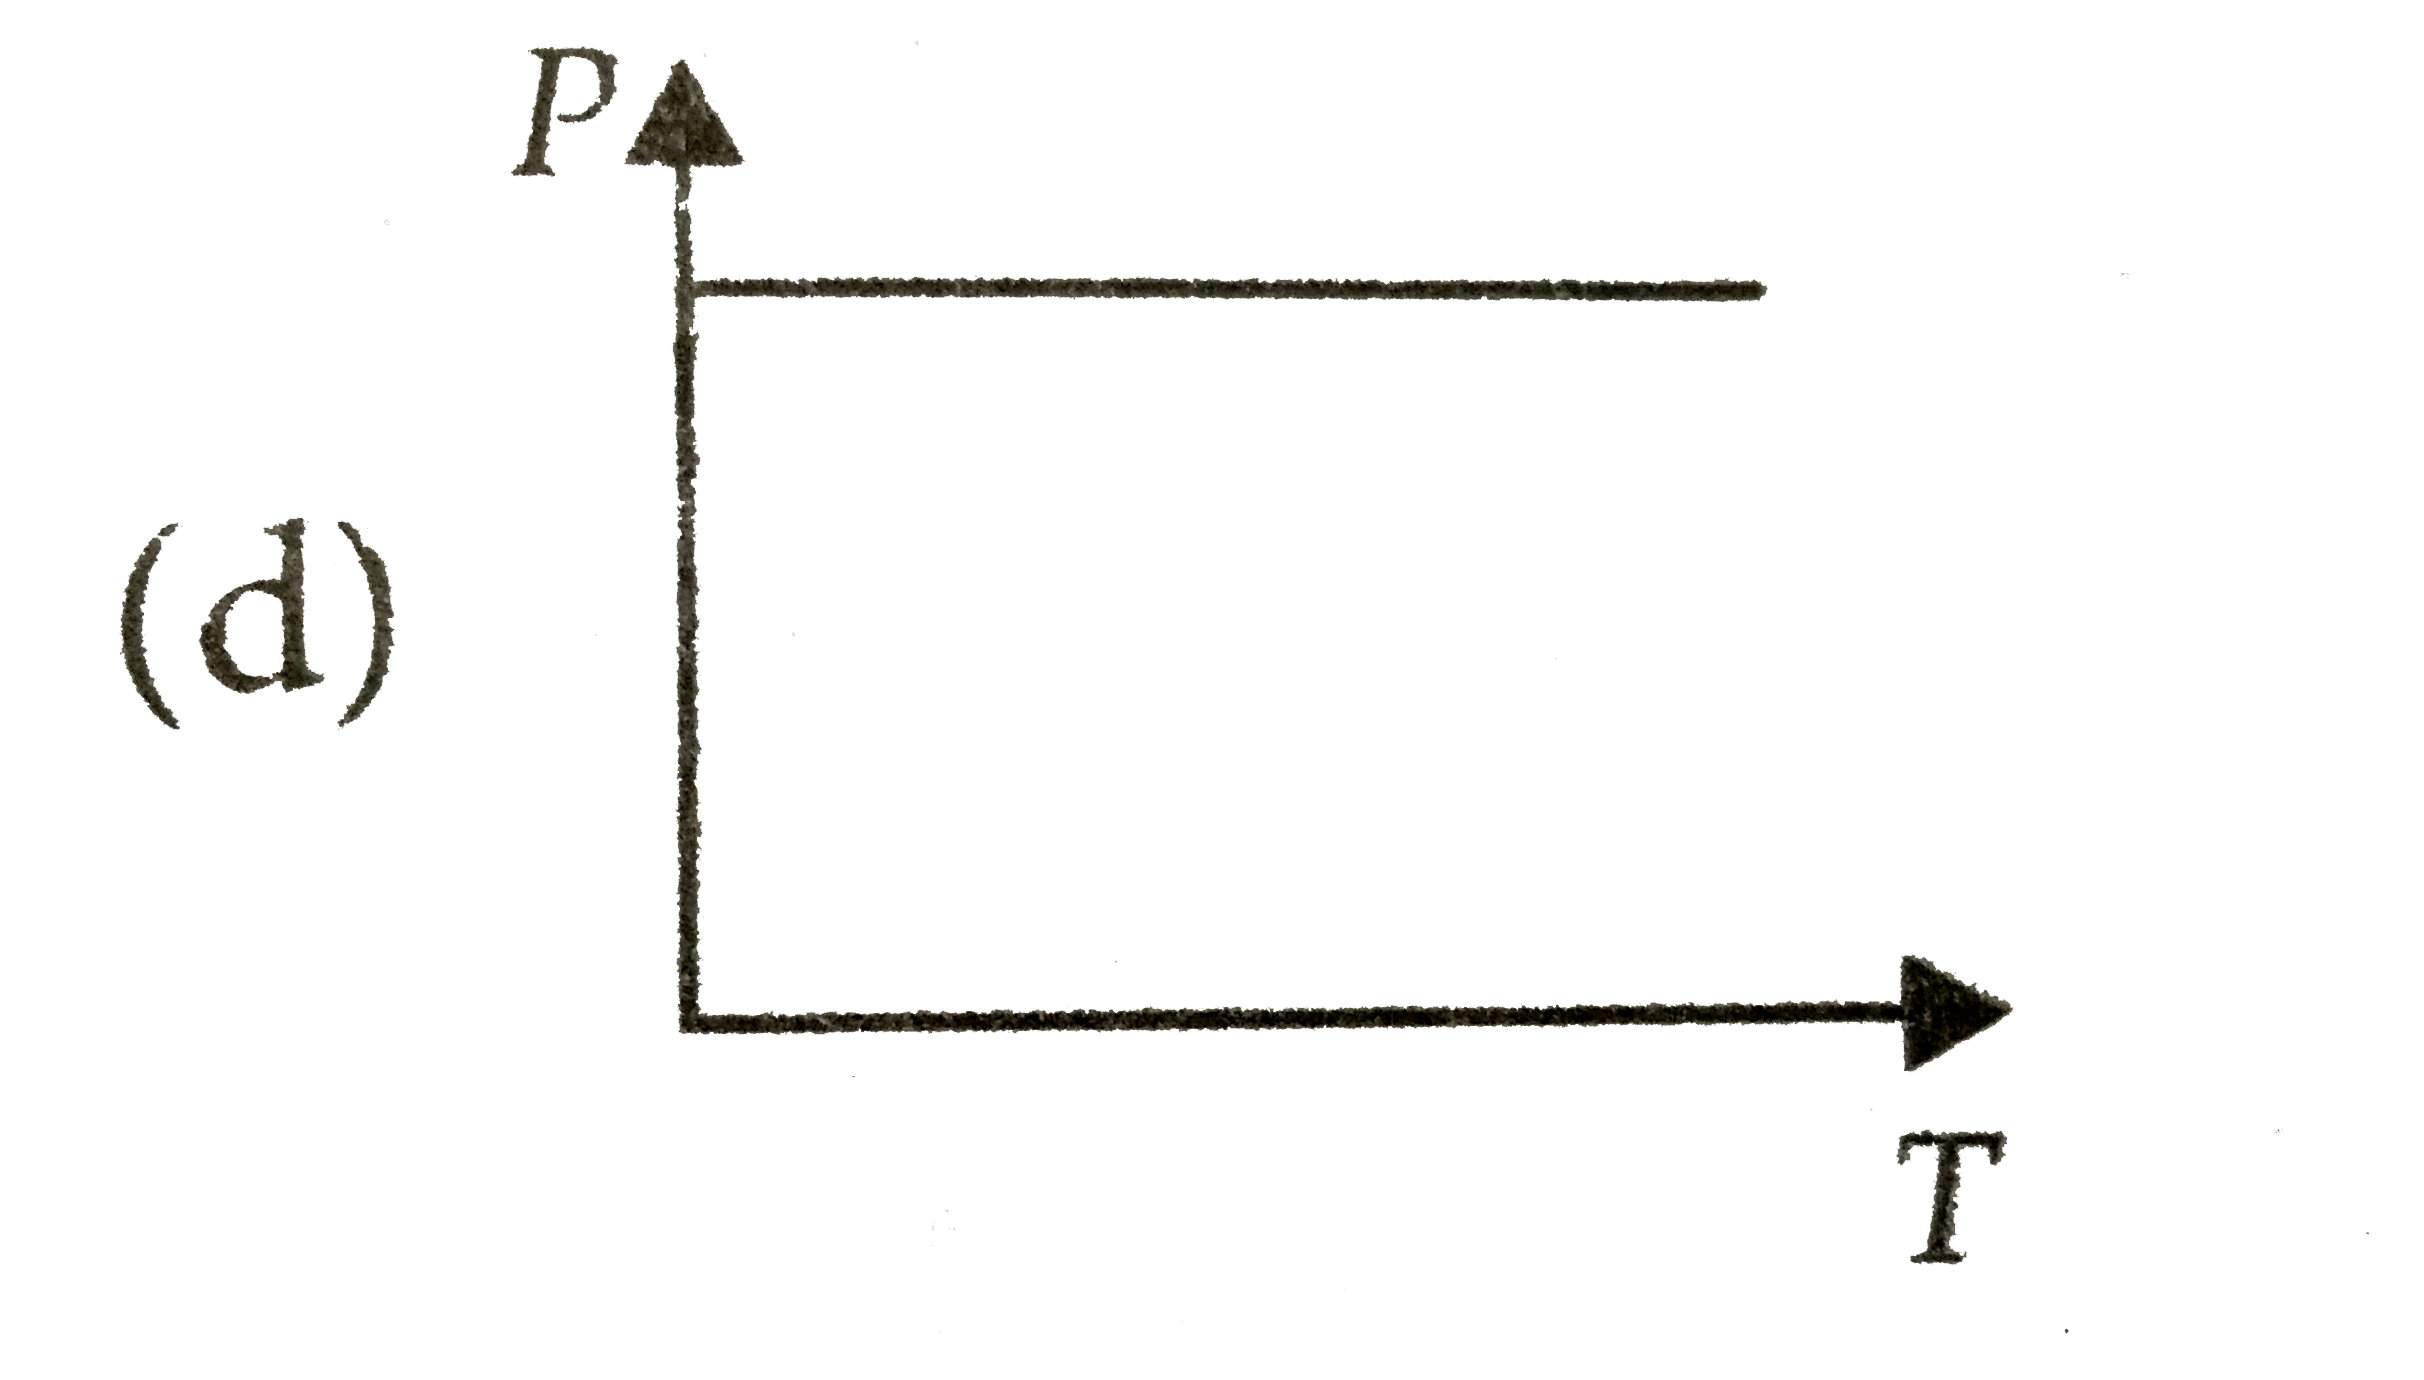
For the diagram given for an ideal gas, out of the following which one correctly represent the diagram?
View SolutionWhich of the following diagrams (figure) depicts ideal gas behaviour?
View SolutionP−T diagram is shown in Fig. Choose the corresponding V−T diagram.
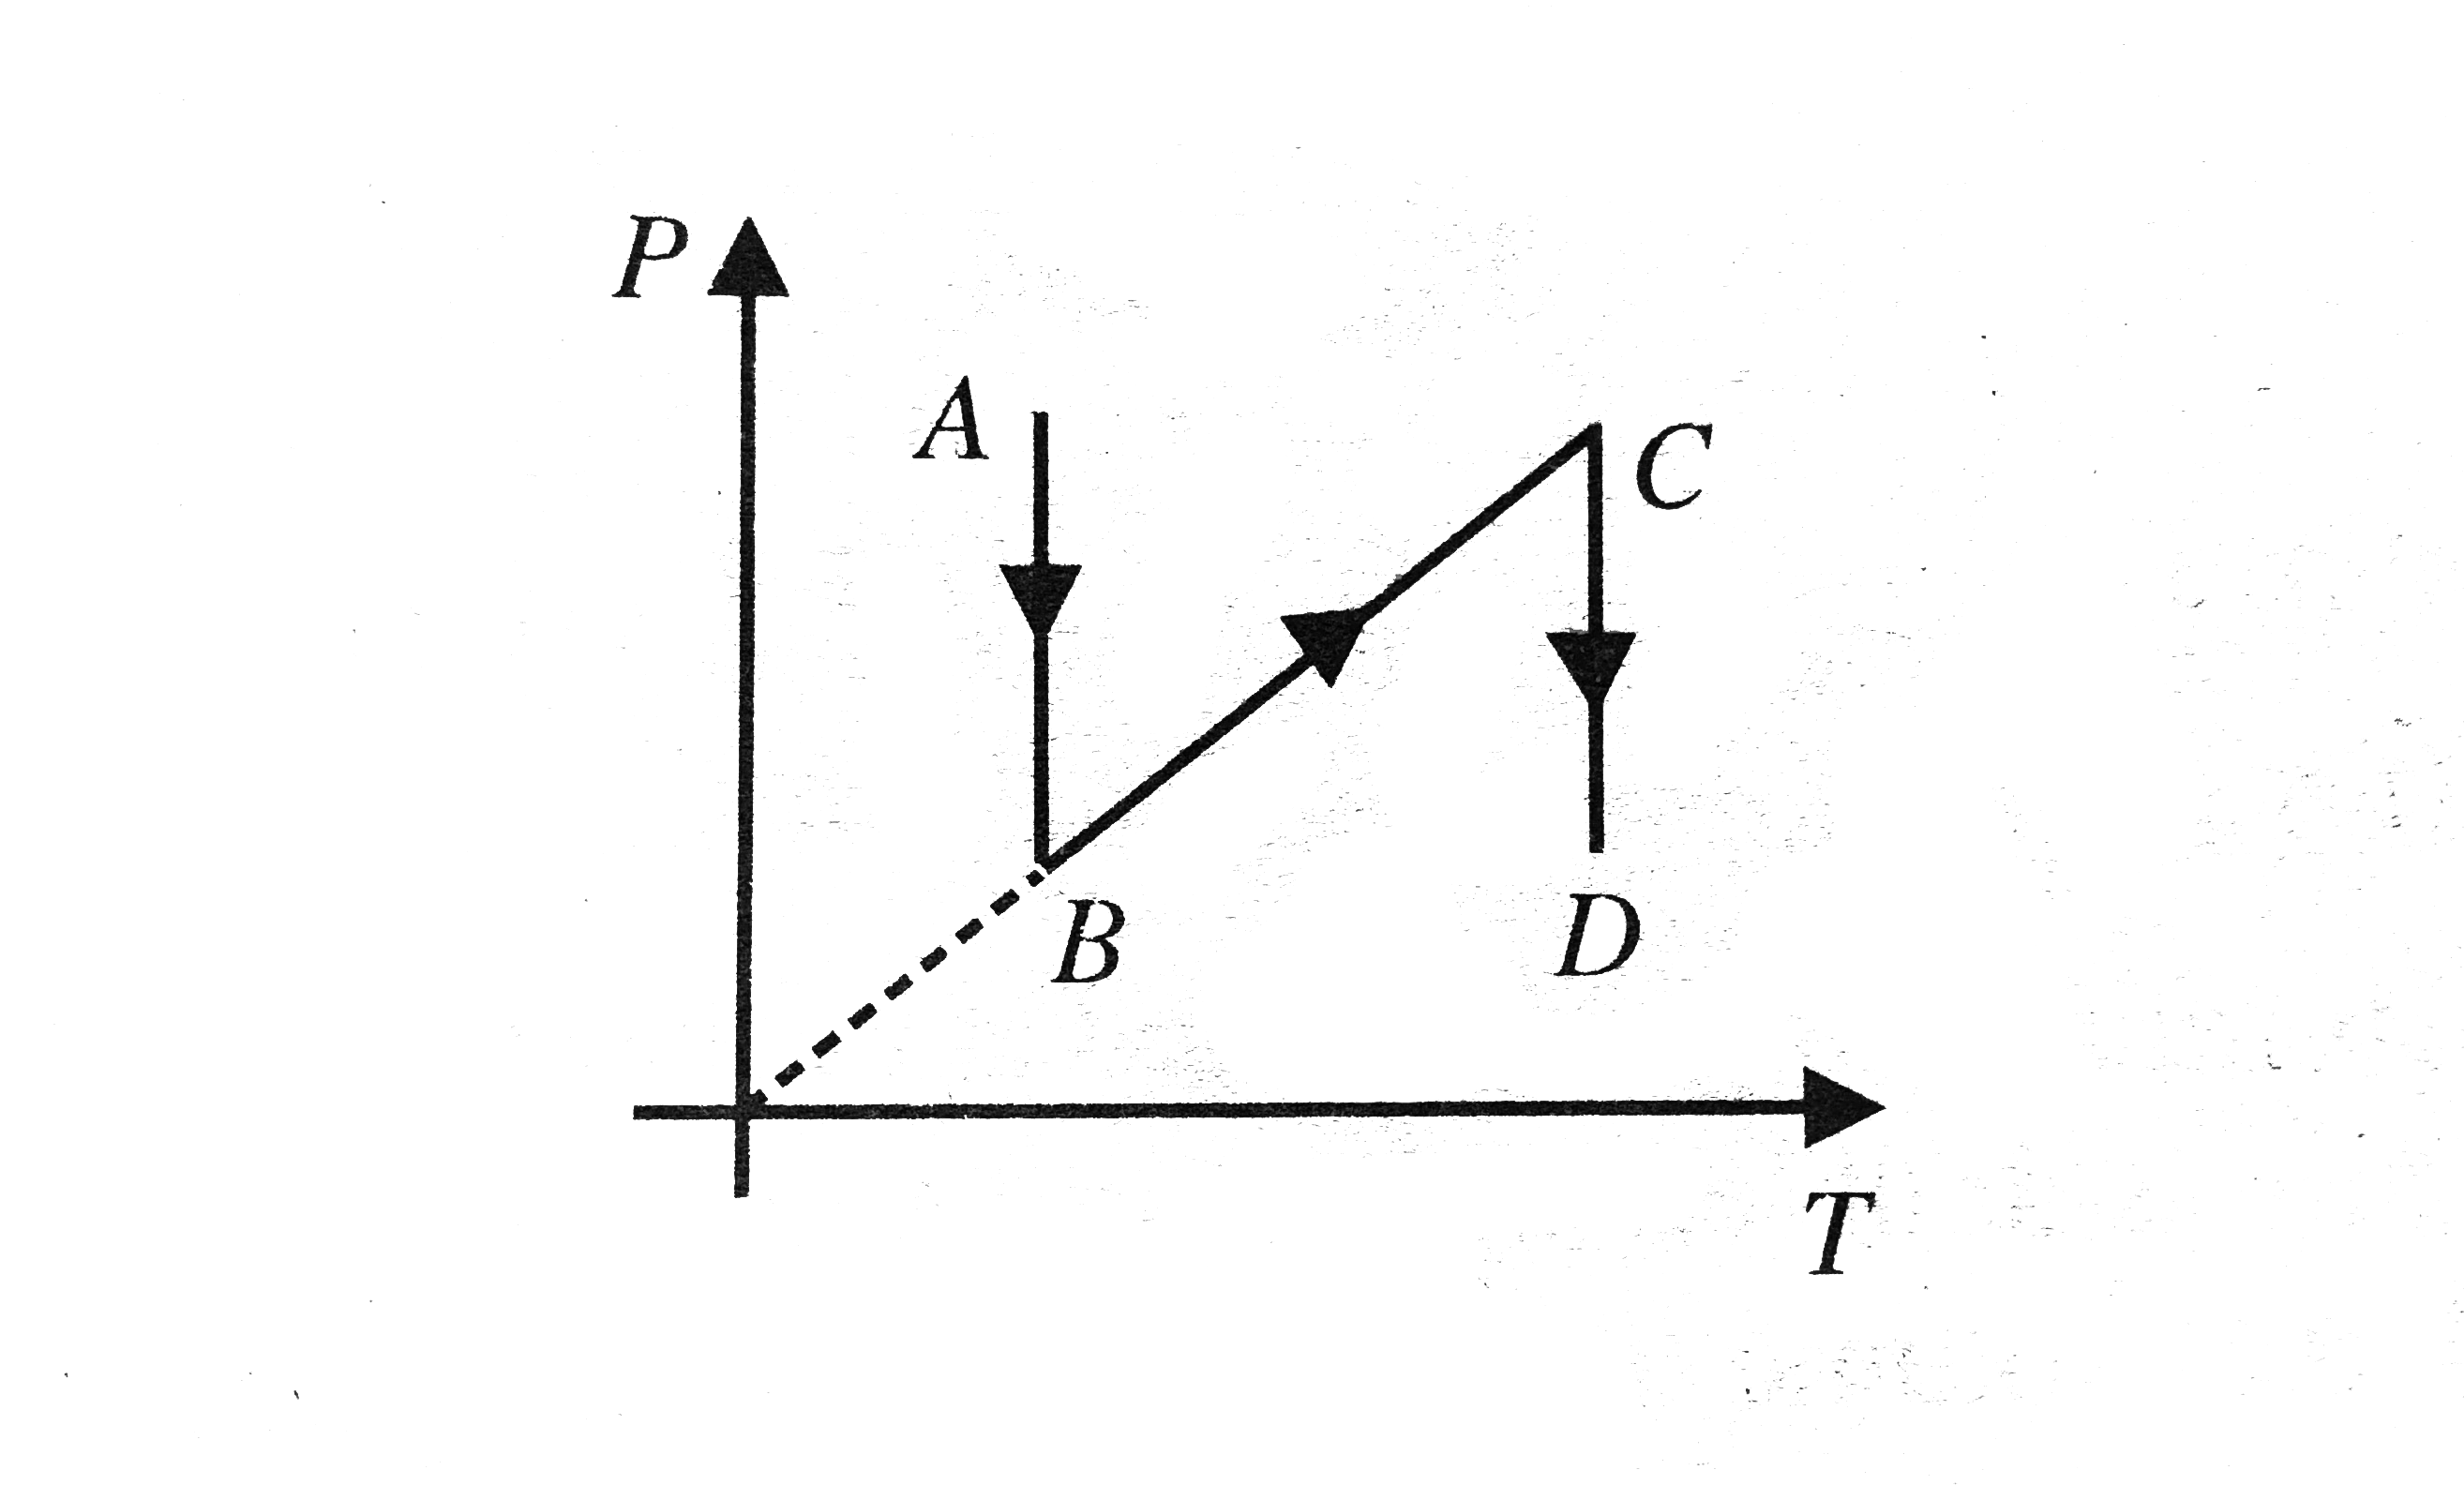
View SolutionP−T diagram is shown in Fig. Choose the corresponding V−T diagram.

View SolutionThe PT diagram for an ideal gas is shown in the figure, where AC is an adiabatic process, find the corresponding PV diagram.
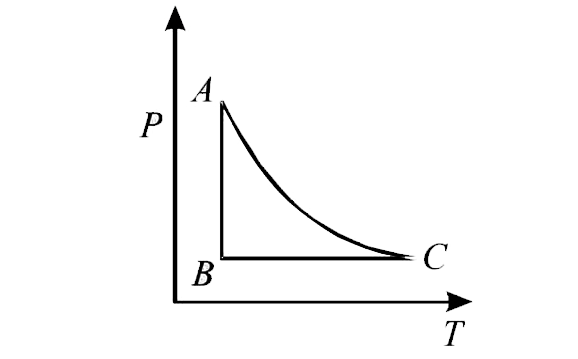
View SolutionThe PT diagram for an ideal gas is shown in the figure, where AC is an adiabatic process, find the corresponding PV diagram.

View SolutionIn P−V diagram shown below,
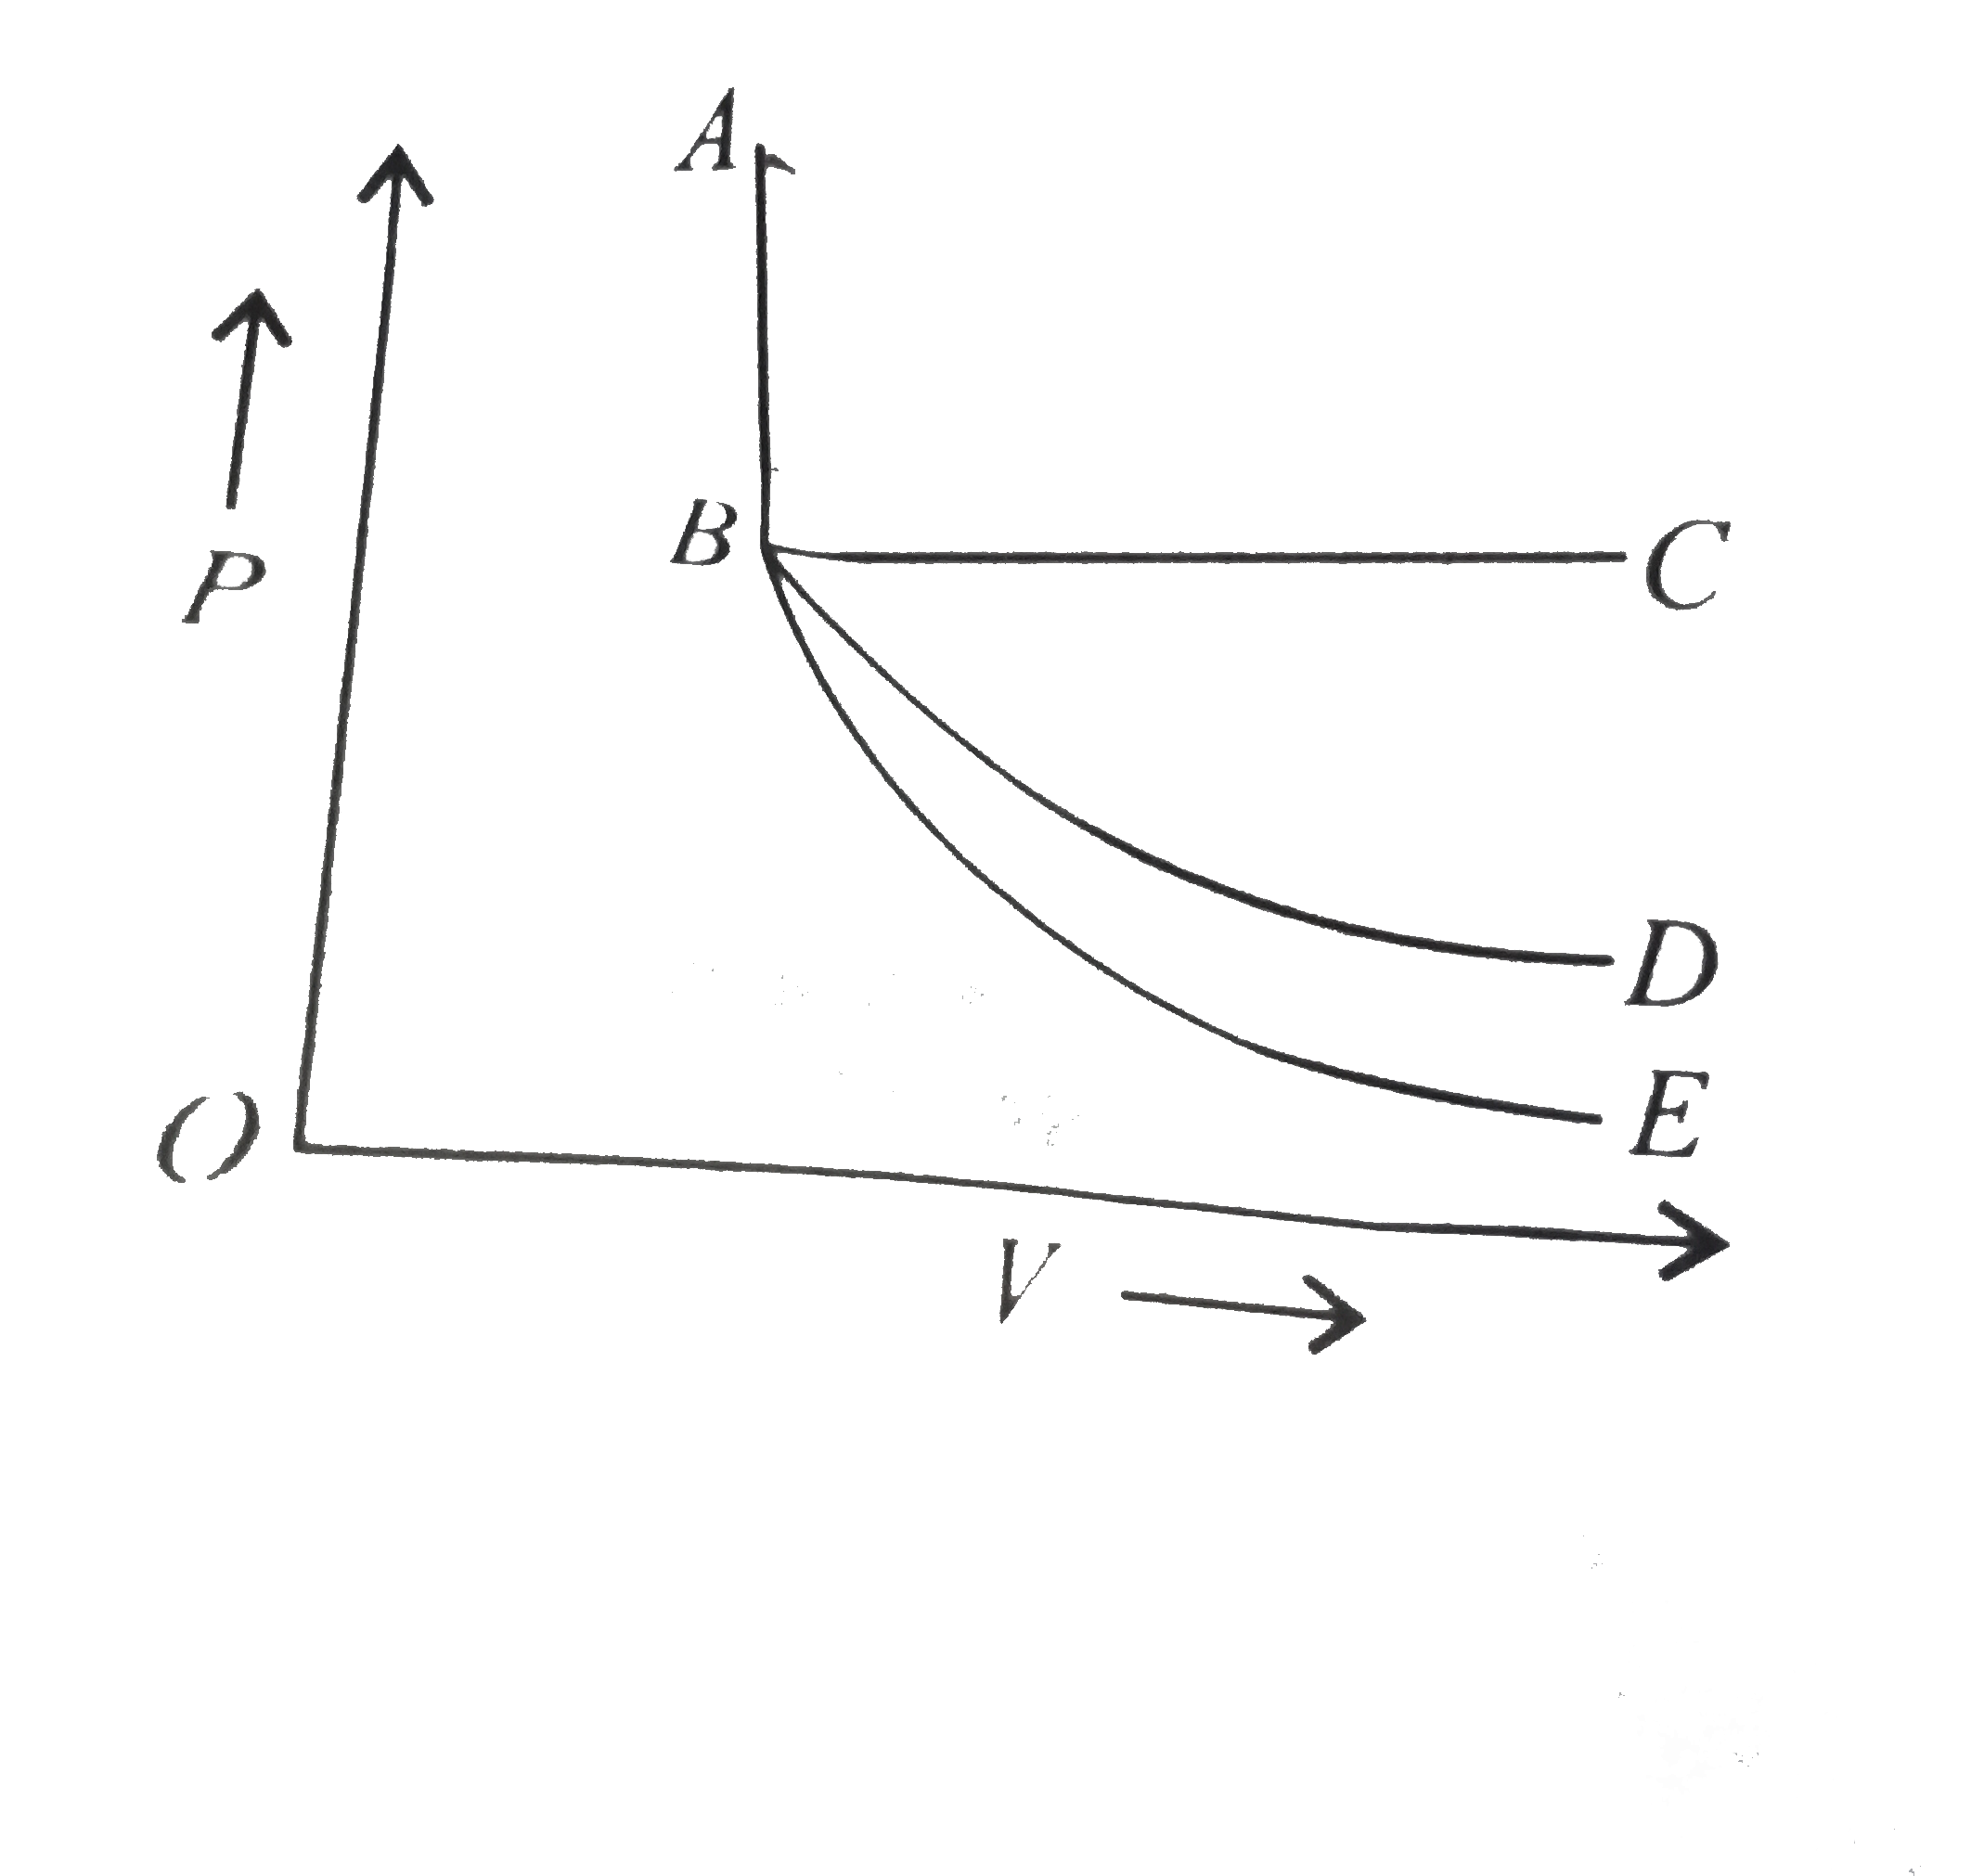
View Solution


