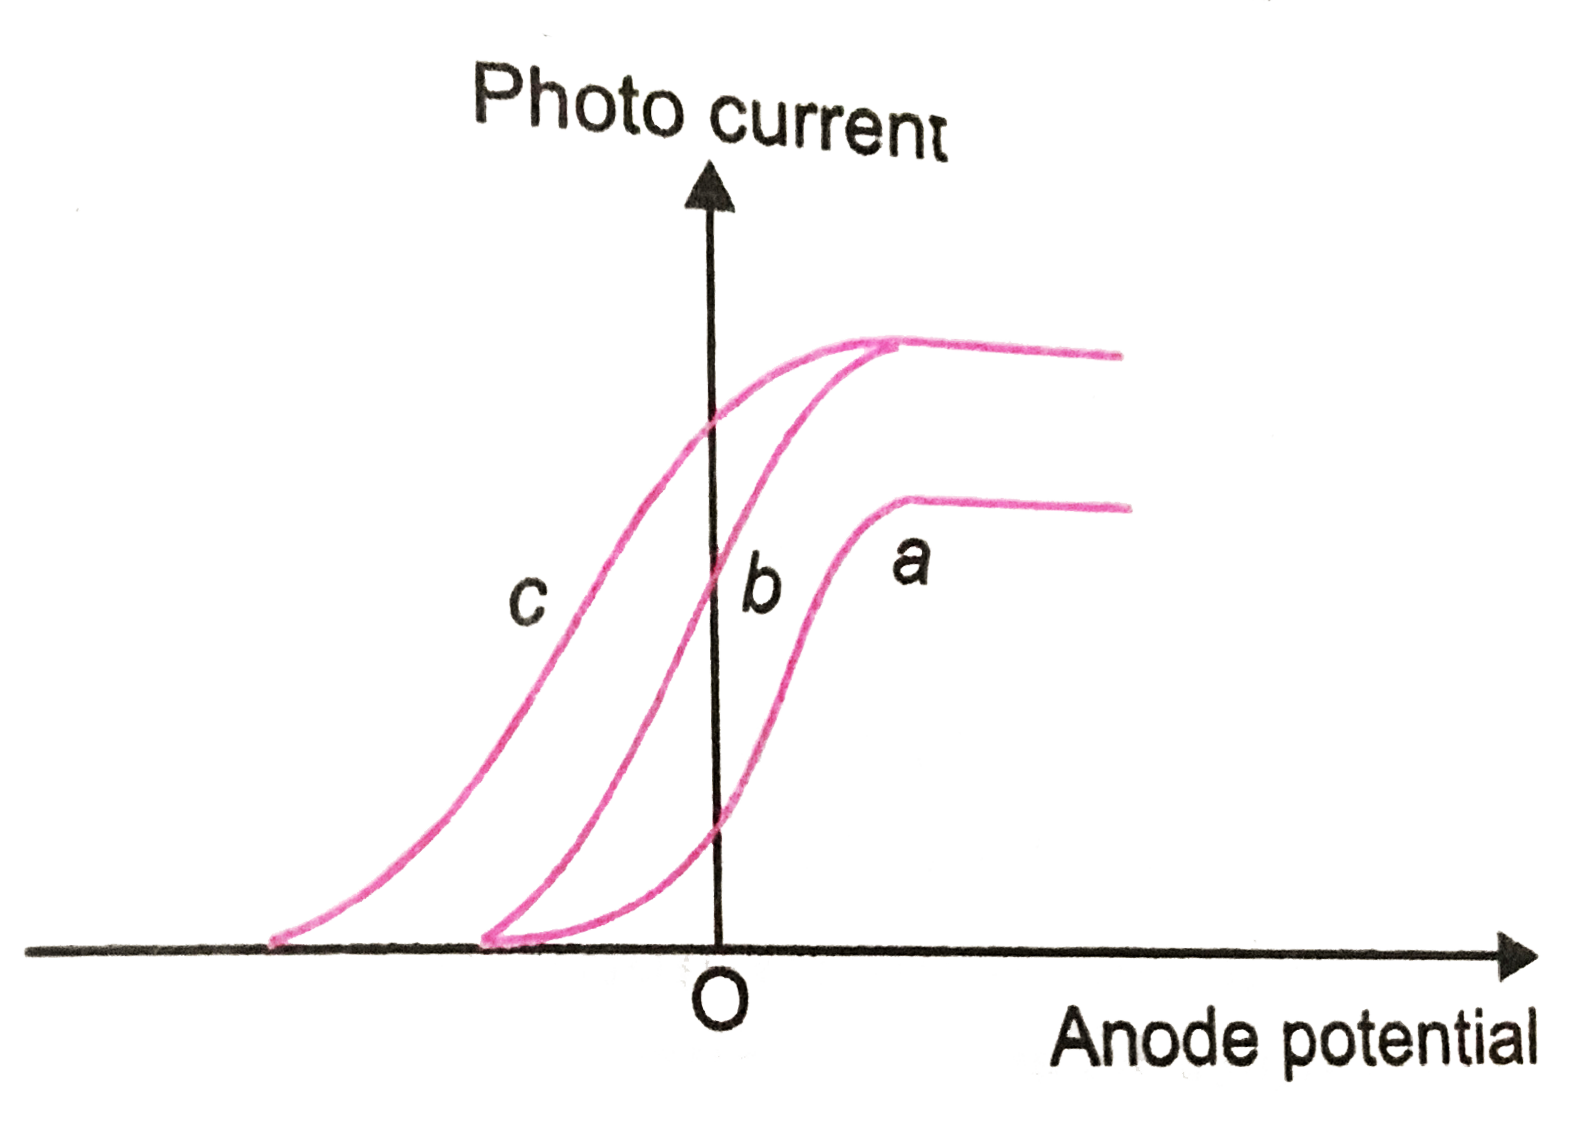
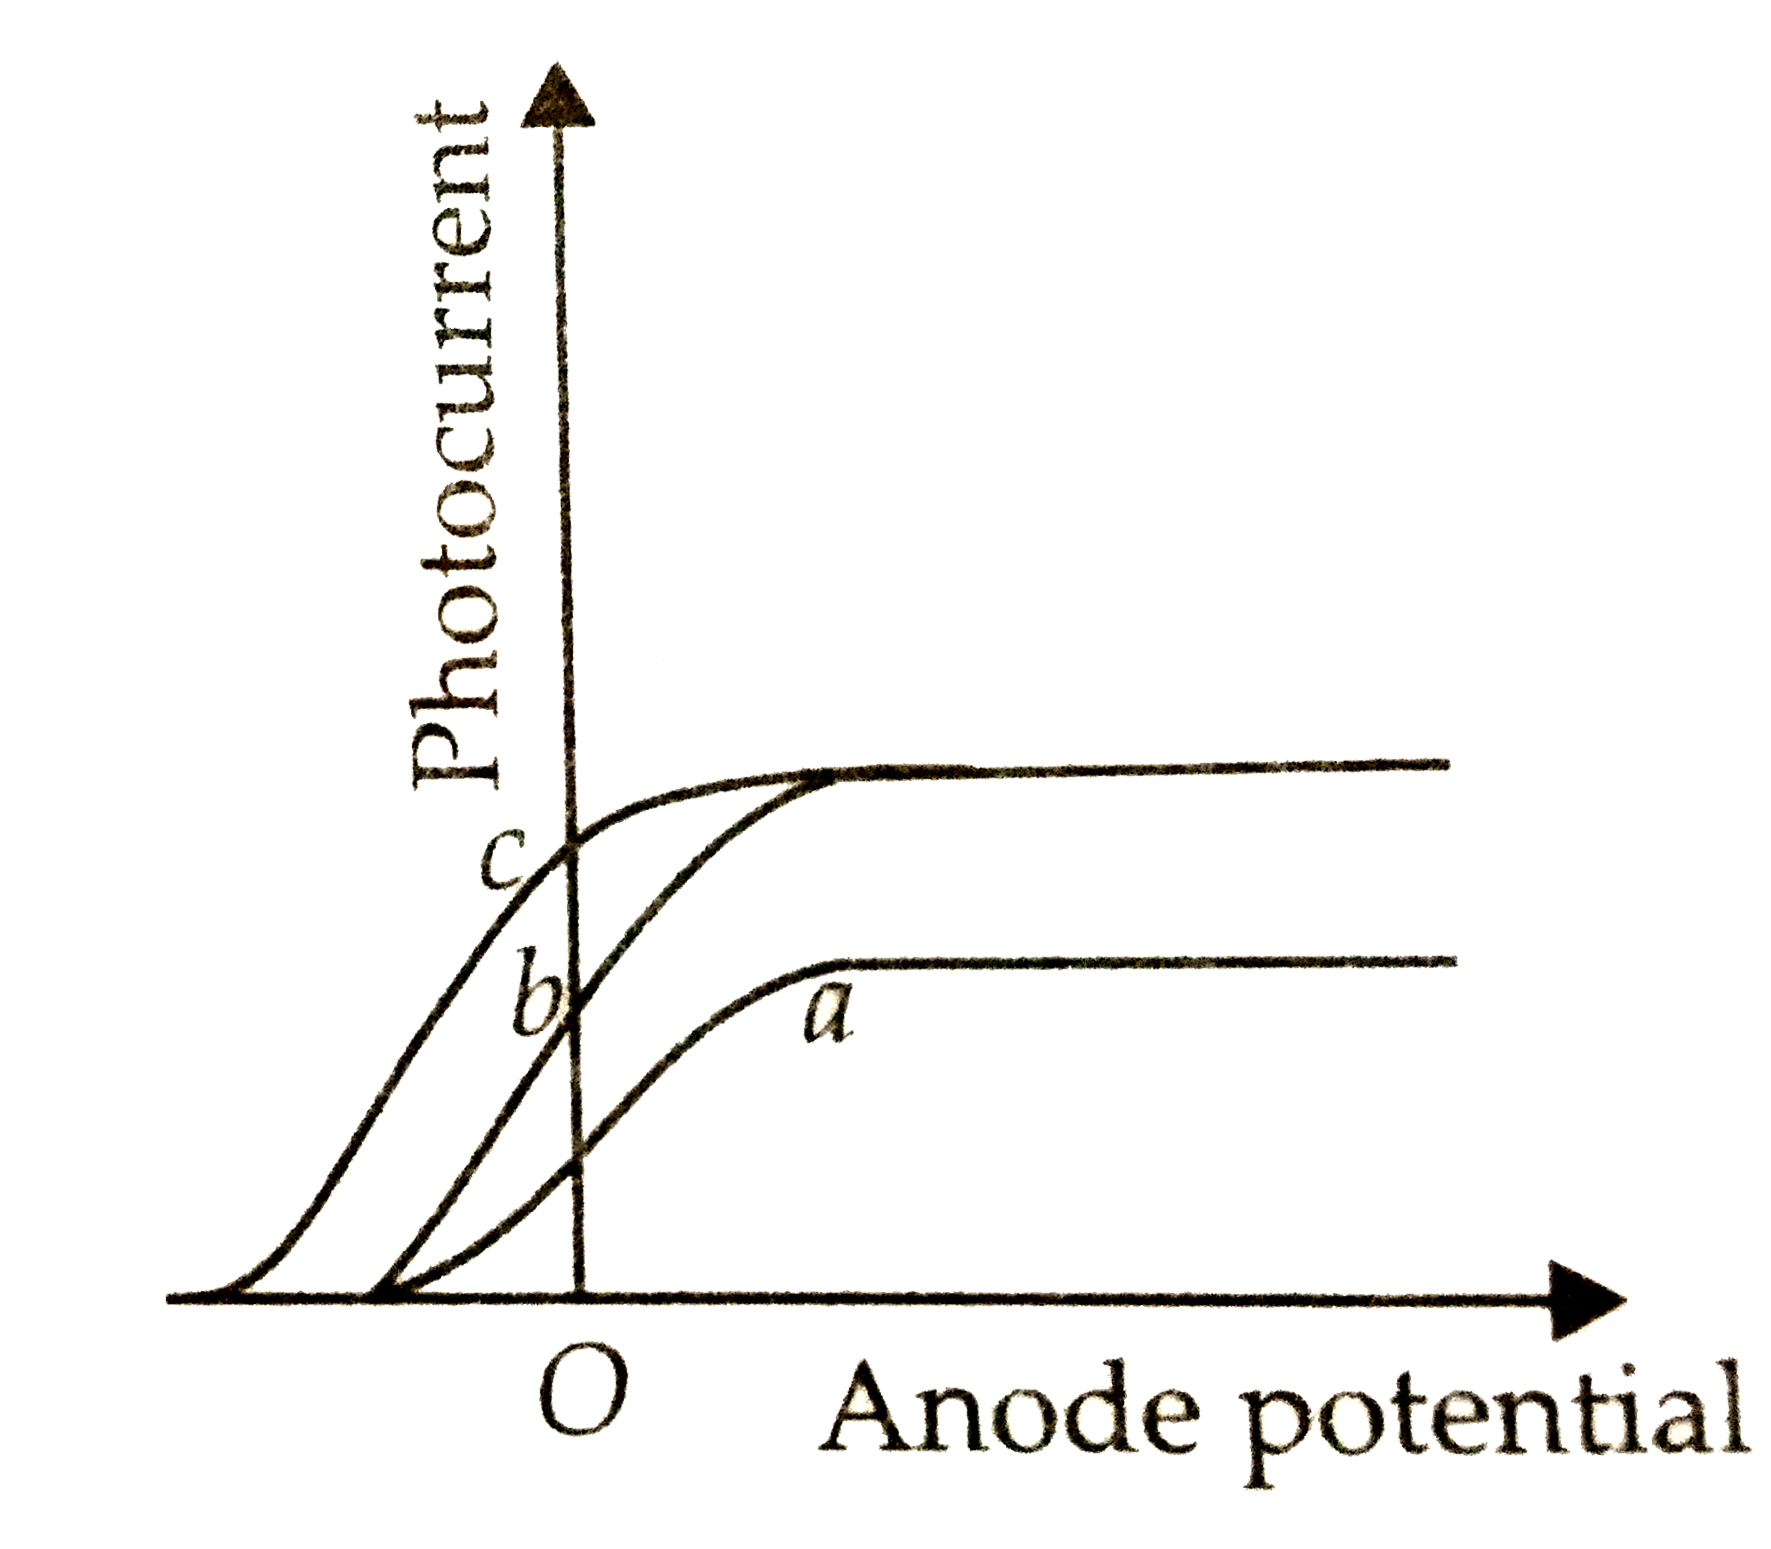
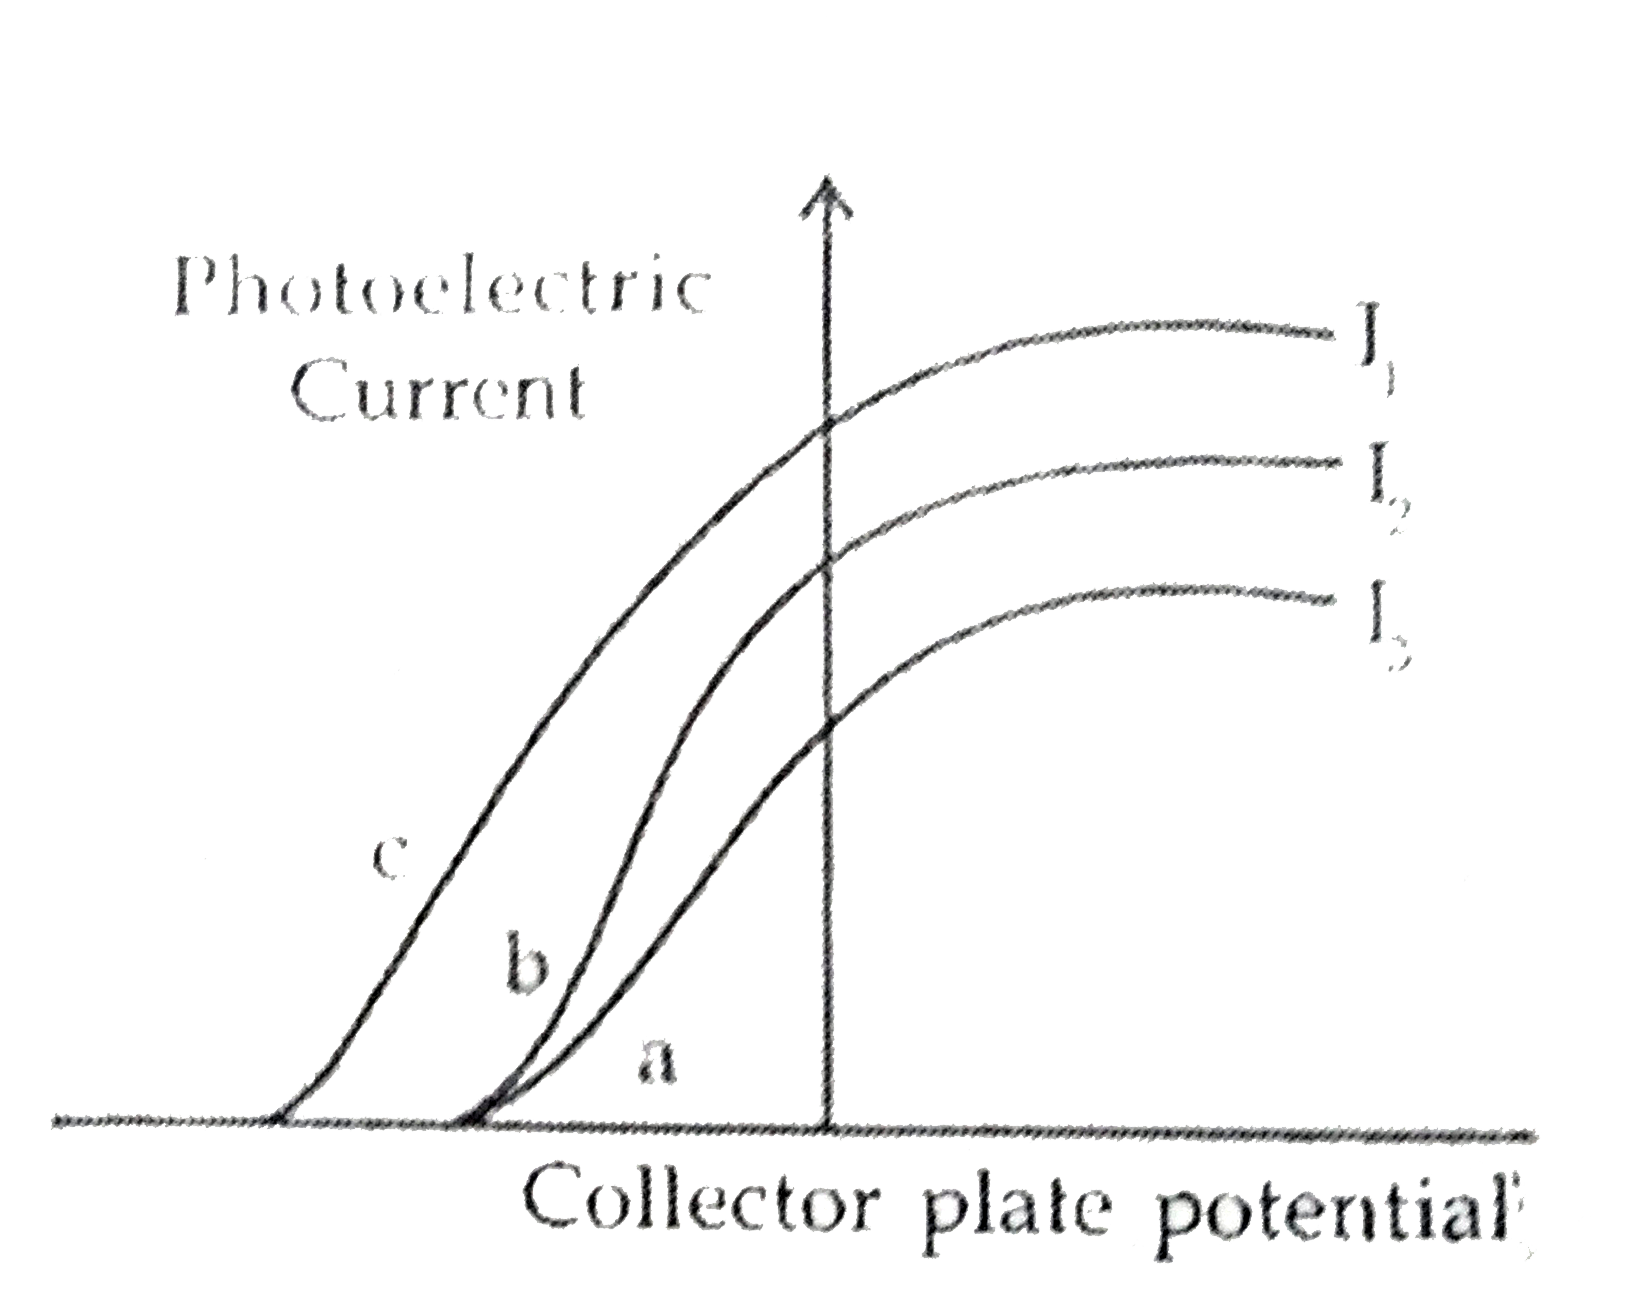
The fig. shows the variation of photon current with anode potential for a photo-sensitive surface for three different radiation. Let Ia,IbandIc be the intensities and fa,fbandfc be the frequency for the curves a,b and c respectively.
va=vbandIa≠Ib
va=vcandIa=Ic
va=vbandIa=Ib
vb=vcandIb=Ic
The correct Answer is:A
(a) : Form the graph, we note that the saturation current is same for curves b and c but different for curve
a. Therefore, intensities of b and c will be equal but different from that of a i.e. Ia≠IbbutIb=Ic. As stopping potential is same for curves a and b, hence va=vb. Thus answer (a) is correct.
Topper's Solved these Questions
- DUAL NATURE OF RADIATION AND MATTER BOOK - NCERT FINGERTPS ENGLISHCHAPTER - DUAL NATURE OF RADIATION AND MATTER EXERCISE - EINSTEIN S PHOTOELECTRIC EQUATION : ENERGY QUANTUM OF RADIATION
23 Videos
- DUAL NATURE OF RADIATION AND MATTER BOOK - NCERT FINGERTPS ENGLISHCHAPTER - DUAL NATURE OF RADIATION AND MATTER EXERCISE - PARTICLE NATURE OF LIGHT : THE PHOTON
19 Videos
- DUAL NATURE OF RADIATION AND MATTER BOOK - NCERT FINGERTPS ENGLISHCHAPTER - DUAL NATURE OF RADIATION AND MATTER EXERCISE - PHOTOELECTRIC EFFECT
2 Videos
- CURRENT ELECTRICITYBOOK - NCERT FINGERTPS ENGLISHCHAPTER - CURRENT ELECTRICITYEXERCISE - Assertion And Reason
15 Videos
- ELECTRIC CHARGES AND FIELDSBOOK - NCERT FINGERTPS ENGLISHCHAPTER - ELECTRIC CHARGES AND FIELDSEXERCISE - Assertion And Reason
15 Videos
Similar Questions
The figure shows the variation of photocurrent with anode potential for a photosensitve surface for three different radiations. Let la,lbandlc be the curves a, b and c, respectively
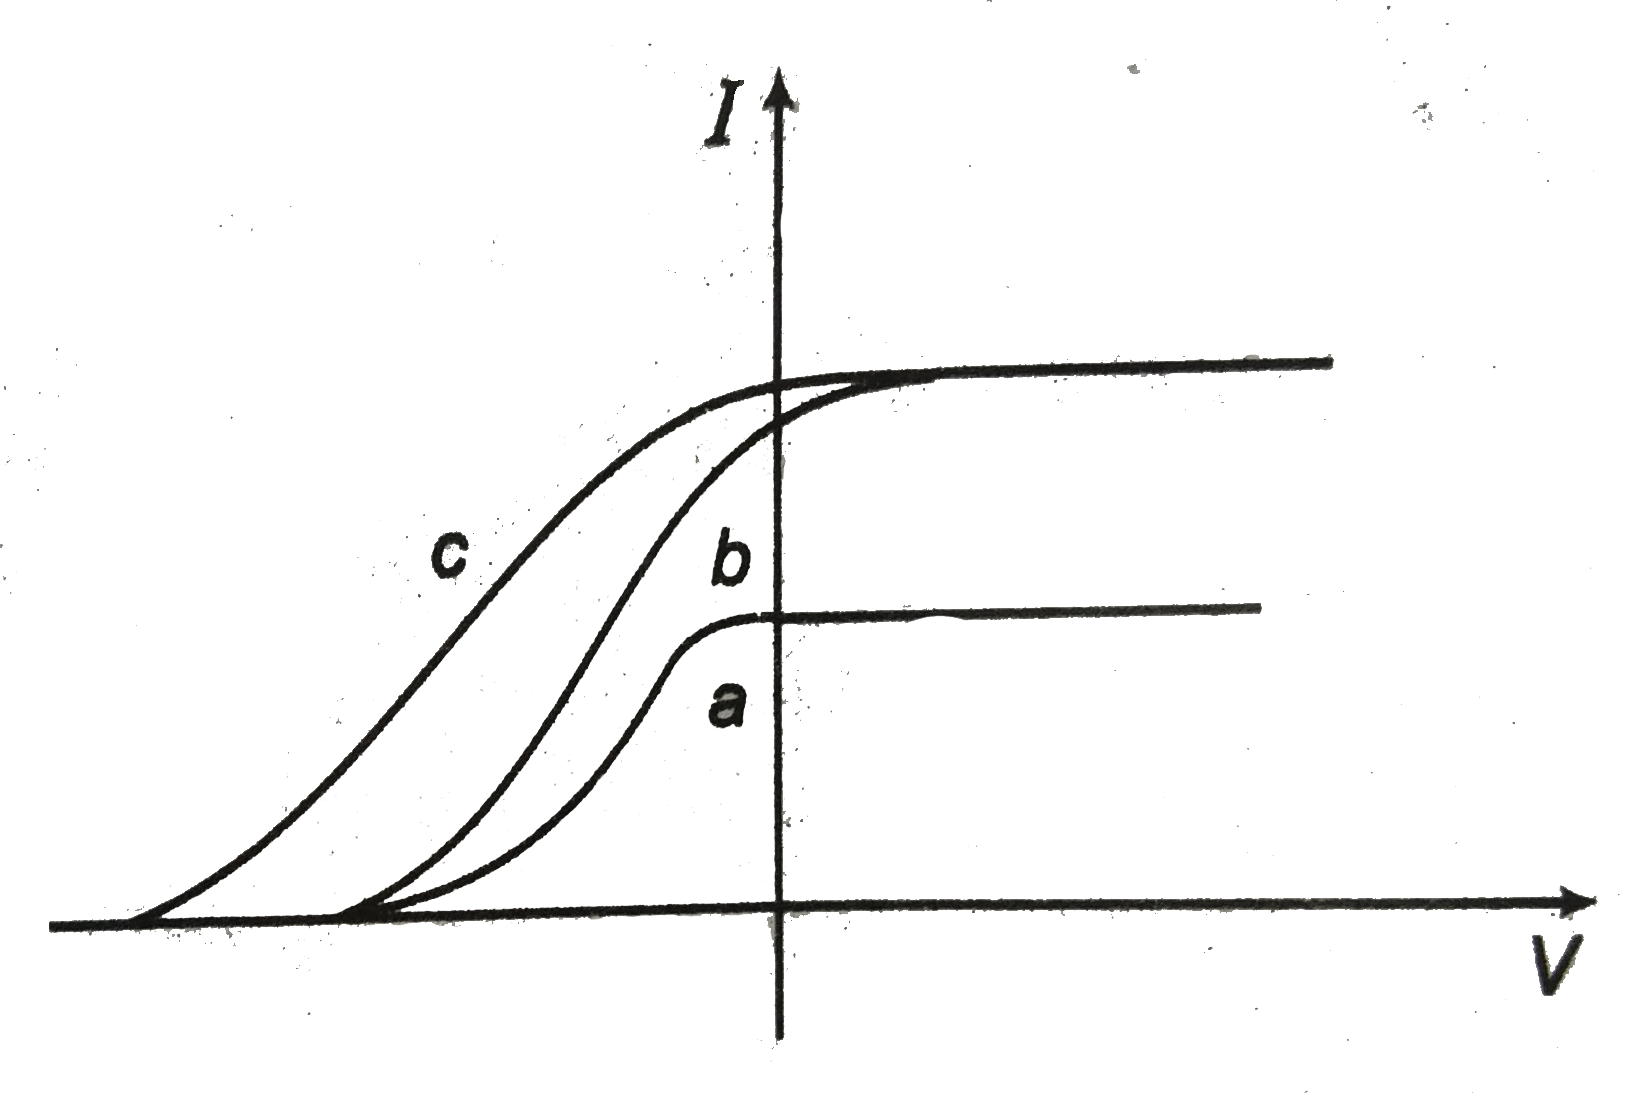
(a) fa=fbandla≠lb (b) fa=fcandla=lc
(c ) fa=fbandla=lb (d) fb=fcandlb=lc
View SolutionThe figure shows a plot of photo current versus anode potential for a photosensitive surface for three different radiations. Which one of the following is a correct statement ?
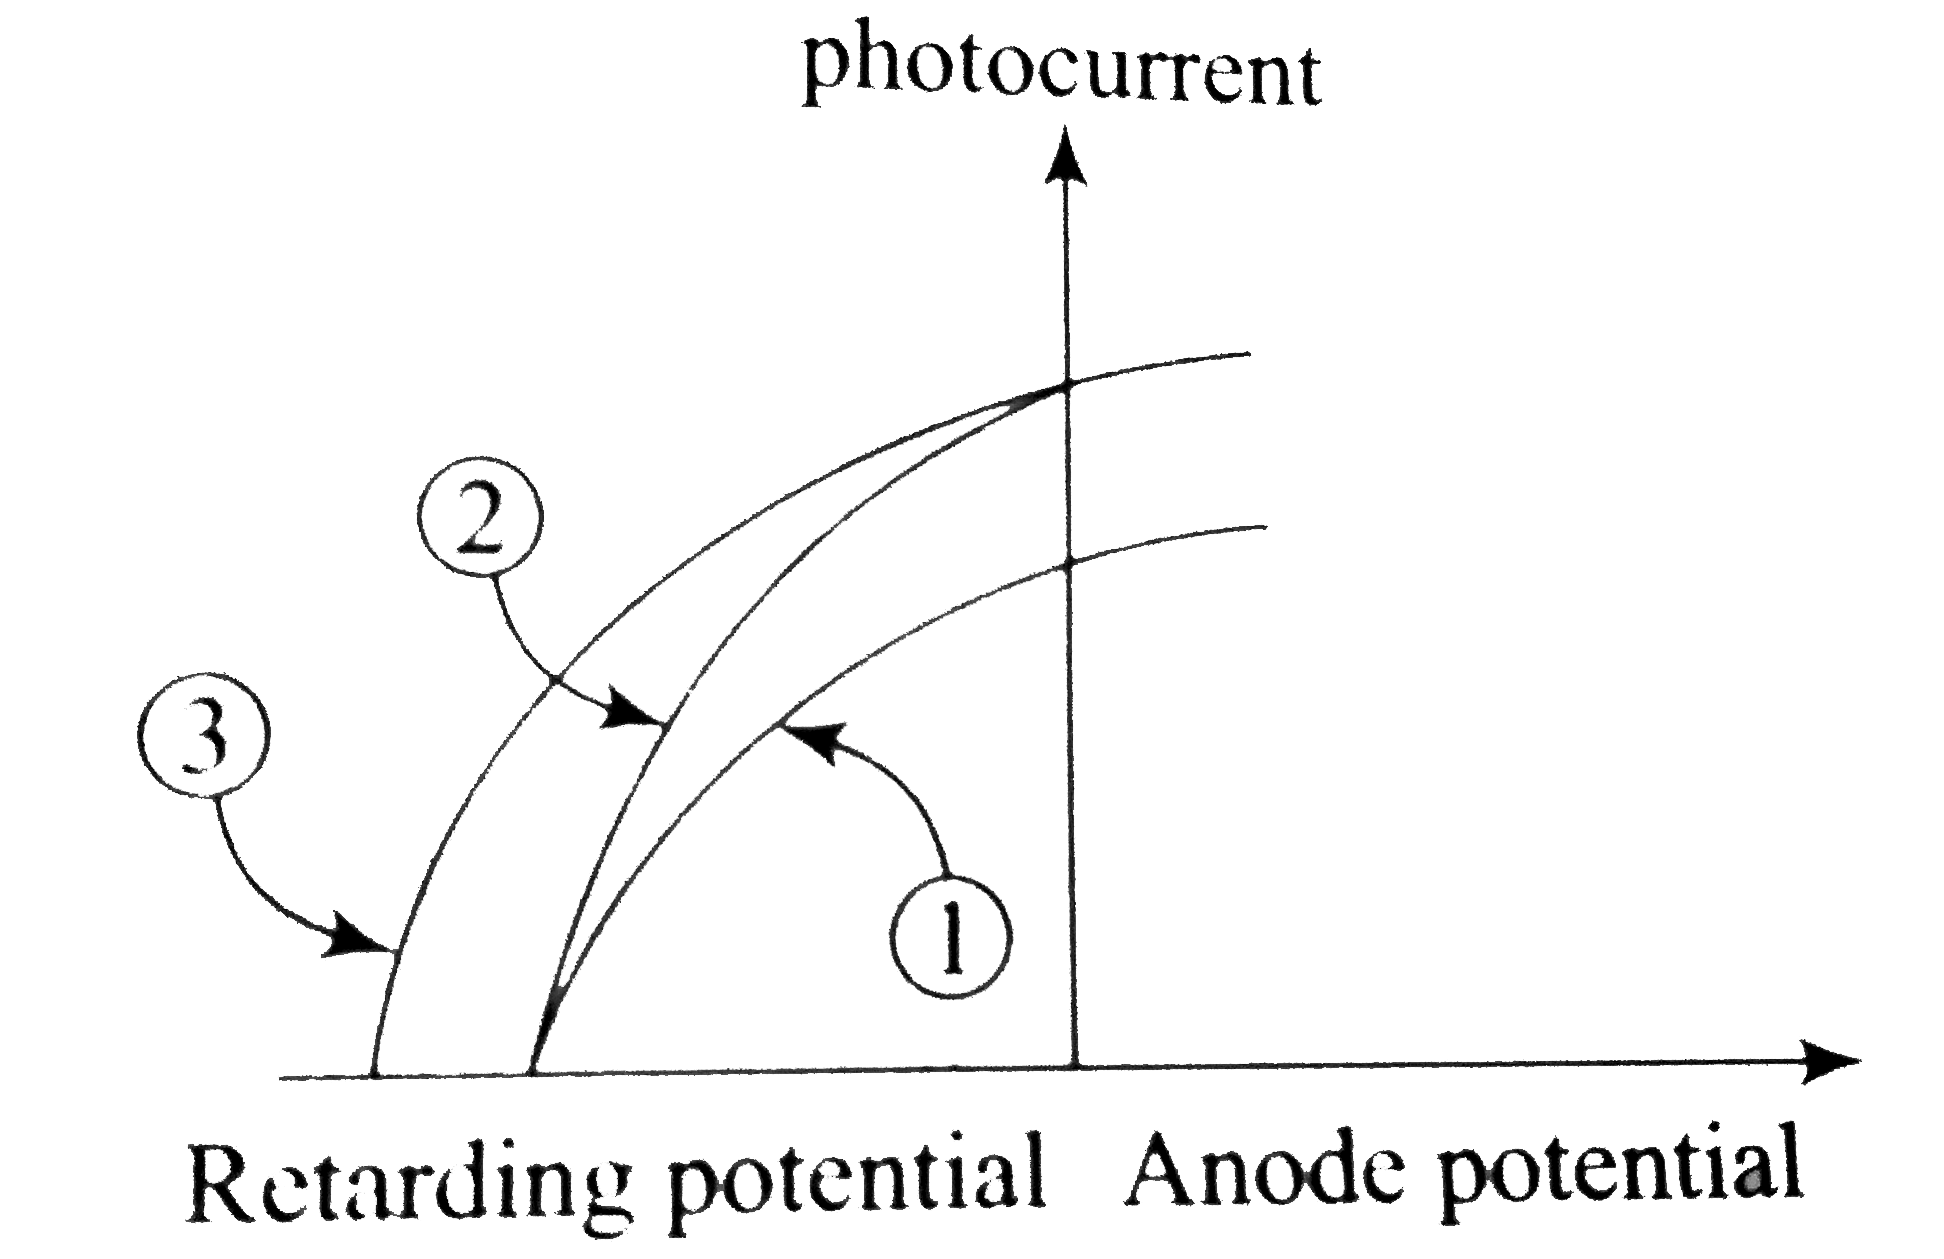
View SolutionThe figure shows a plot of three curves a, b, c, showing variation of photocurrent vs collector plate potential for three different intensities I1,I2andI3 having frequencies v1,v2andv3 respectively incident on a photosensitive surface.
Point out the two curves for which the incident radioations have same frequency but different intensities.
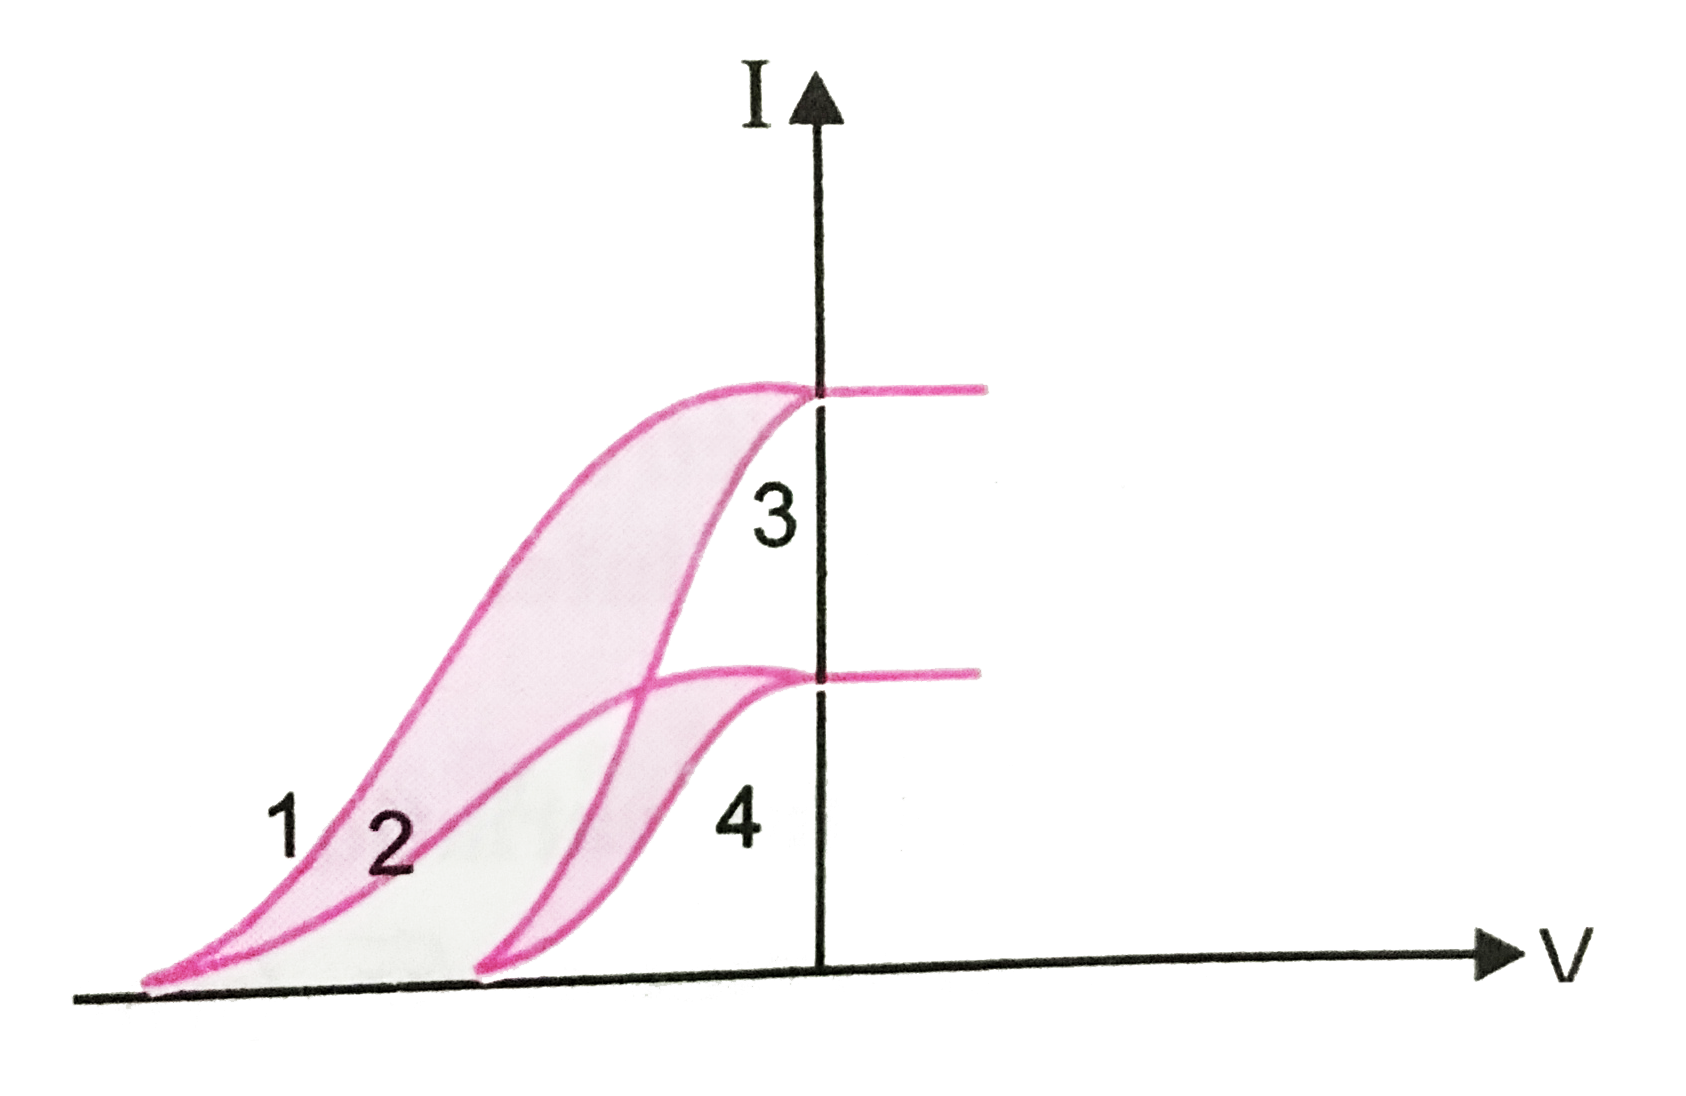
View SolutionThe graph of Fig. shows the variation of photoelectric current (I) versus applied voltage (V) for the two different photosensitive materials for two different intensities of the incident radiation. Identify the pairs of curves that correspond to different materials but same intensity of incident radiation.
View SolutionFig. shows three different modes of vibration of a string of length I.
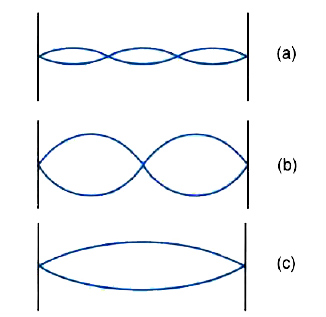
What is the ratio of frequency between (a) and (c)?
View SolutionThe curves (a),(b),(c) and (d) show the variation between the applied potential difference (V) and the photoelectric current (i) , at two different intensities of light (I1>I2). In which figure is the correct variation shown ?
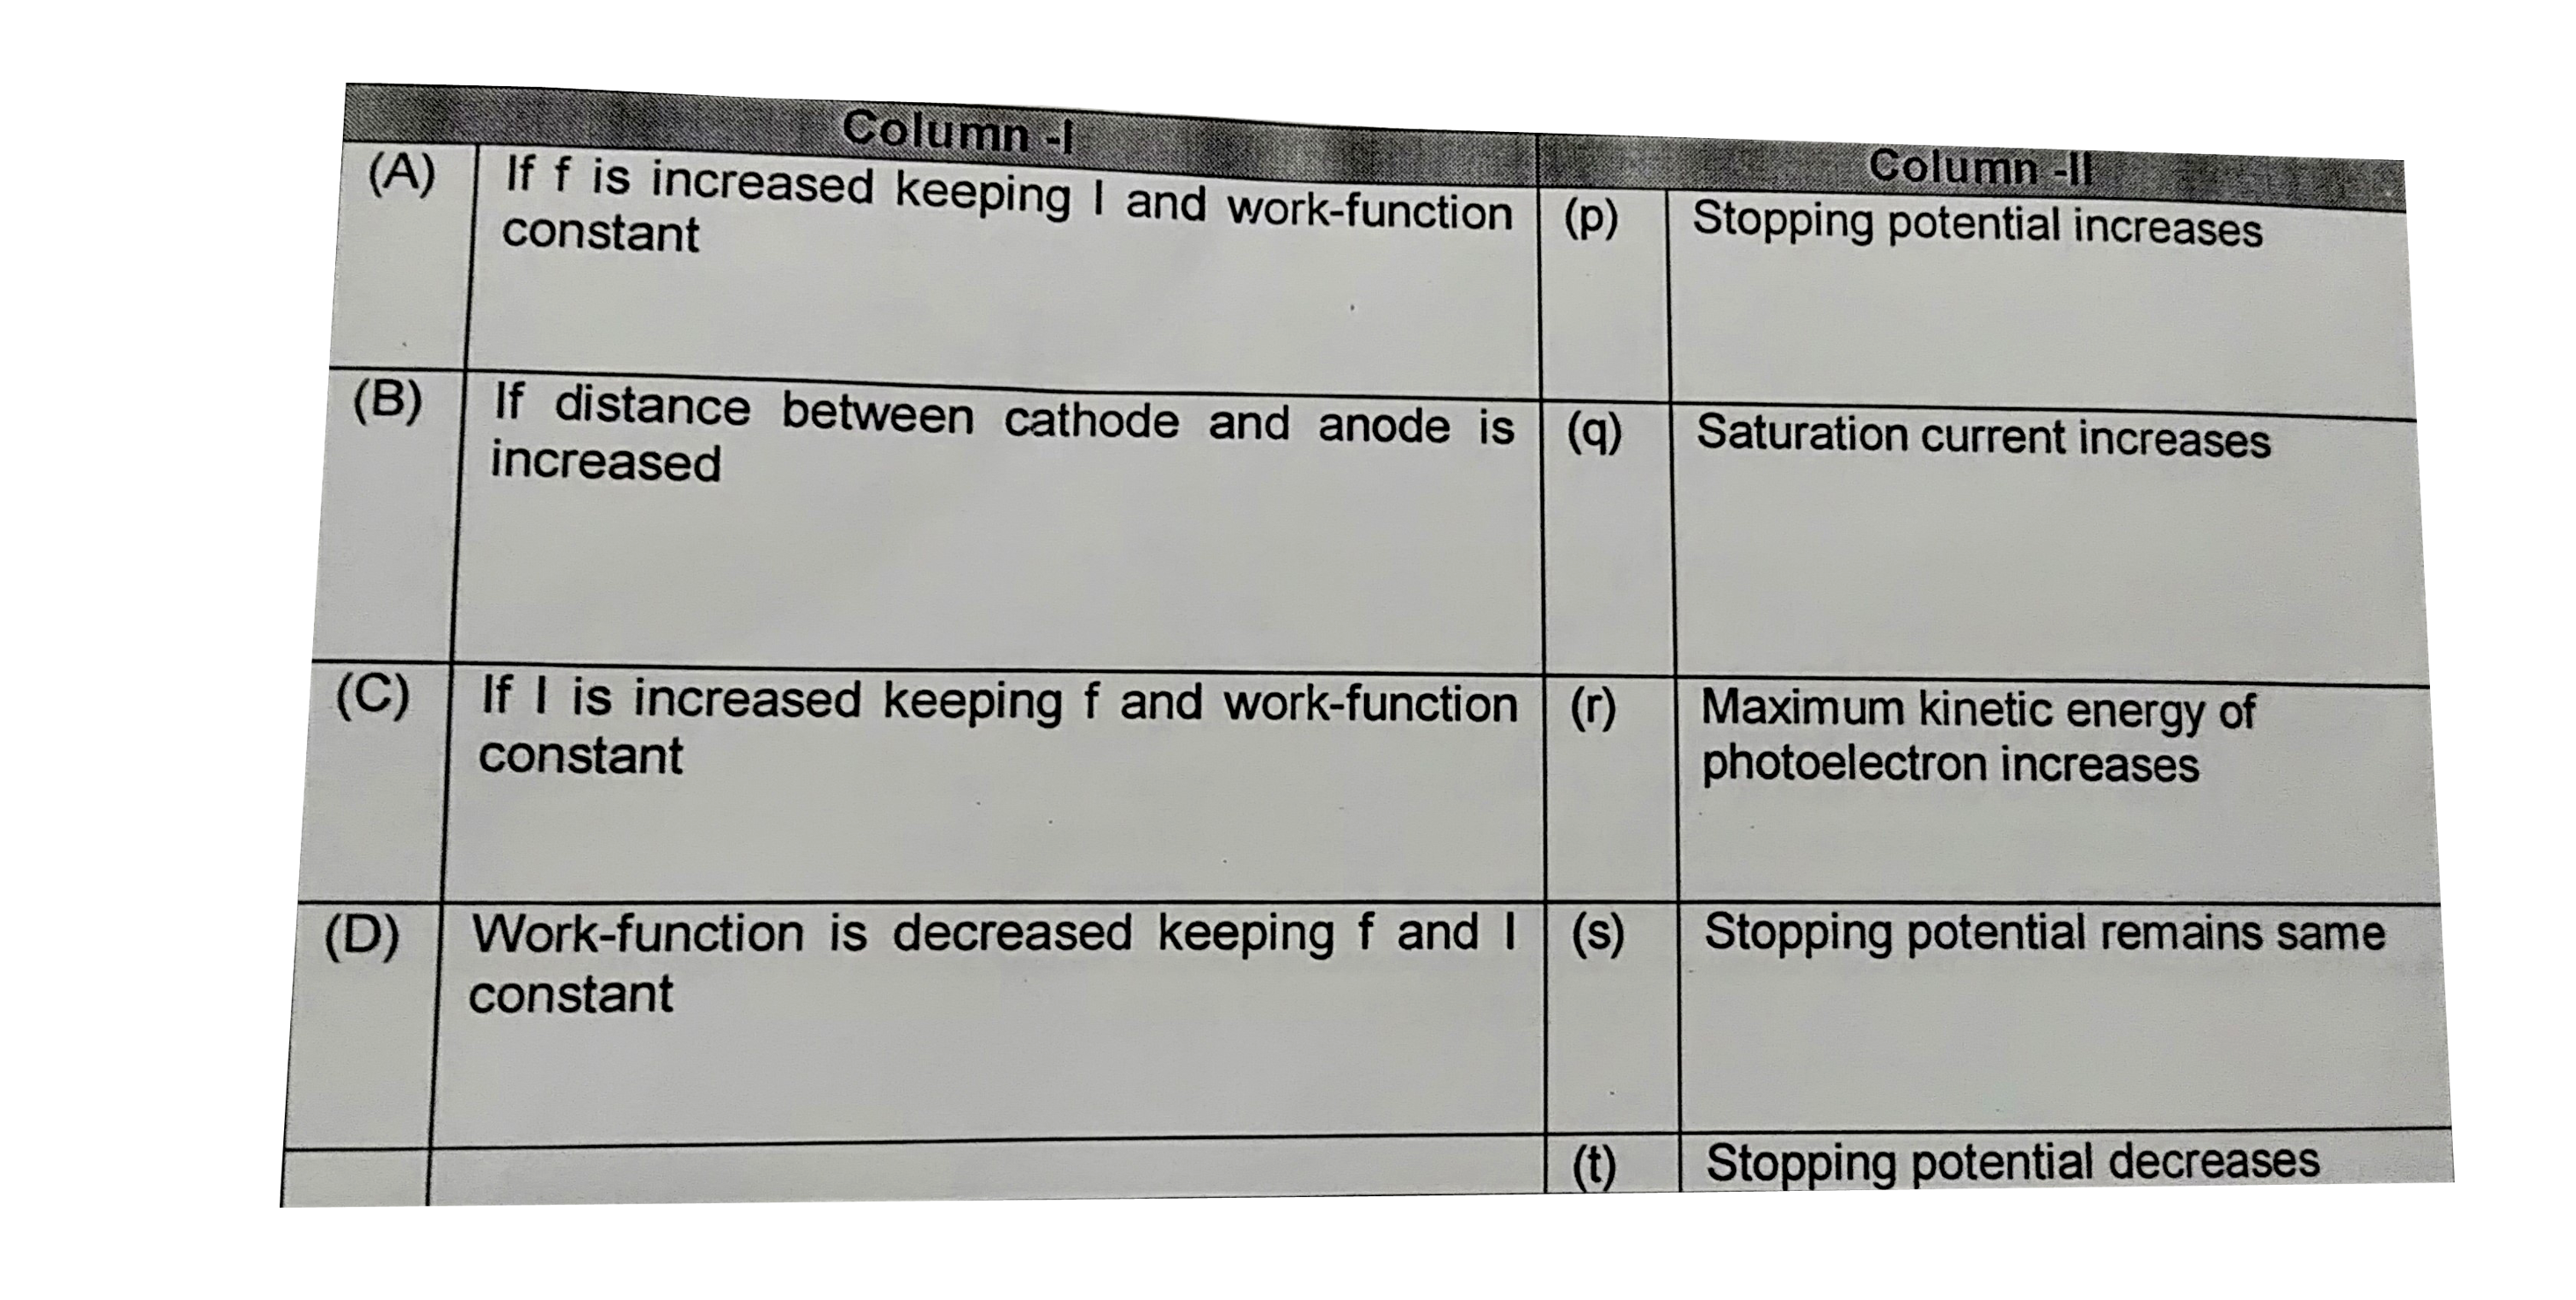
View SolutionIn the photoelectric effect experiment, if f is the frequency of radiation incident on the metal surface and I is the intensity of the intensity radiations, then match the following columns:
View SolutionLet IE,ICandIB represent the emitter current,the collector current and the base current respectively in a transistor.then
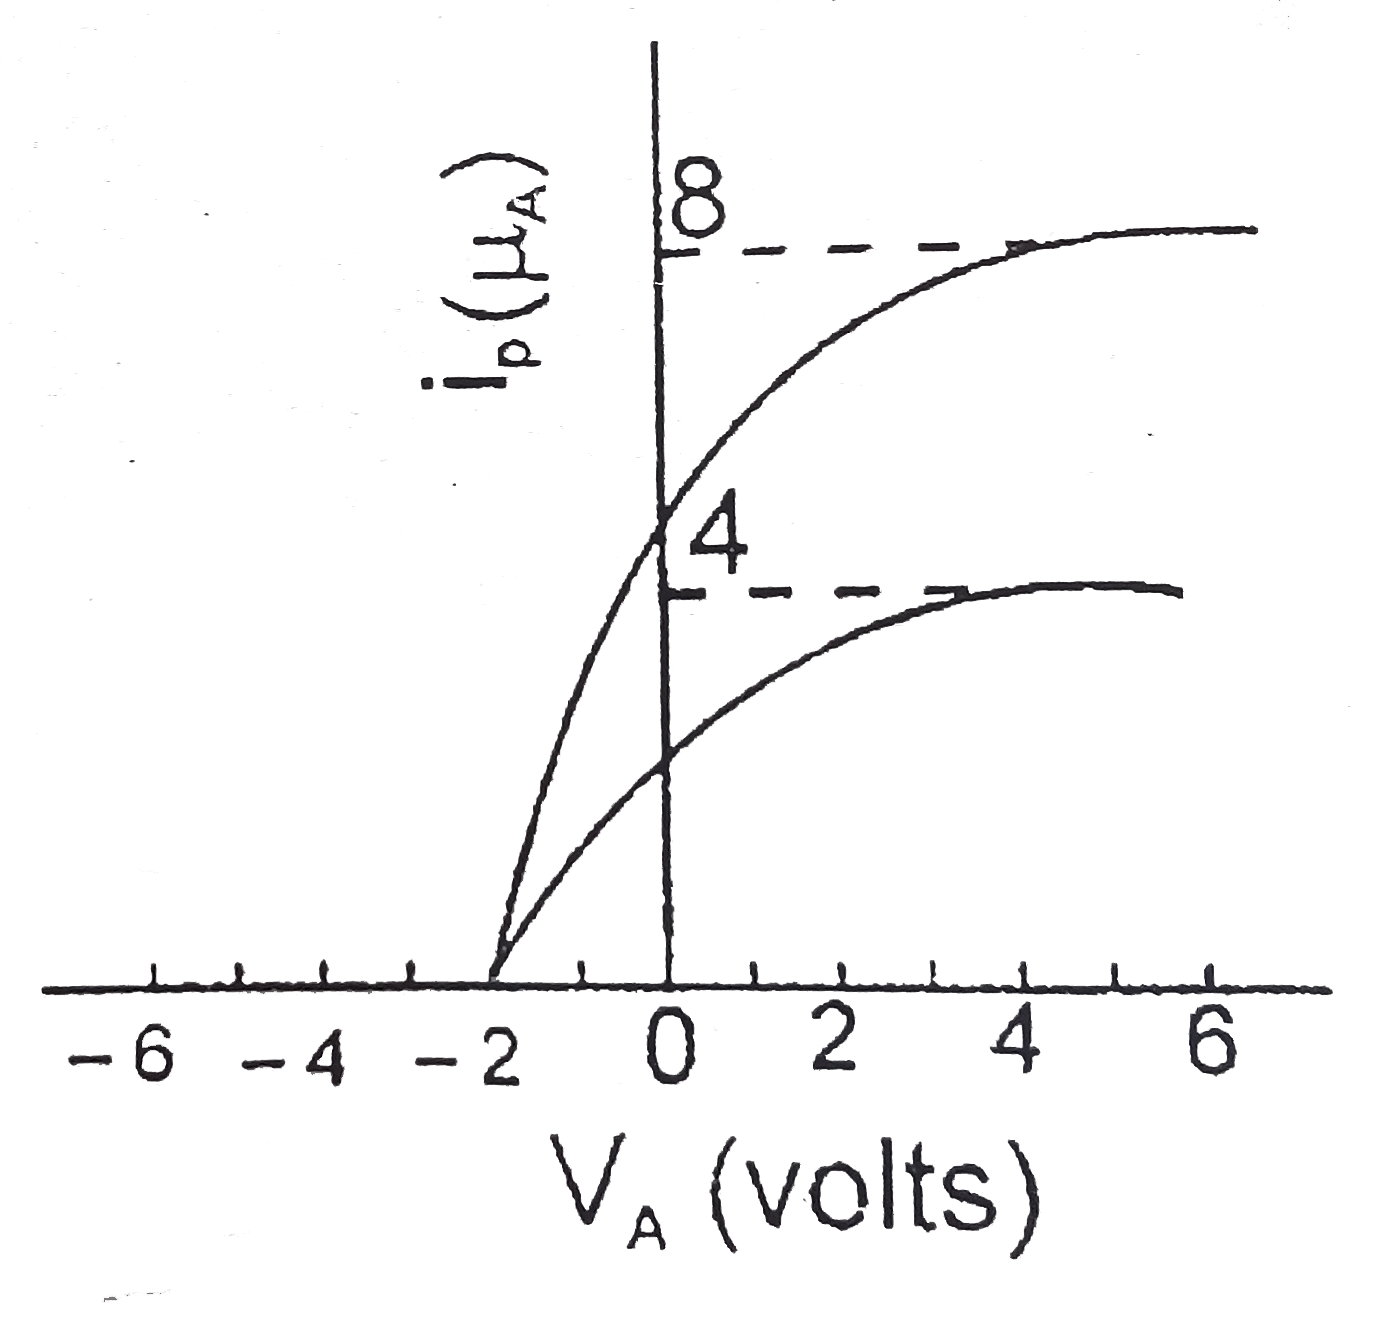
View SolutionIn a photoelectric effect experiment, photons of energy 5eV are incident on the photocathode of work function 3eV. For photon intensity IA=1015m−2s−1, saturation current of 4.0μA is obtained. Sketch the variation of photocurrent ip against the anode voltage Va in the figure below for photon intensity IA ( curve A) and IB=2×10¹⁵m−2s−1 (curve B) ( in JEE graph was to be drawn in the answer sheet itself.)
View SolutionFour open organ popes of different length and different gases at same temperature as shown in figure. Let fA,fB,fC and fD be their fundamental frequencies then : [Take γCO2=43]
_E01_065_Q01.png) .
.
View Solution
