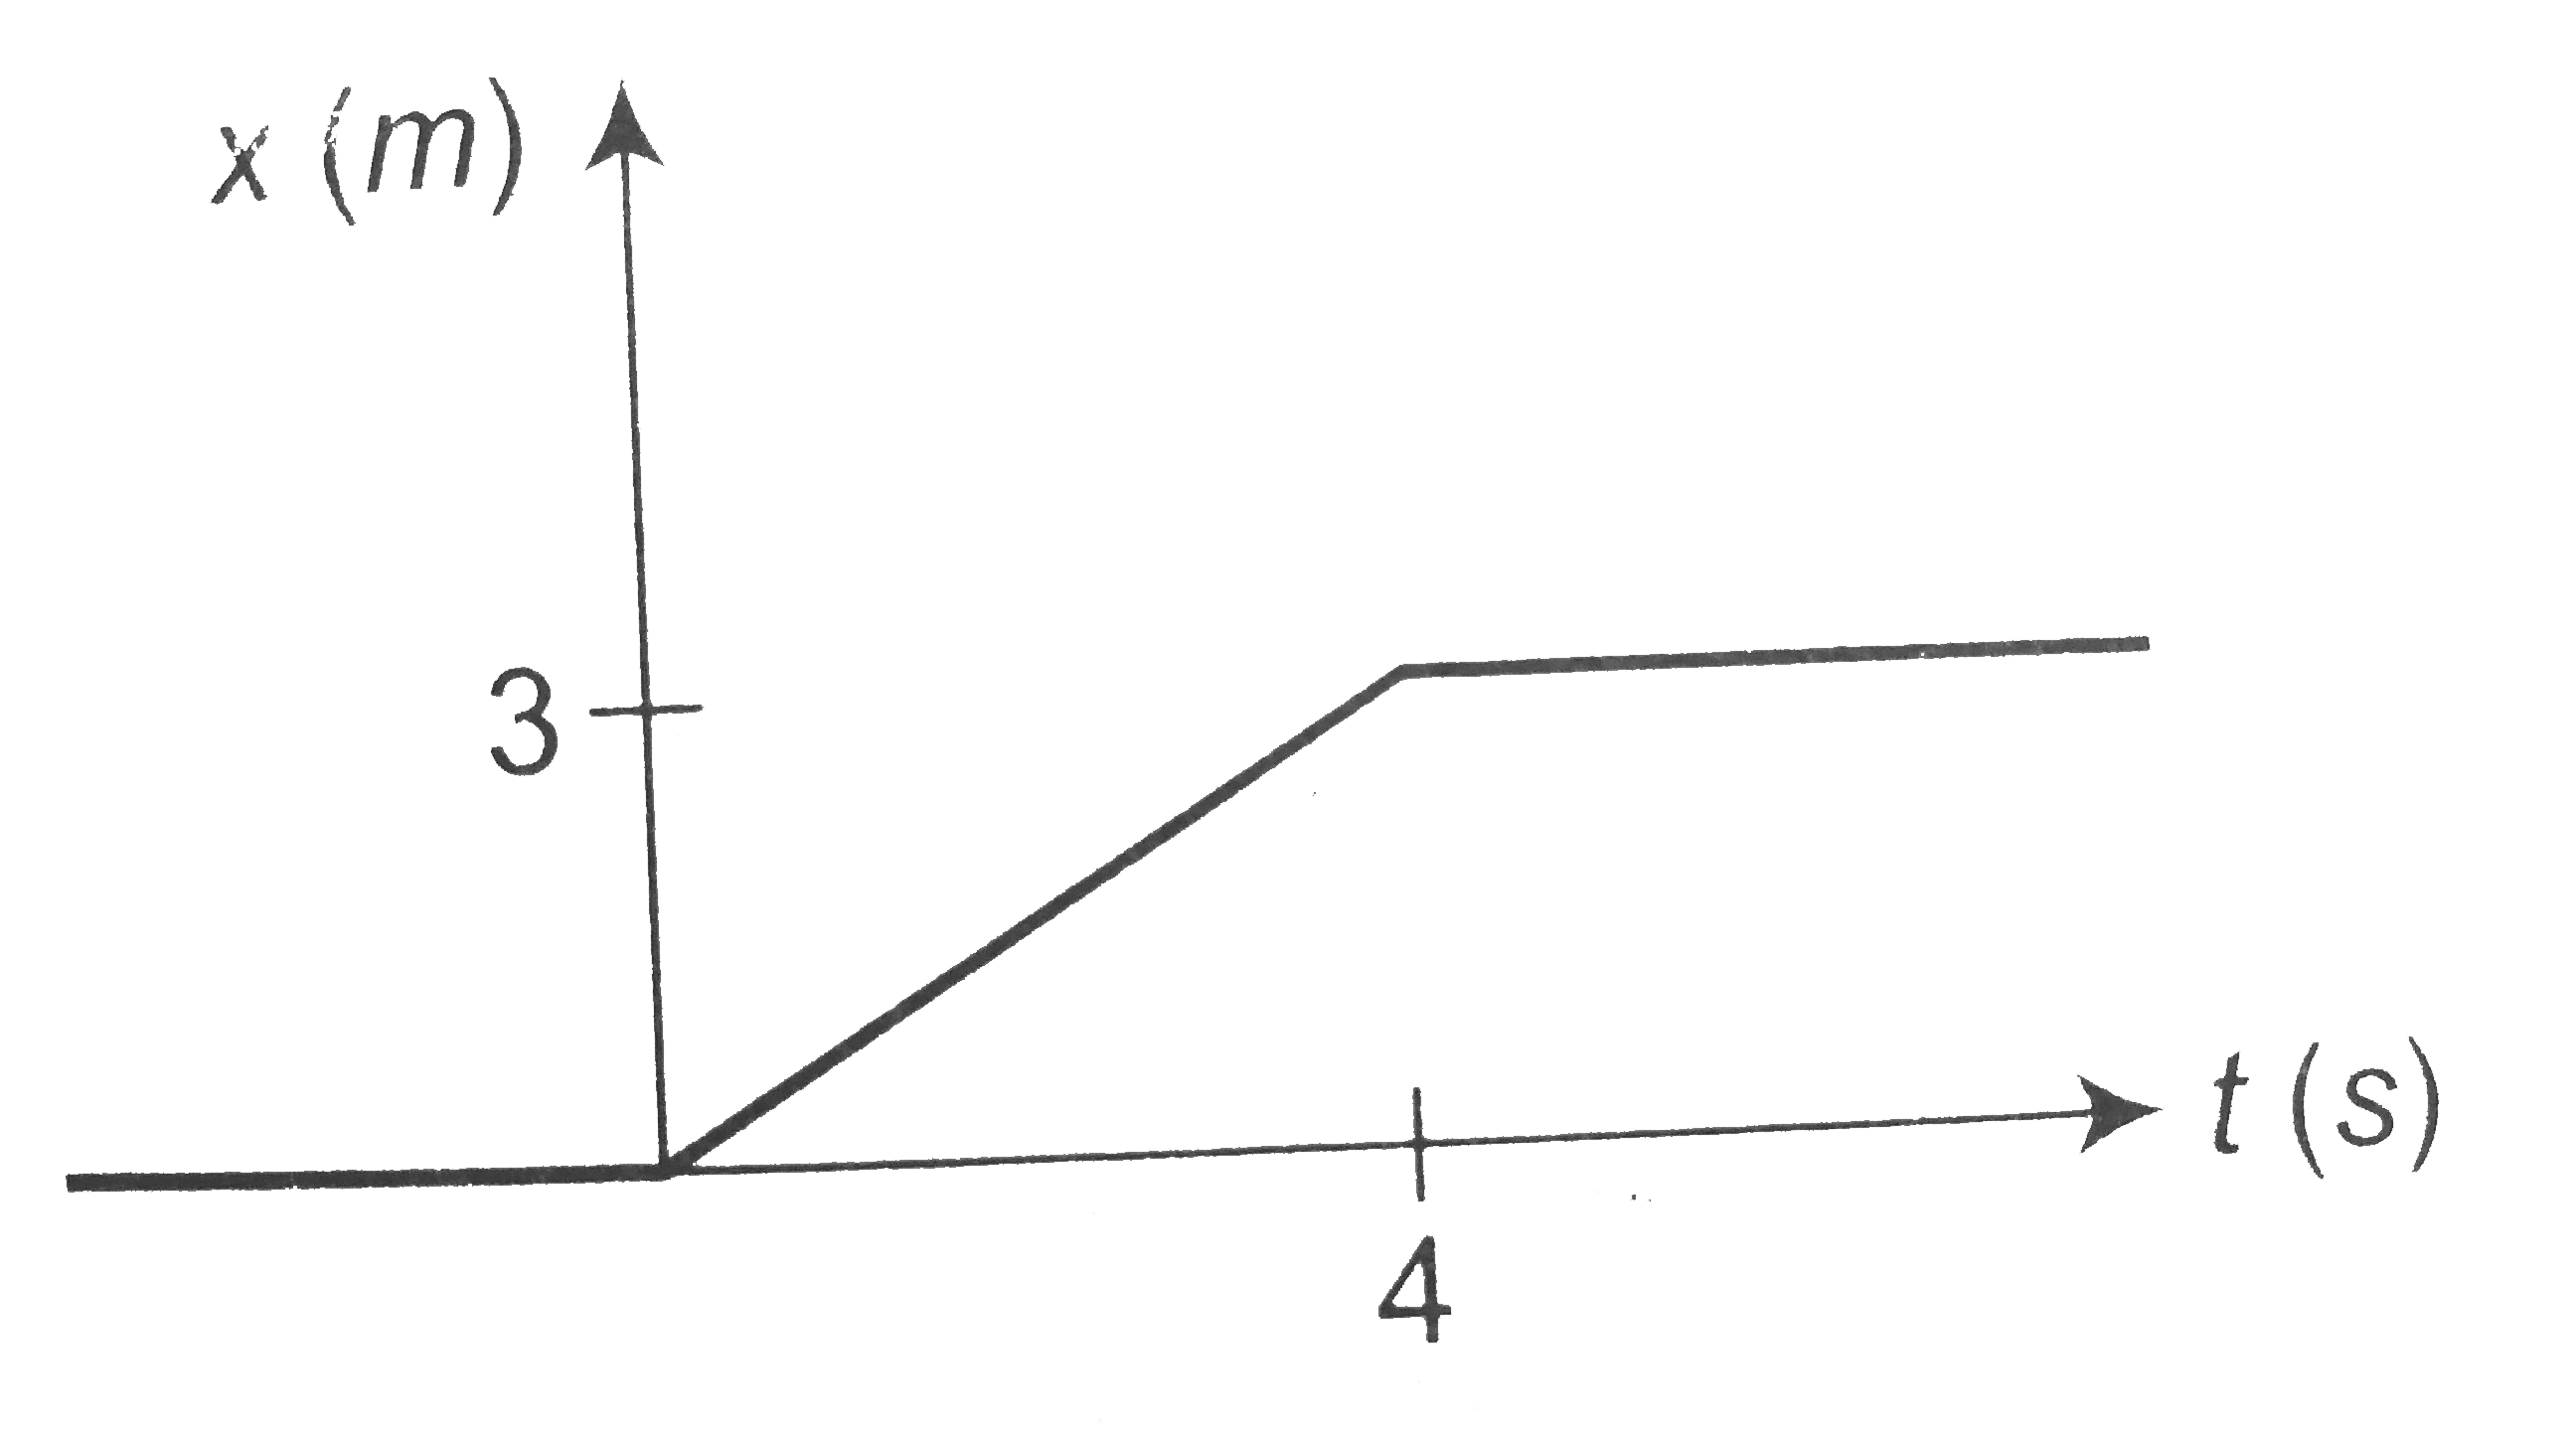
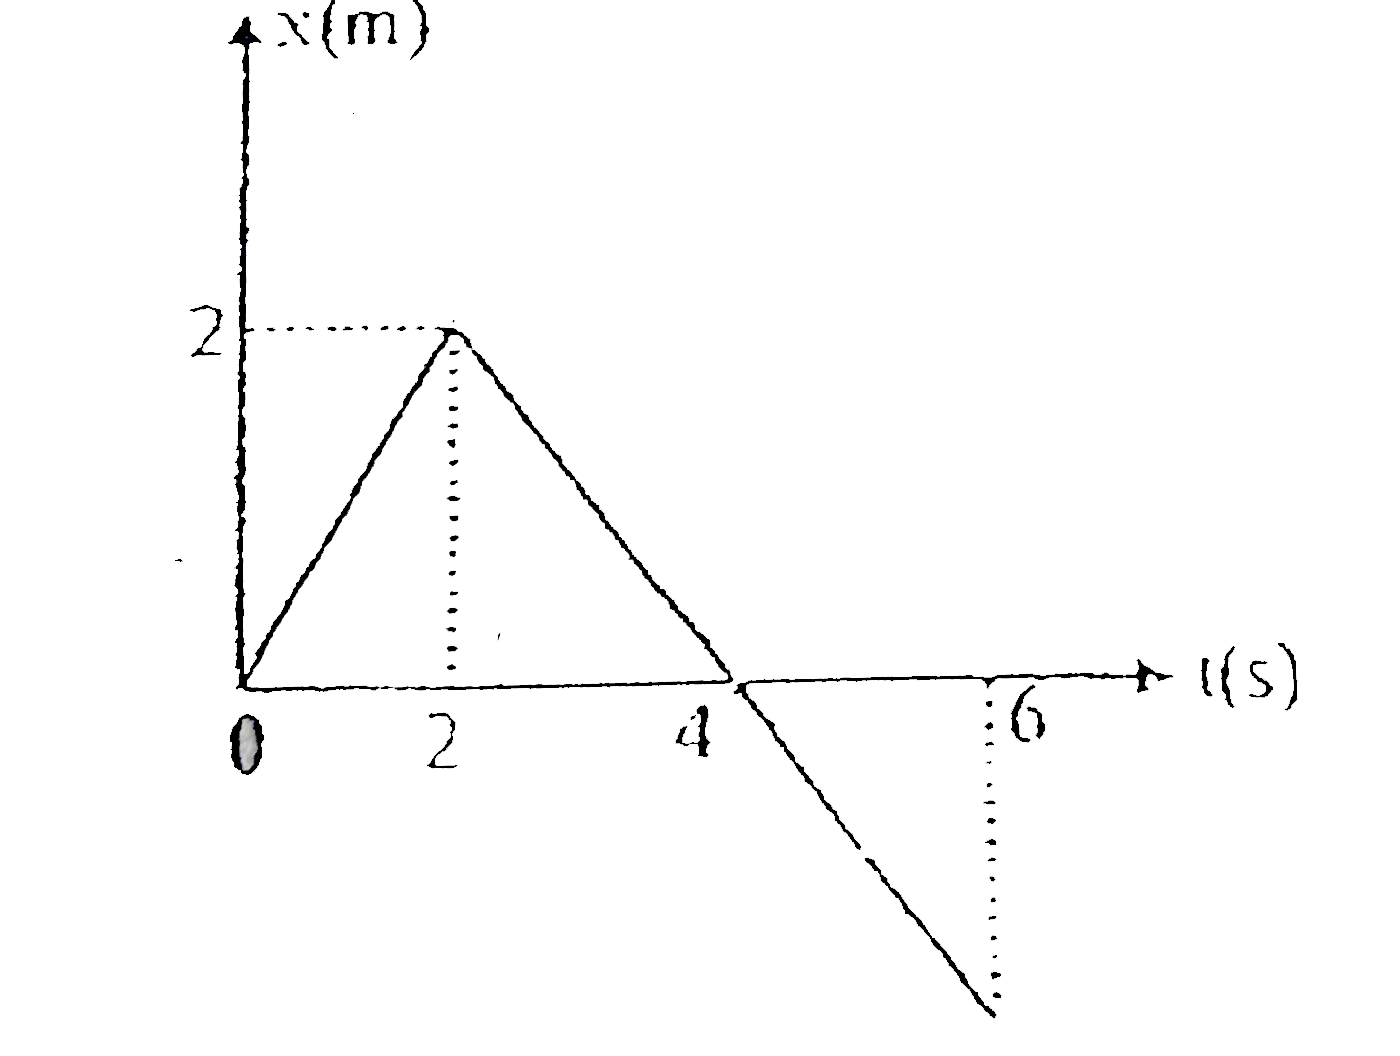
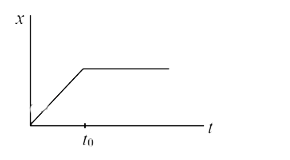
Figure shows the position-time graph of a particle of mass 4kg. Let the force on the particle for t<0 , 0<tlt,4s , t>4s be F1,F2 and F3 respectively. Then
F1=F2=F3=0
F1>F2=F3
F1>F2>F3
F1<F2<F3
The correct Answer is:A
For t<0andt≥4s, the position of the particle is not changing i.e. the particle is at rest. So no force is acting on the particle at these intevals. For 0<t<4s. The position of the particle is continuously changing. As the position time graph is a straight line, the motion of the particle is uniform, so acceleration, a=0, Hence no force acts on the particle during the interval also.
Topper's Solved these Questions
- LAWS OF MOTIONBook:NCERT FINGERTPS ENGLISHChapter:LAWS OF MOTIONExercise:HOTS
Explore 8 Videos
- LAWS OF MOTIONBook:NCERT FINGERTPS ENGLISHChapter:LAWS OF MOTIONExercise:Exemplar Problems
Explore 9 Videos
- KINETIC THEORYBook:NCERT FINGERTPS ENGLISHChapter:KINETIC THEORYExercise:Assertion And Reason
Explore 10 Videos
- MECHANICAL PROPERTIES OF FLUIDSBook:NCERT FINGERTPS ENGLISHChapter:MECHANICAL PROPERTIES OF FLUIDSExercise:NCERT Exemplar
Explore 5 Videos
Similar Questions
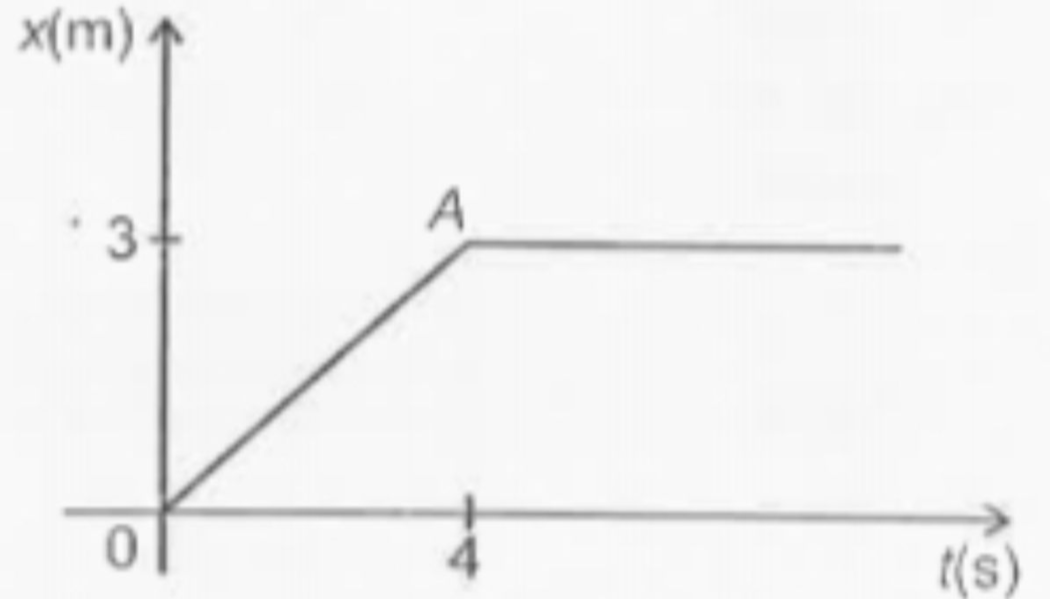
The figure shows the position time graph of a particle of mass 40 kg. What is the force acting on the particle of 0<t<4 s
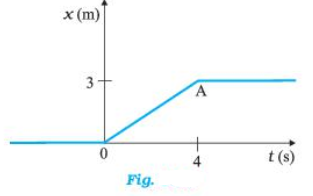
View SolutionFig. shows the position-time graph of a particle of mass 4 kg. What is the (i) force acting on the particle for t<0,t<4s,0<t<4s? (ii) impulse at t = 0 and t = 4 s? Assume that the motion is one dimensional.
View Solution
Knowledge Check
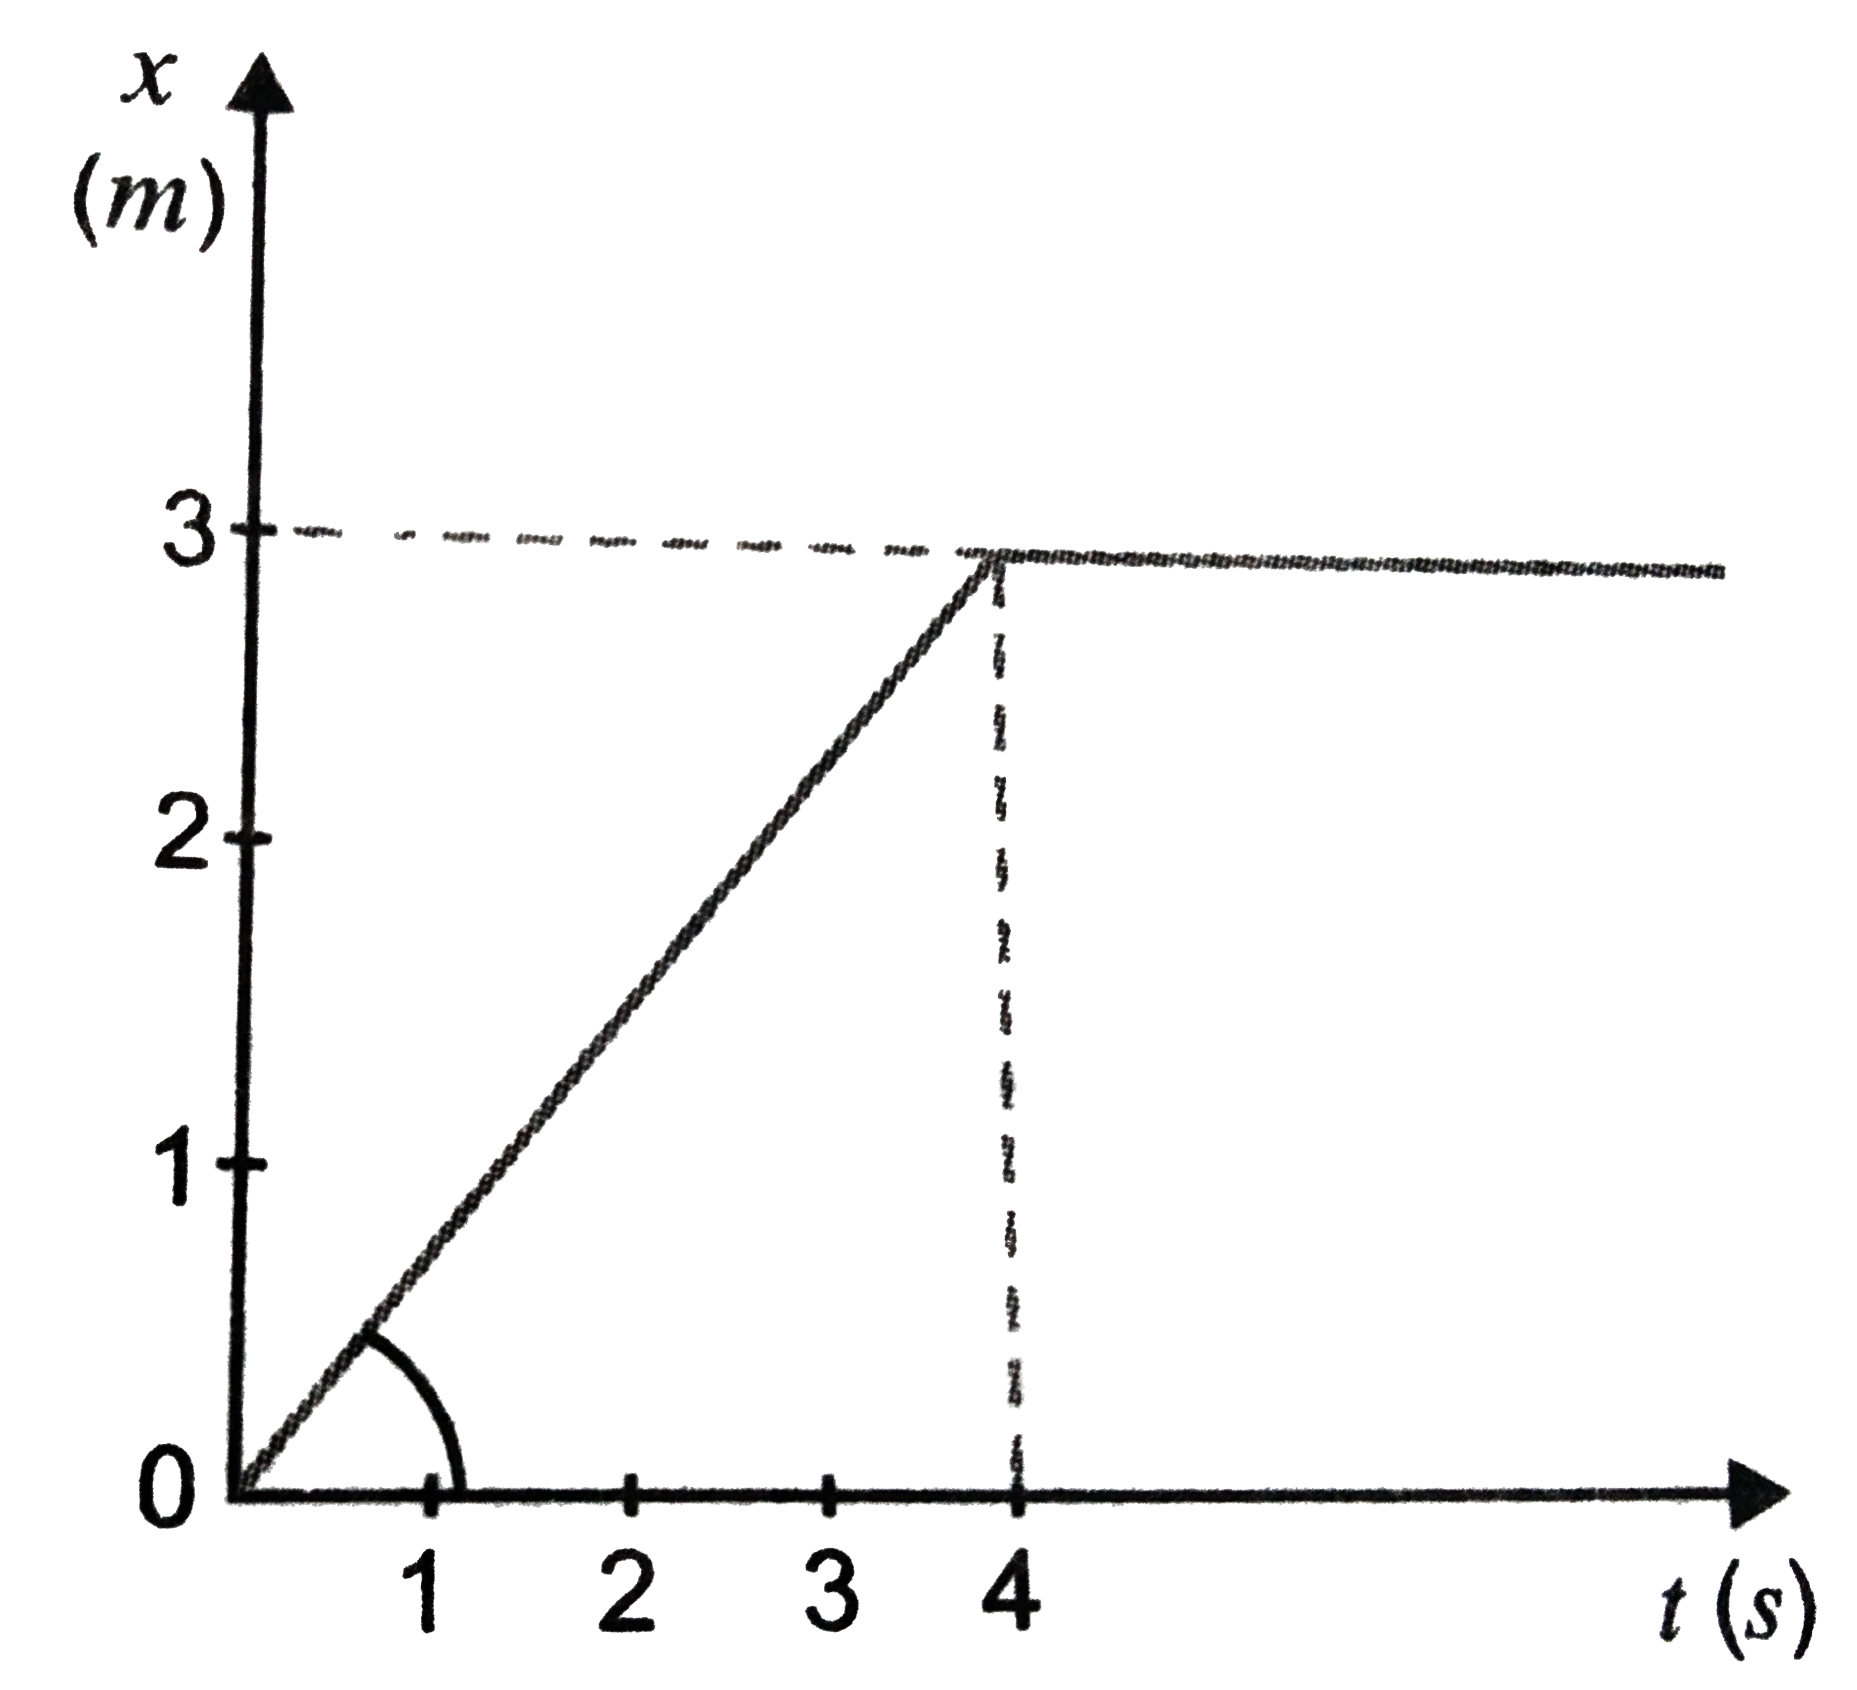
The position time graph of a body of mass 2kg is as given in What is the impulse on the body at t=0 s and t=4s ?
 . A23kgms−1B−23kgms−1C32kgms−1D−32kgms−1
Position time graph of a particle of mass 2 kg is shown in figrure. Total work done on the particle from t=0 to t=4s is
View SolutionIn the figure, the position time graph of a particle of mass 0.1 kg is shown. The impulse at t=2 second is :
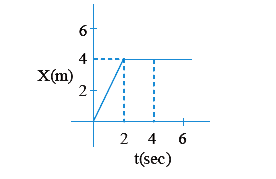
View SolutionIn the figure given below, the position time graph of a particle of mass 0.1kg is shown. The impulse at t=2 sec is
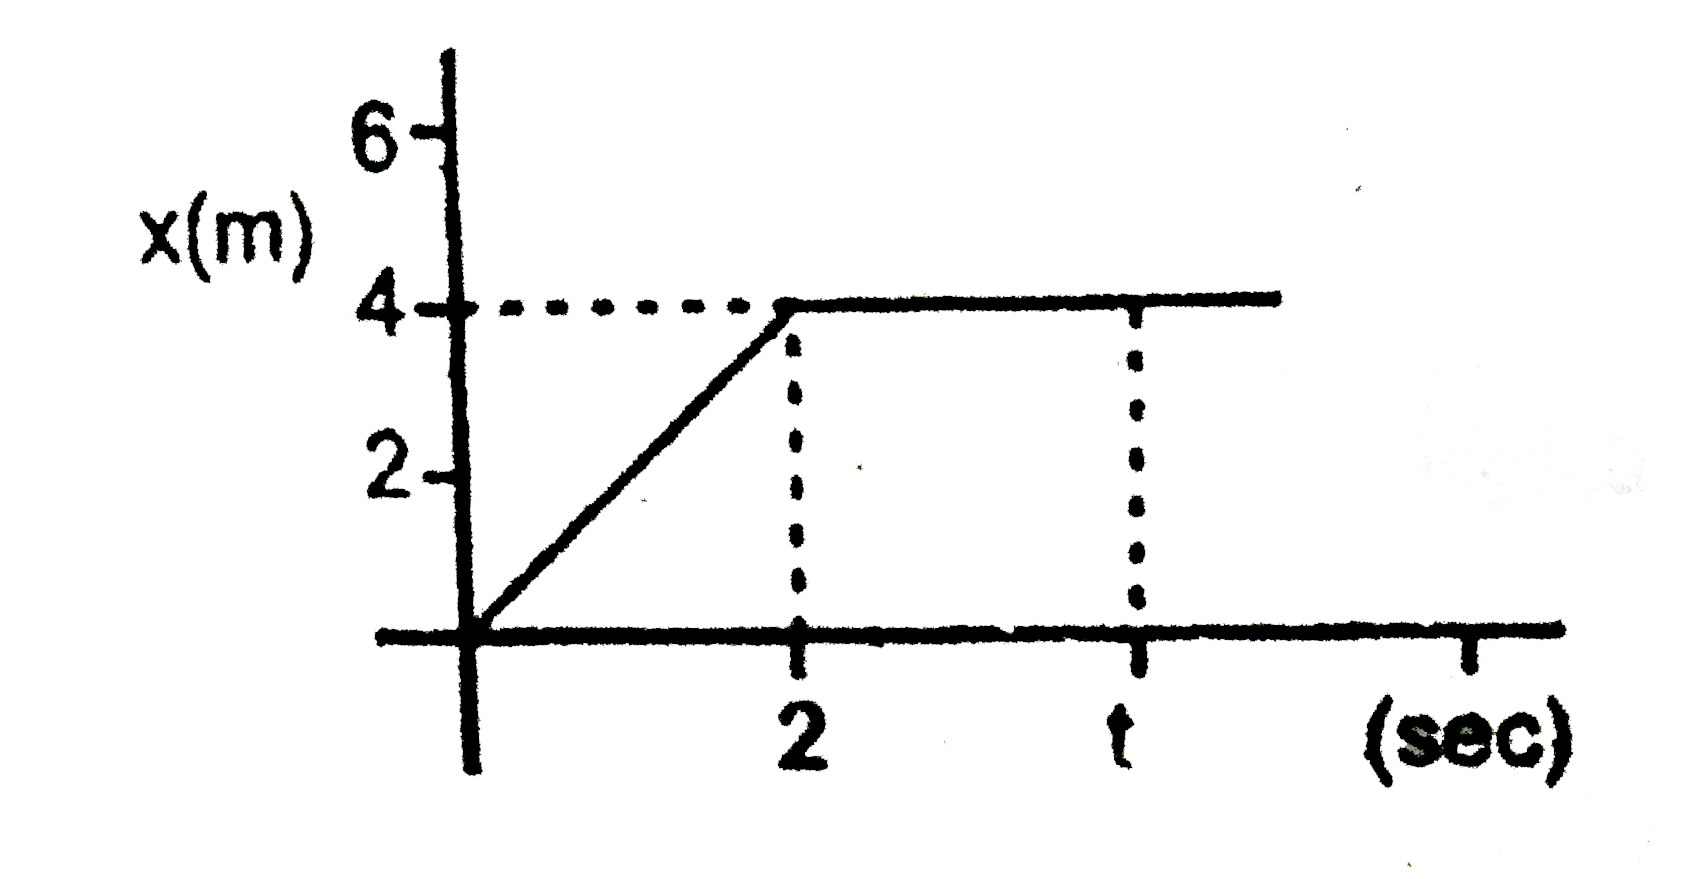
View SolutionIn the figure given below, the position-time graph of a particle of mass 0.1kg is shown. The impuslse at t=2 sec is
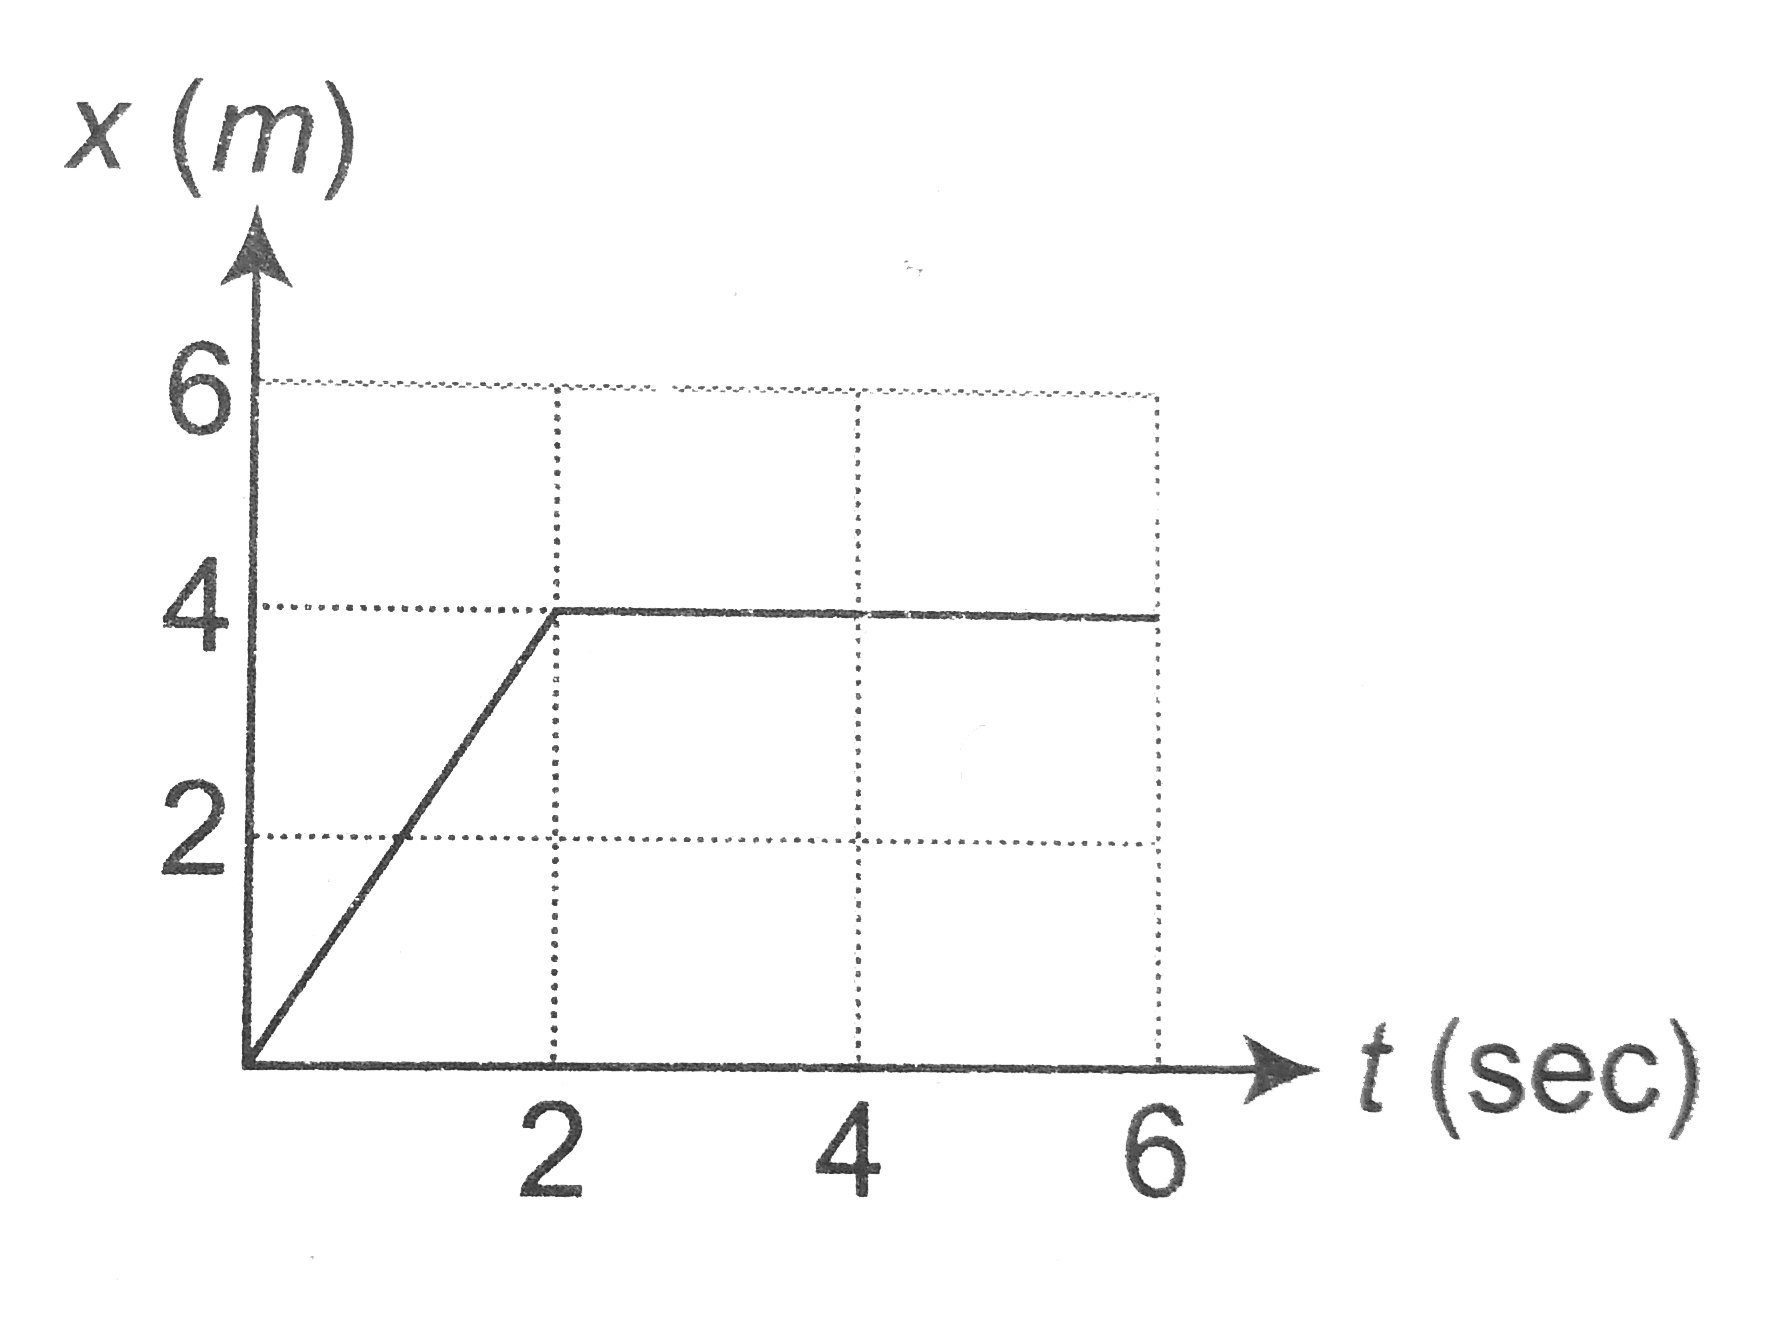
View SolutionFigure shows the position-time graph of a particle moving on the X--axis. Which of these option correctly describes the particle 's motion?
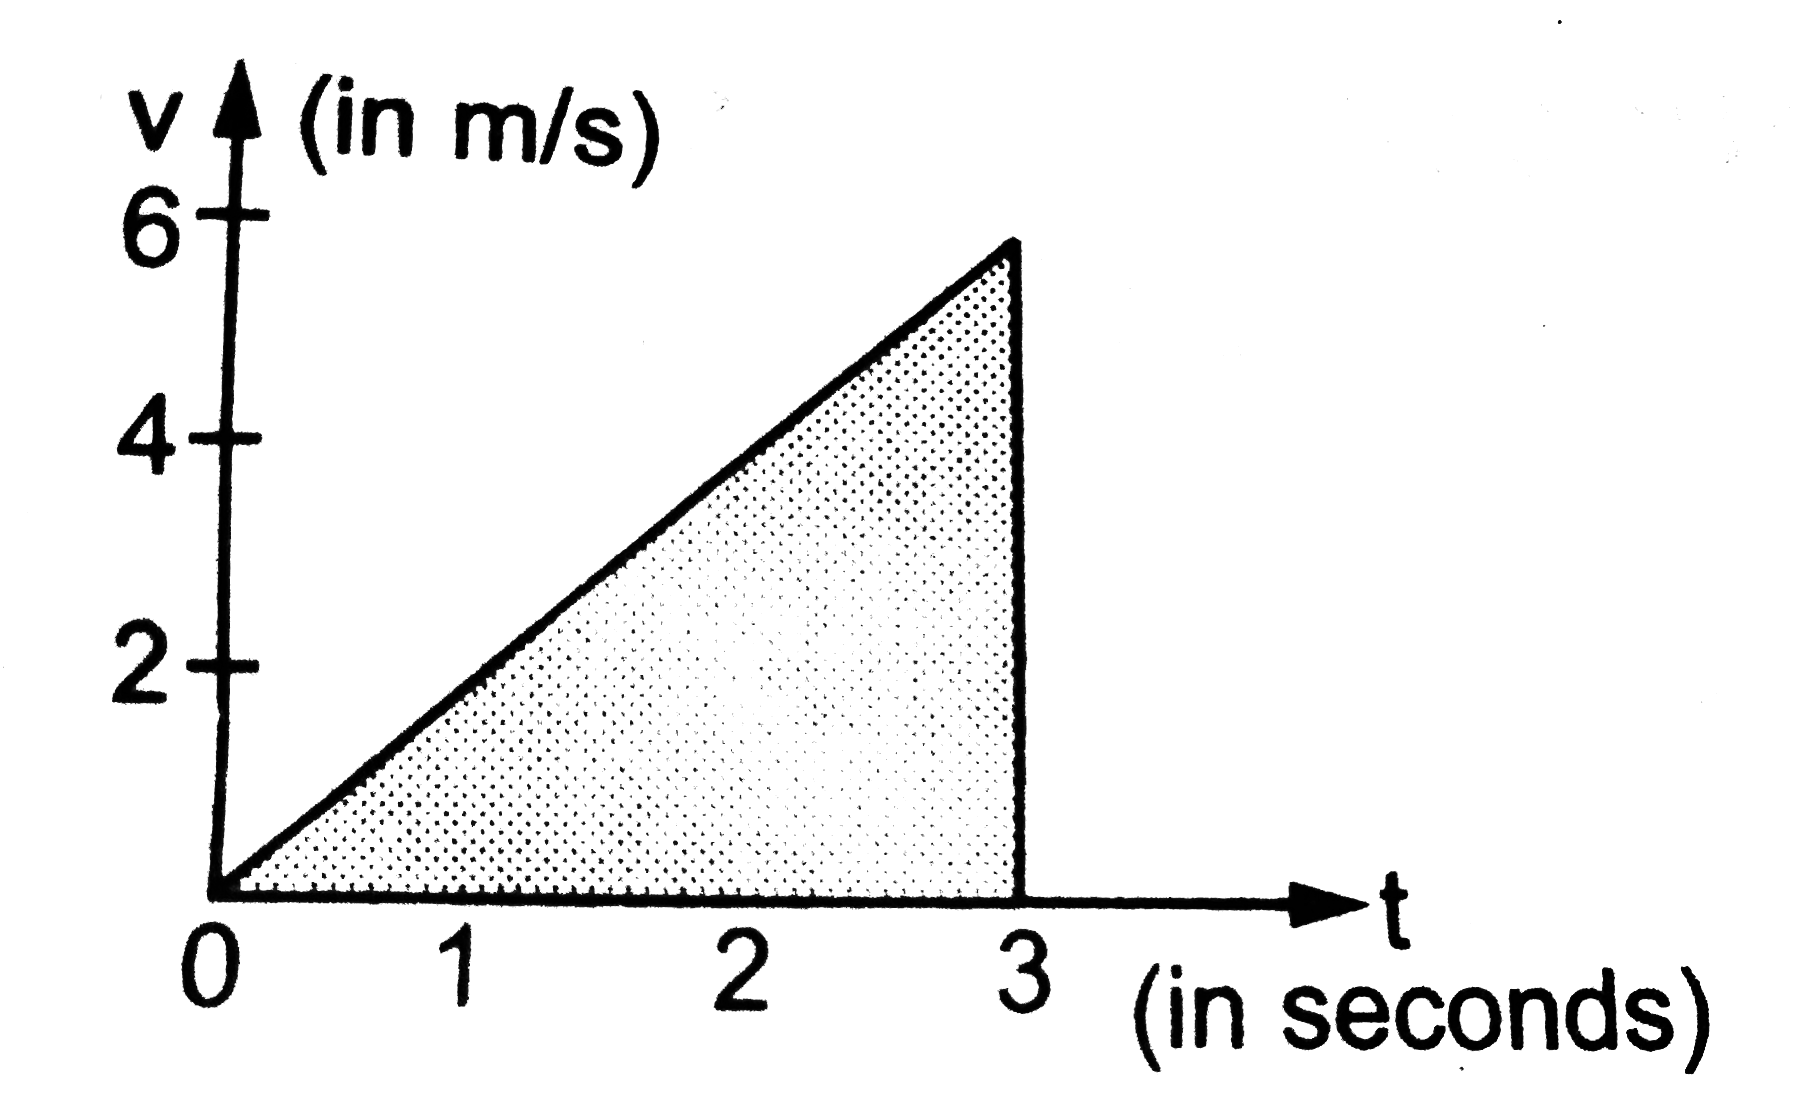
View SolutionFigure shows the speed versus time graph for a particle. Find the distance travelled by the particle during the time t=0 to t=3s.
View SolutionForce-time graph of a particle of mass 6 kg is shown in figure, then change in linear momentum during t = 0 to t = 10 s is
View Solution
