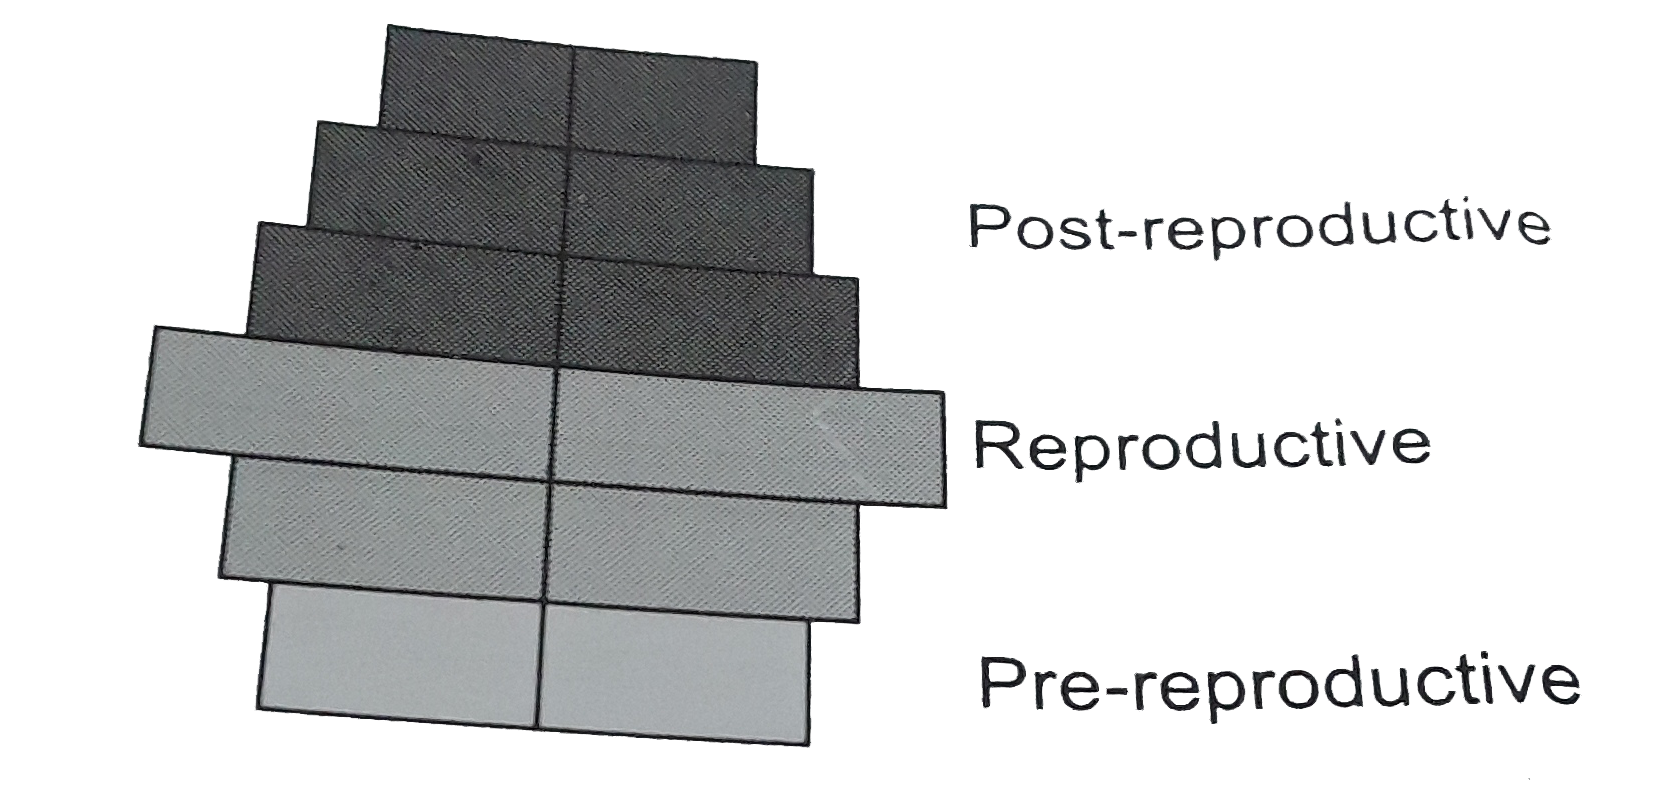
The age structures of a population represents
relative number of individuals at each age
number of new borns each year
number of individuals reaching puberty each year
relative number of deaths at each age
The correct Answer is:A
Step-by-Step Solution:
1. Understanding Age Structure: The age structure of a population refers to the distribution of individuals of different ages within that population. It provides insights into the demographic composition and potential growth trends of the population.
2. Categories of Age Groups: In human populations, age groups are typically divided into three main categories:
- Pre-Reproductive Age Group: This includes children and adolescents who are not yet of reproductive age.
- Reproductive Age Group: This group consists of individuals who are of marriageable age and are actively contributing to the workforce.
- Post-Reproductive Age Group: This includes older individuals who are past their reproductive years.
3. Representation of Age Structure: The age structure can be visually represented using an age pyramid. In this diagram:
- The base of the pyramid represents the pre-reproductive age group (younger individuals).
- As you move up the pyramid, you encounter the reproductive age group, followed by the post-reproductive age group at the apex.
4. What Age Structure Represents: The age structure represents the relative number of individuals at each age or within specific age groups. This information helps in understanding the potential for population growth or decline based on the number of individuals in each category.
5. Eliminating Incorrect Options:
- The age structure does not represent the number of newborns each year (this is related to natality).
- It does not specifically indicate the number of individuals reaching puberty each year, although it can give an idea about future reproductive potential.
- It is also not concerned with the relative number of deaths in the population, as it focuses primarily on age distribution rather than mortality rates.
6. Conclusion: Therefore, the correct interpretation of age structure is that it represents the relative number of individuals at each age or in each age group.
- Pre-Reproductive Age Group: This includes children and adolescents who are not yet of reproductive age.
- Reproductive Age Group: This group consists of individuals who are of marriageable age and are actively contributing to the workforce.
- Post-Reproductive Age Group: This includes older individuals who are past their reproductive years.
- The base of the pyramid represents the pre-reproductive age group (younger individuals).
- As you move up the pyramid, you encounter the reproductive age group, followed by the post-reproductive age group at the apex.
- The age structure does not represent the number of newborns each year (this is related to natality).
- It does not specifically indicate the number of individuals reaching puberty each year, although it can give an idea about future reproductive potential.
- It is also not concerned with the relative number of deaths in the population, as it focuses primarily on age distribution rather than mortality rates.
Topper's Solved these Questions
- ORGANISMS AND POPULATIONBook:NCERT FINGERTPS ENGLISHChapter:ORGANISMS AND POPULATIONExercise:HOTS
Explore 5 Videos
- ORGANISMS AND POPULATIONBook:NCERT FINGERTPS ENGLISHChapter:ORGANISMS AND POPULATIONExercise:NCERT
Explore 20 Videos
- MOLECULAR BASIS OF INHERITANCEBook:NCERT FINGERTPS ENGLISHChapter:MOLECULAR BASIS OF INHERITANCEExercise:Molecular Basis Of Inheritance
Explore 151 Videos
- PRACTICE PAPERSBook:NCERT FINGERTPS ENGLISHChapter:PRACTICE PAPERSExercise:Practice paper
Explore 150 Videos
Similar Questions
Knowledge Check
The age structures of a population influences population growth because
Ayounger females have more offsprings than do older femalesBdifferent ae groups have different reproductive capabilitiesCmore is the number of immature individuals, slower is the growth of populationDa shorter generation time results is slower population growth.Study the charactristics of a population represented in the graphs below.
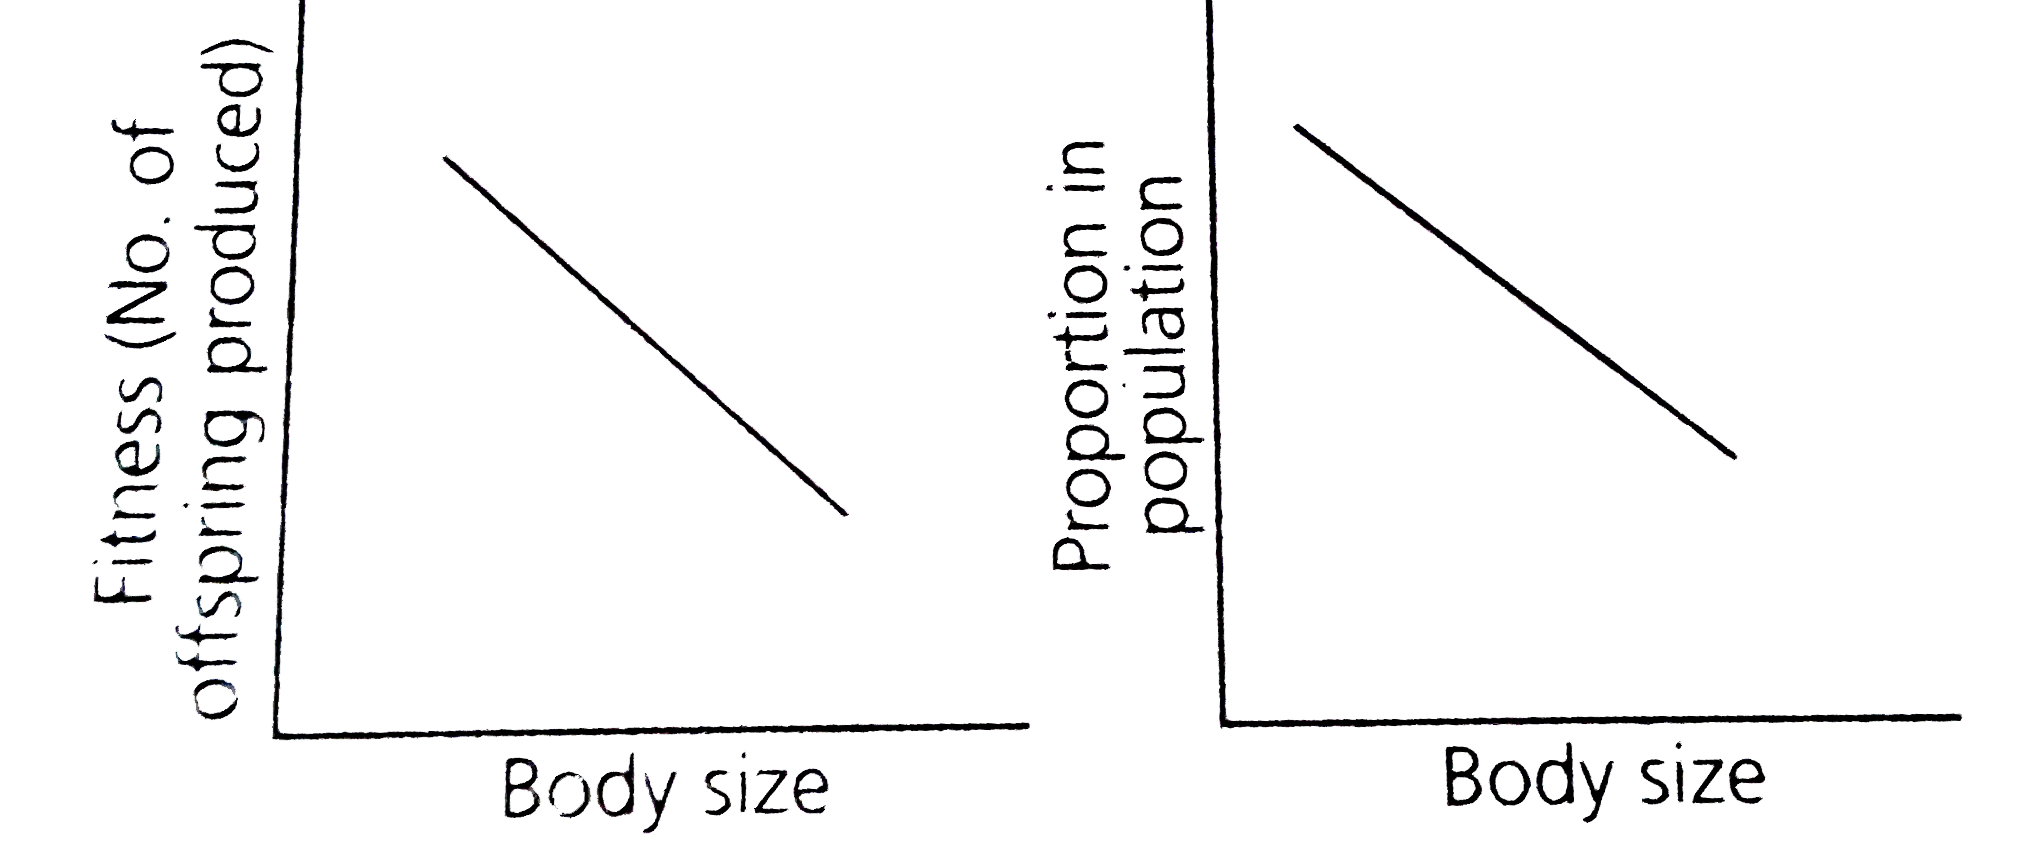
Mark the correct graph that represents the type of selection that this population is likely to undergo
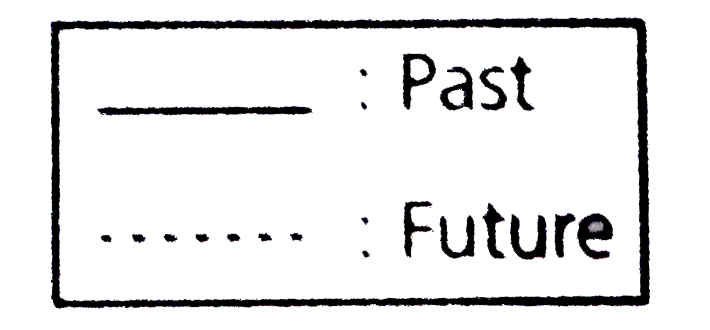 ADirectional selectionBStablising selectionCDisruptive selectionDBalancing selection
Study the charactristics of a population represented in the graphs below.

Mark the correct graph that represents the type of selection that this population is likely to undergo
 A
A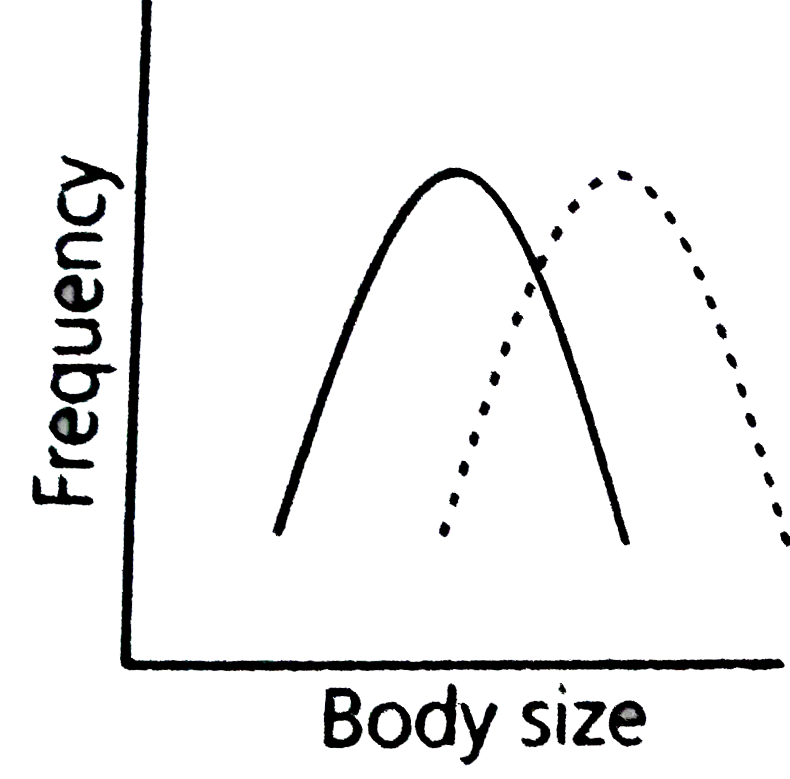 B
B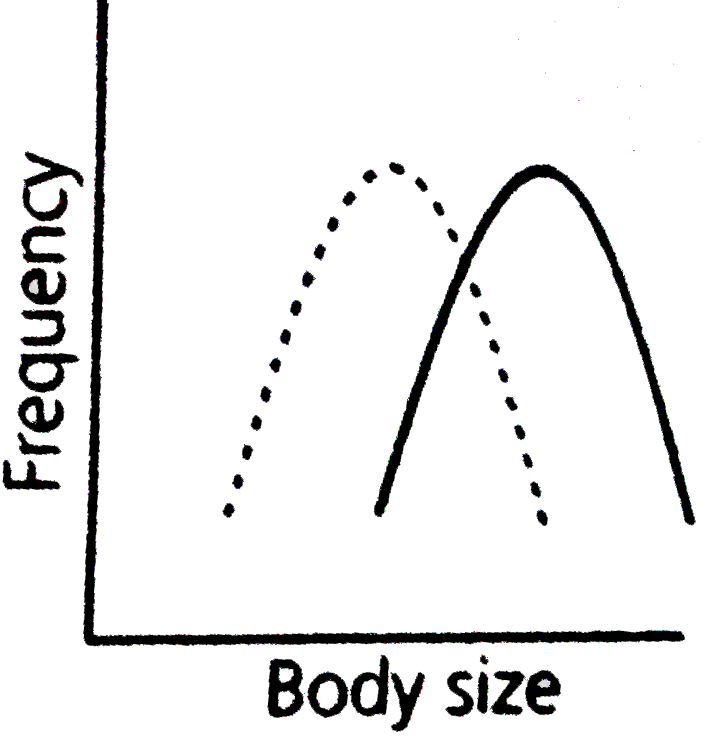 C
C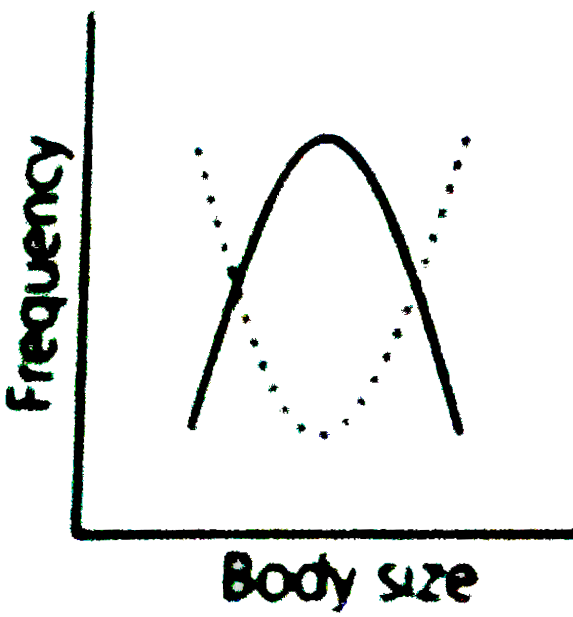 D
D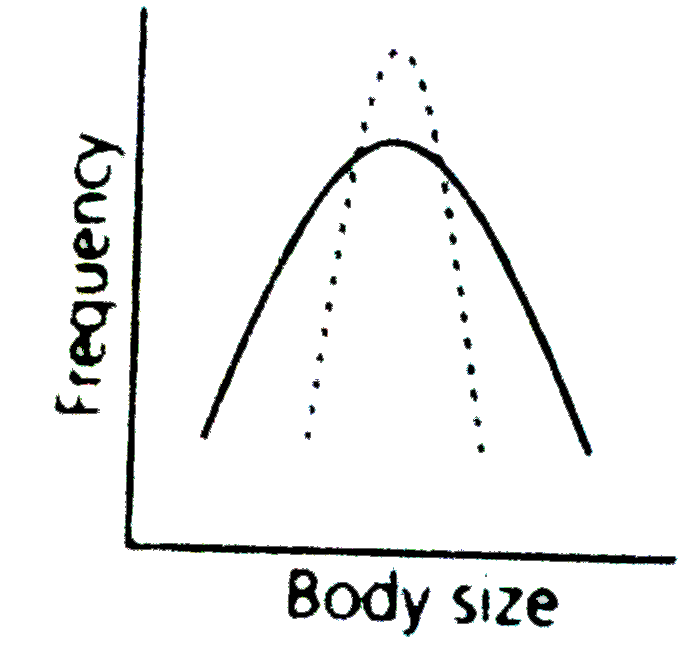
Assertion : Age sex structure of human population in countries like France and Germany gives a steep pytamid.
Reason : In countries like Sudan and India, the population is increasing at a rapid rate.
View SolutionVital index of a population is represented as
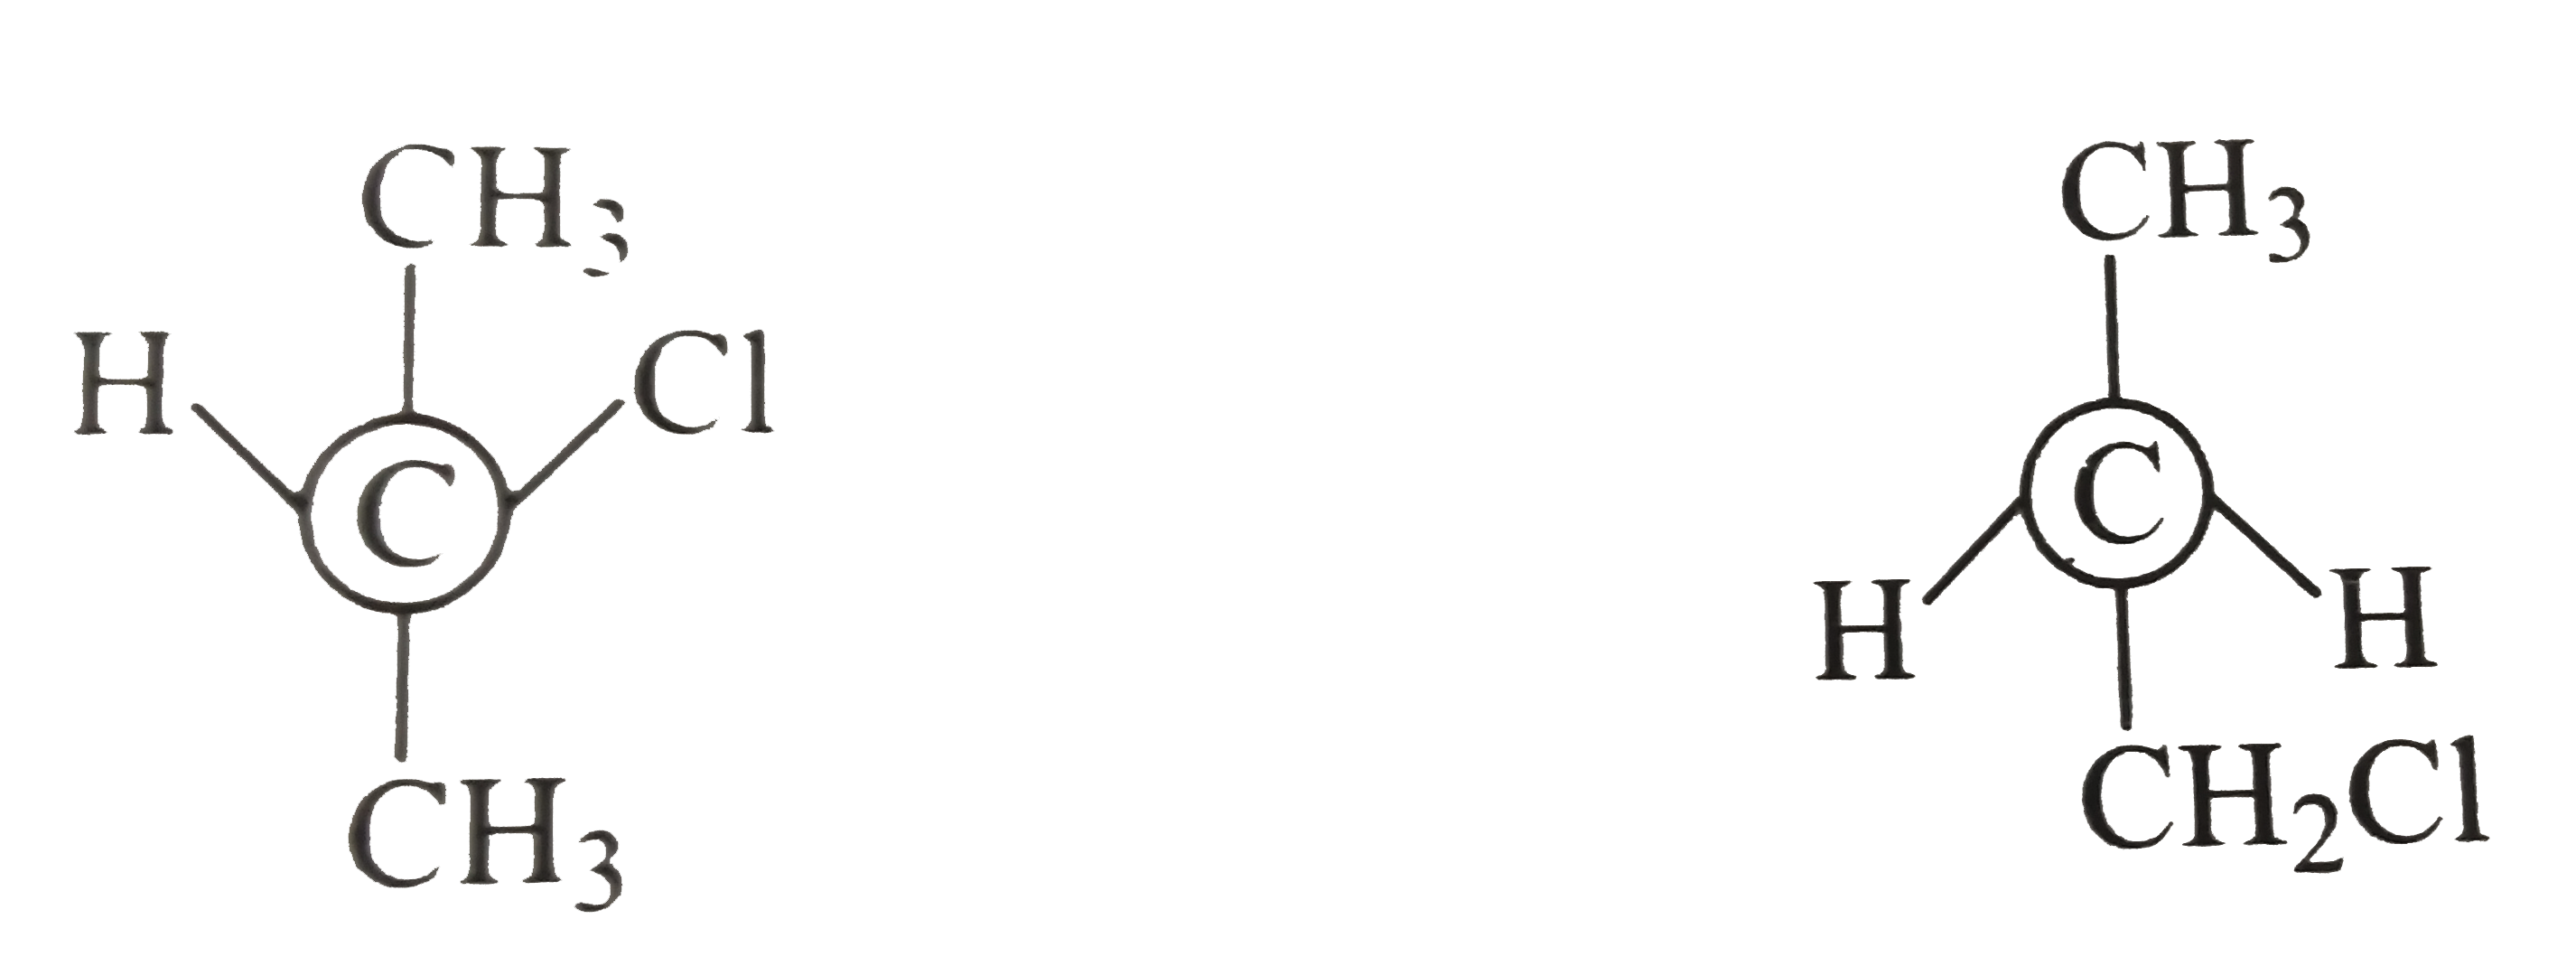
View SolutionThe pair of structures given below represents:
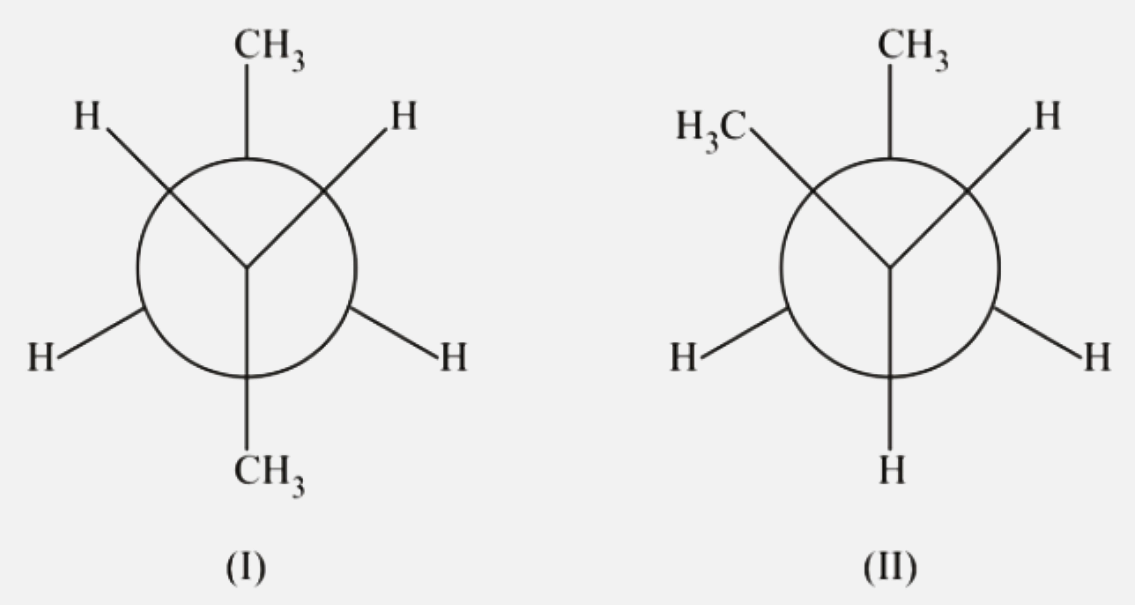
View SolutionThe pair of structure given below represents
View SolutionAssertion: Age, sex, structure of human popuJation in France and Sweden forms a steep pyramid.
Reason: To countries like Sudan and Lndia, the population is increasing at a rapid rate.
View Solution


