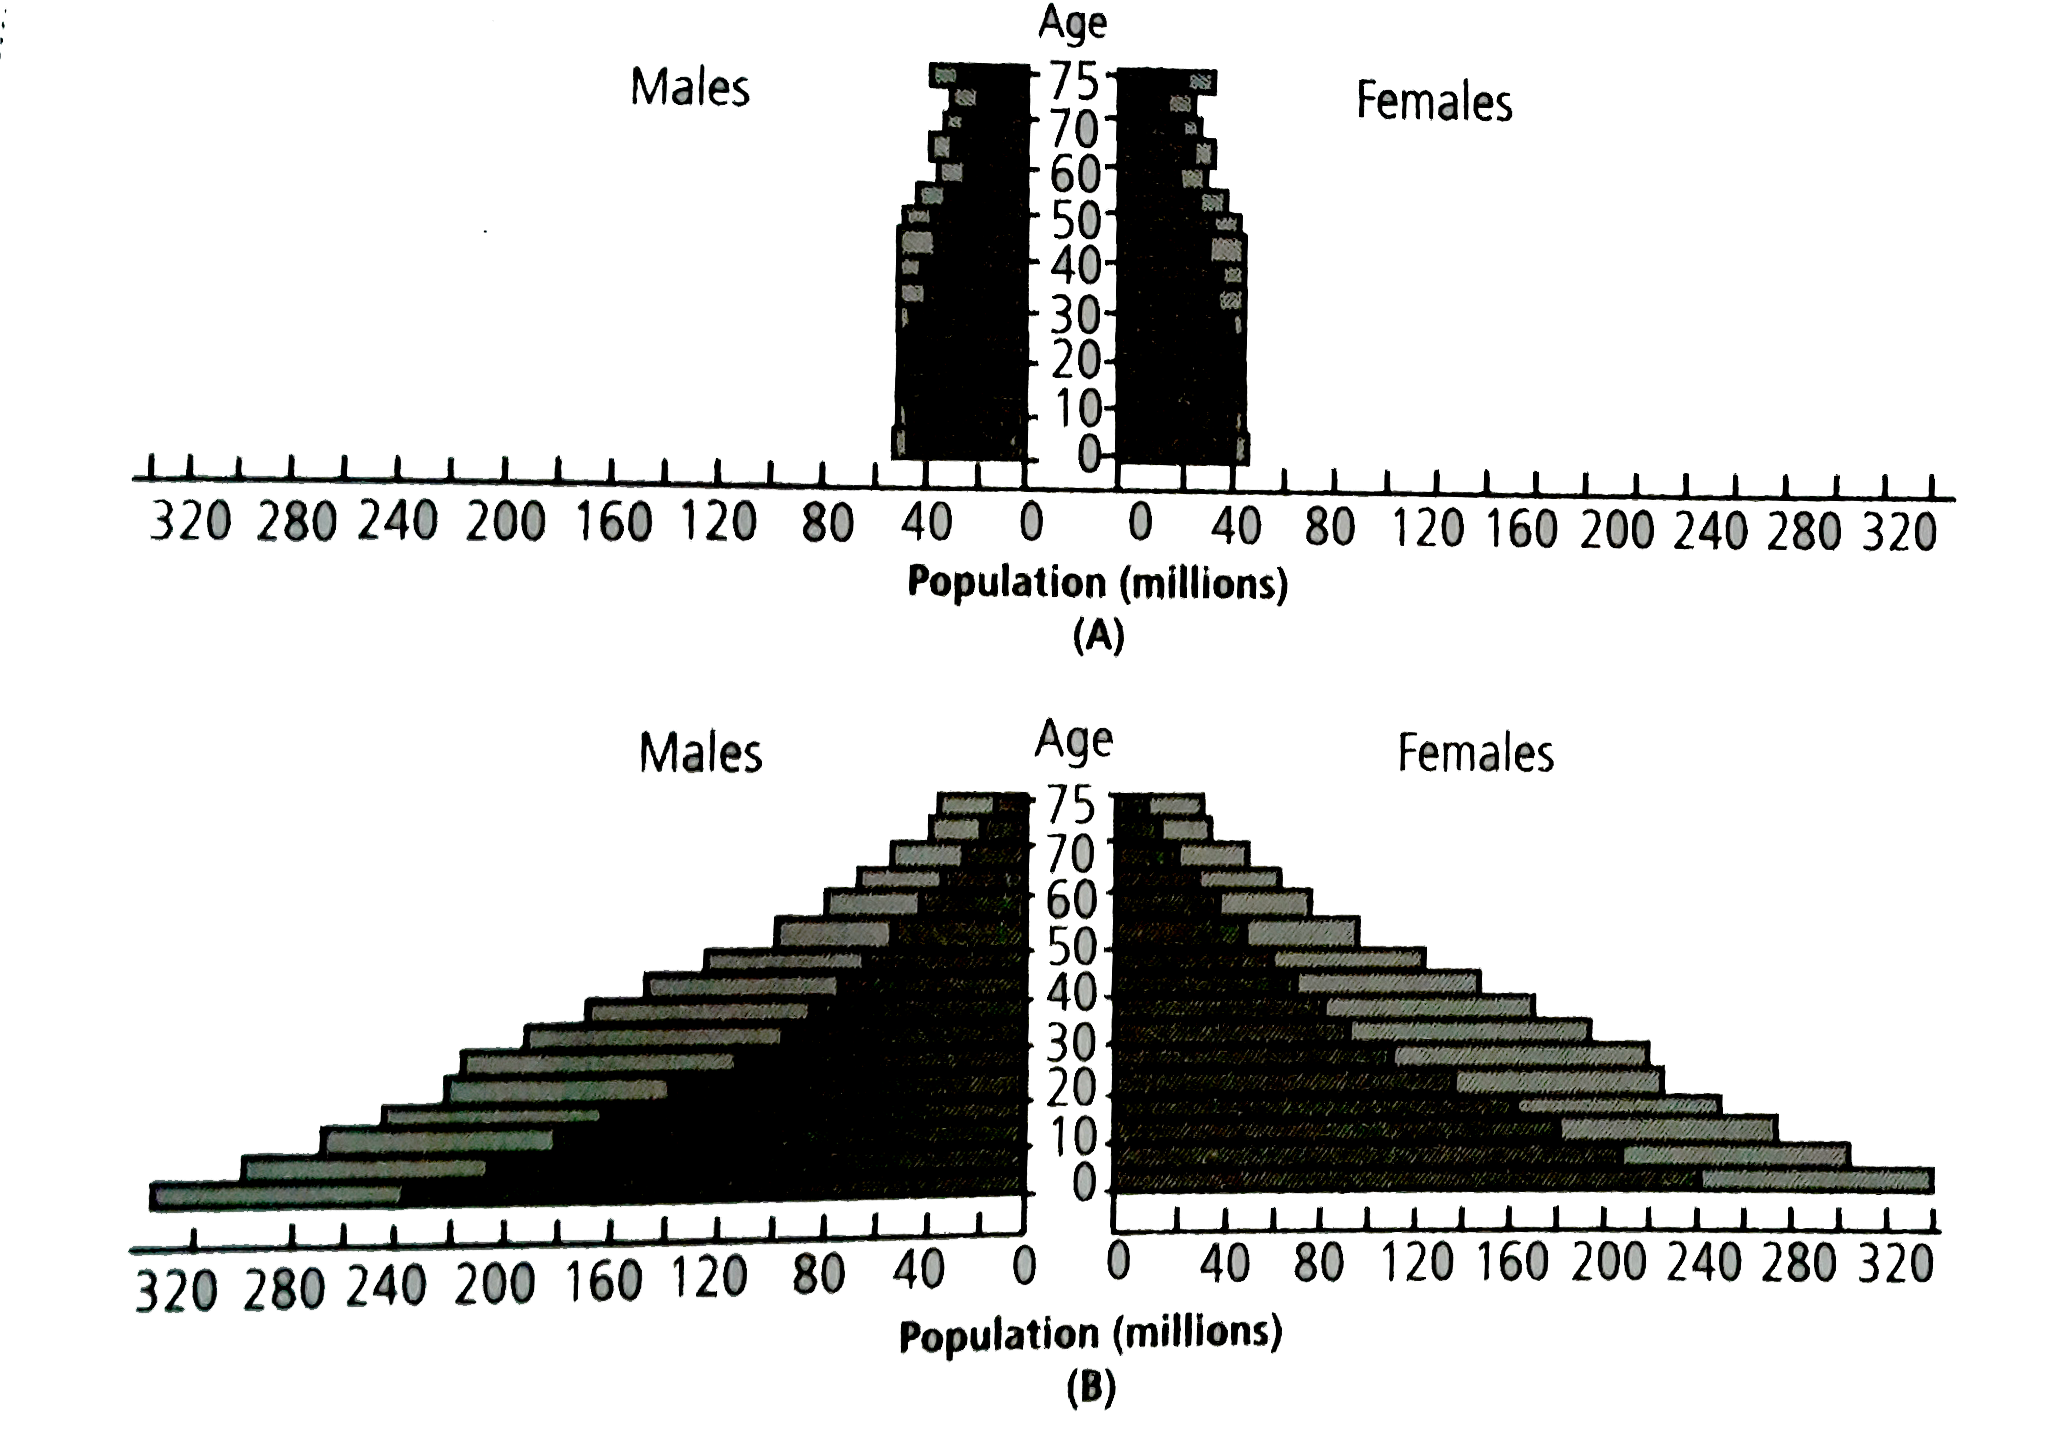
Age-sex sturcture of a population can be depicted in the form of a pyramid by plotting the percentage of population of each sex in each age class. Two age sex pyramids are given here.

Study carefully the above age-sex pyramids and select the correct statements regarding these.
A
A represents the age-sex pyramid for a developed country and B represents the age-sex pyramid for a developing country.
B
B is a much less steep pyramid, representing a radpdly growing population, like that of india, as it has a much larger number of young people.
C
A is a stepper pyramid, which represents a nearly stable population
D
All of these
Video Solution
Text Solution
The correct Answer is:D
Figures (A) and (B) show the age-sex pyramids for the developed and developing countries. A represents age-sex pyramid for a developed country which is a stepper pyramid showing nearly stable population with not much growth. B representsage-sex pyramid for a developing country, like india, which has rapidly growing population. it is a much less steep pyramid, as it has a much larger number of young people.
|
Topper's Solved these Questions
- ORGANISMS AND POPULATIONBook:NCERT FINGERTPS ENGLISHChapter:ORGANISMS AND POPULATIONExercise:HOTS
Explore 5 Videos
- ORGANISMS AND POPULATIONBook:NCERT FINGERTPS ENGLISHChapter:ORGANISMS AND POPULATIONExercise:NCERT
Explore 20 Videos
- MOLECULAR BASIS OF INHERITANCEBook:NCERT FINGERTPS ENGLISHChapter:MOLECULAR BASIS OF INHERITANCEExercise:Molecular Basis Of Inheritance
Explore 151 Videos
- PRACTICE PAPERSBook:NCERT FINGERTPS ENGLISHChapter:PRACTICE PAPERSExercise:Practice paper
Explore 150 Videos
Similar Questions
Knowledge Check
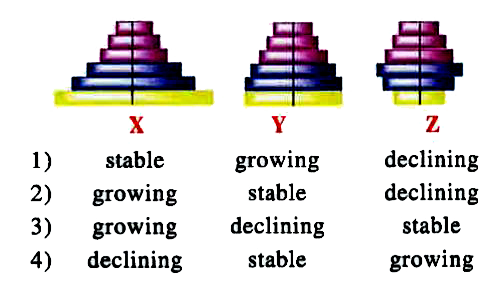
Study the age pyramids given below and select the correct statements regarding these.
 AA is a triangular age pyramid, where prereproductive stage is very large as compared to the reproductive and post-reproductive stages of the population. This type of age sturcture indicates that the population. This type of ae sturcture indicates that the population would increase rapidly.BB is an inverted bell shaped age pyramid, where number of pre-reproductive and reproductive individuals is almost equal. This type of age structure indicates that the population is stable.CC is an urn shaped age pyramid, where more number of reproductive individuals are present. This type of age structure indicates that the population is declining.DAll of these
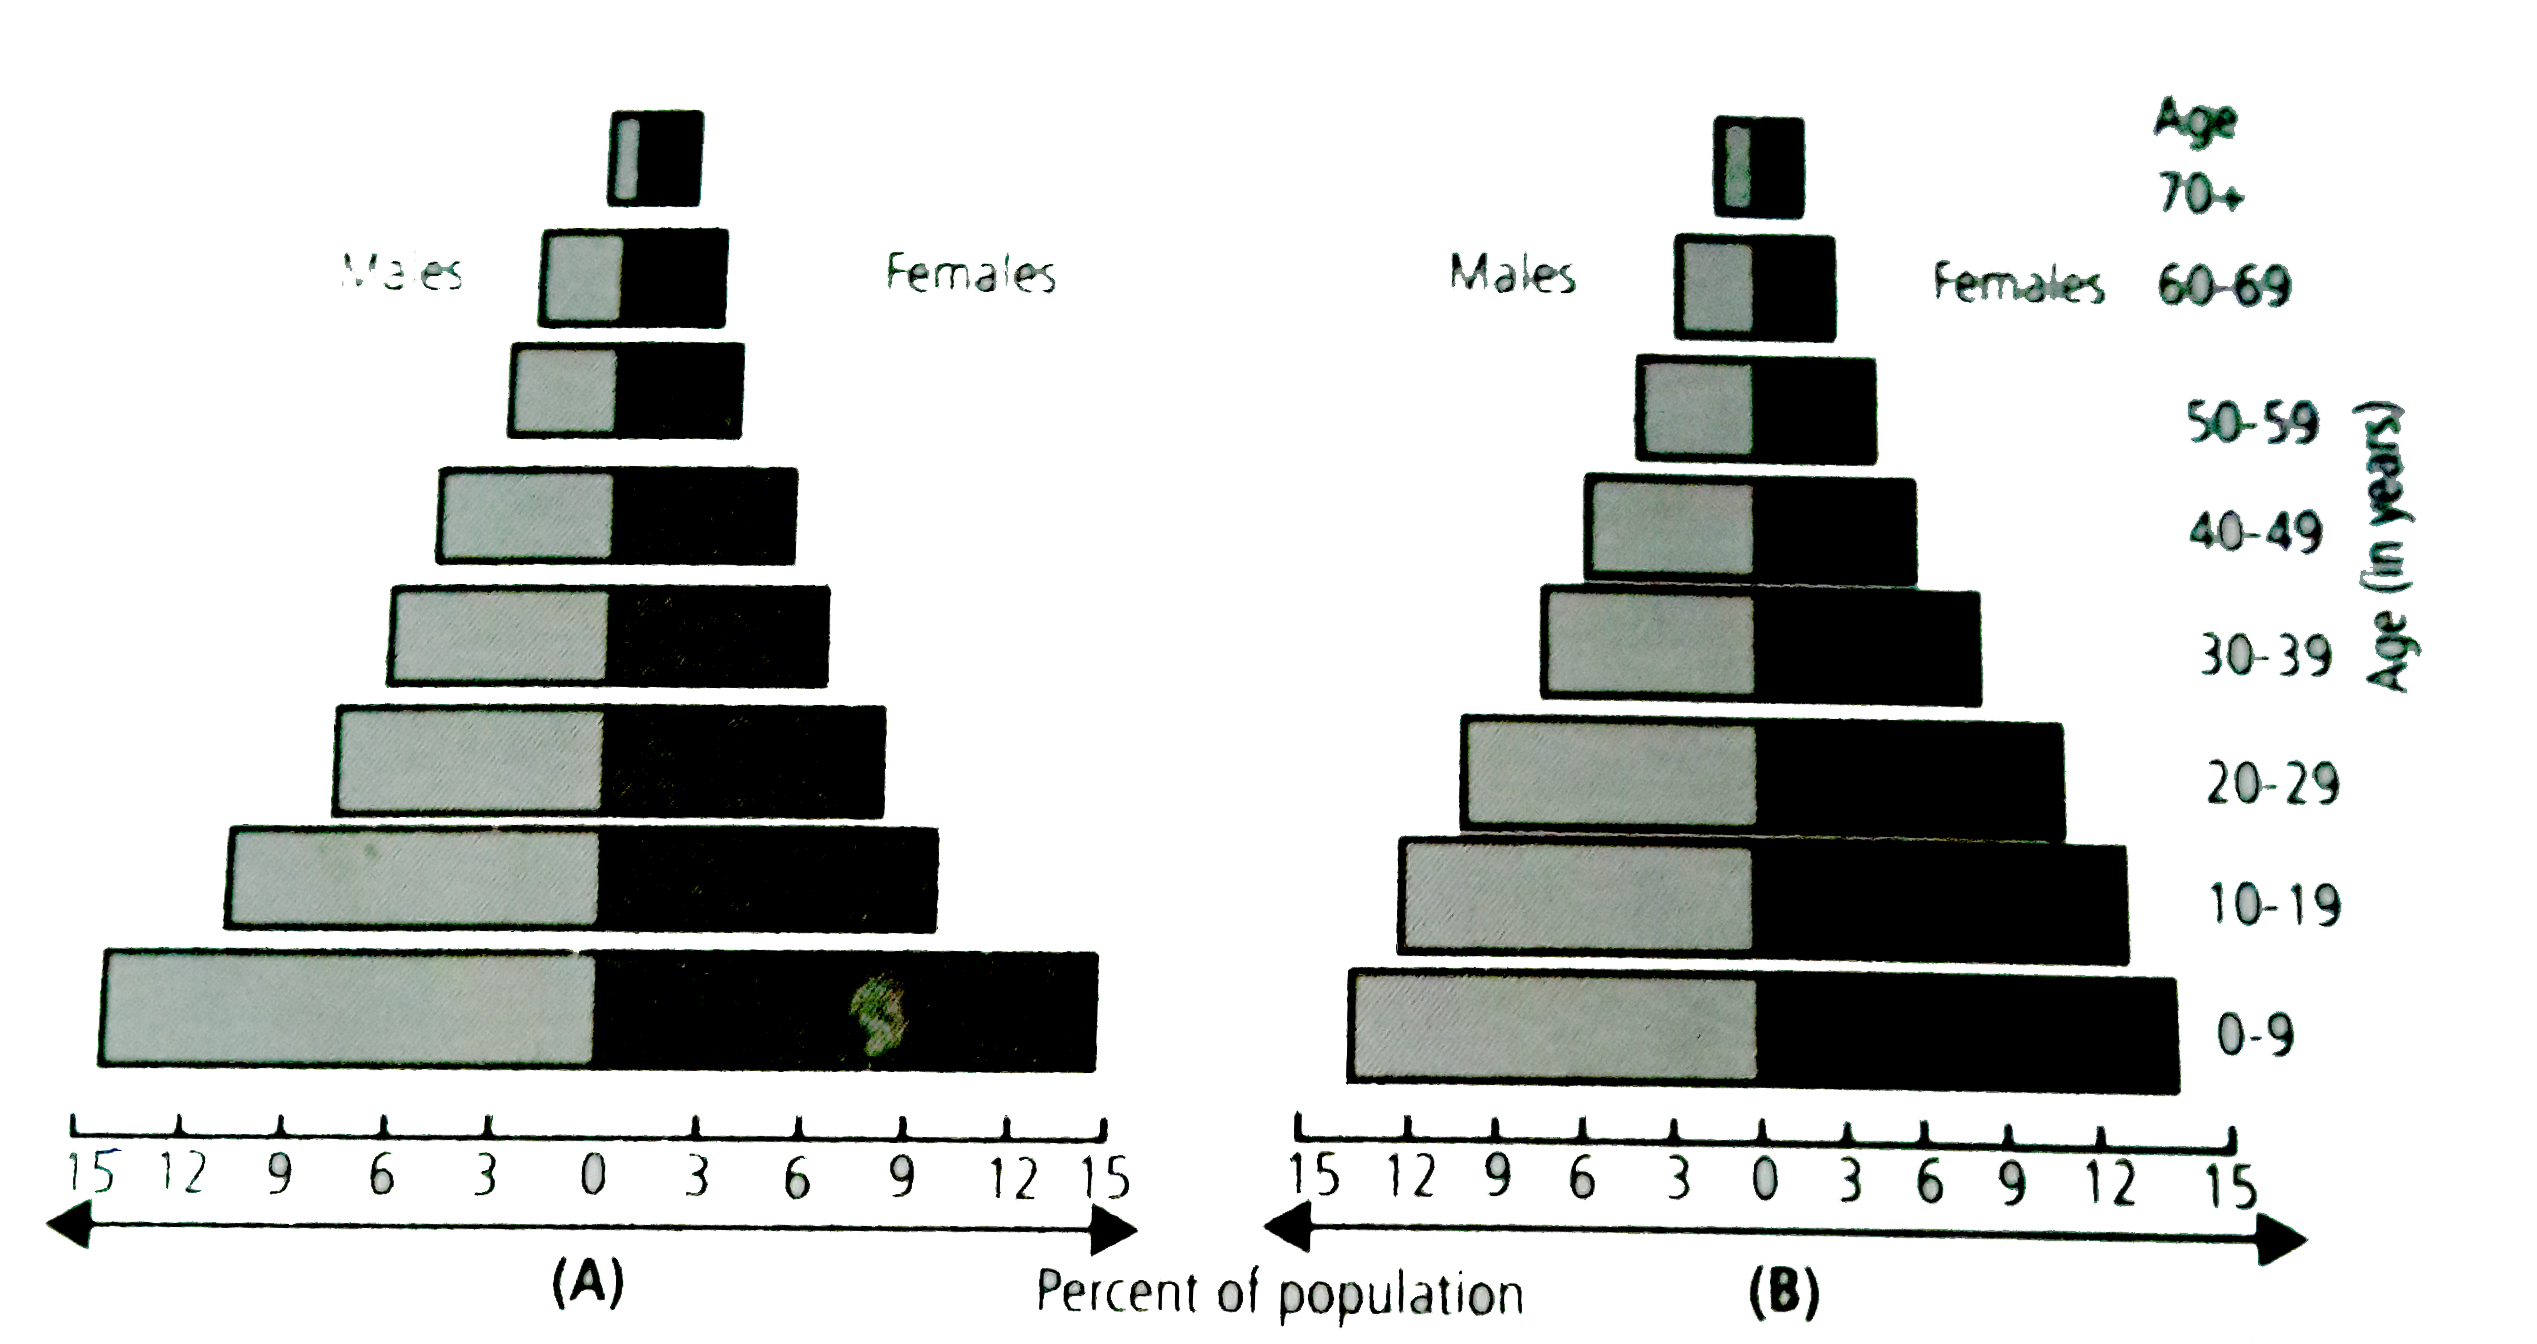
Given figures represent comparative age-sex pyramids for India for the years 1971 (figure A ) and 1991 (figure B), over the 20-year period. Study carefully the pyramids and select the correct statement regarding these.
 APyramid for year 1971 represents a nearly stable population.Bpyramid for year 1991 represents a declining populationCpyramid for year 1991 has a long way to go before it resembles that of a stable population.DAll of these
An urn shaped population age pyramid represents
Agrowing populationBstatic populationCdeclining populationDextinct population

Select the correct option w.r.t. Age pyramids.
View SolutionAge Pyramid of expanding population is :
View SolutionWhich of the following type of age pyramid reflects a stable population growth ?
View SolutionAn urn shaped population age pyramid represents
View SolutionWhich of the given age pyramid reflects a stable human population ?
View Solution


